Pine Script® indicator
Momentum Indicator (MOM)
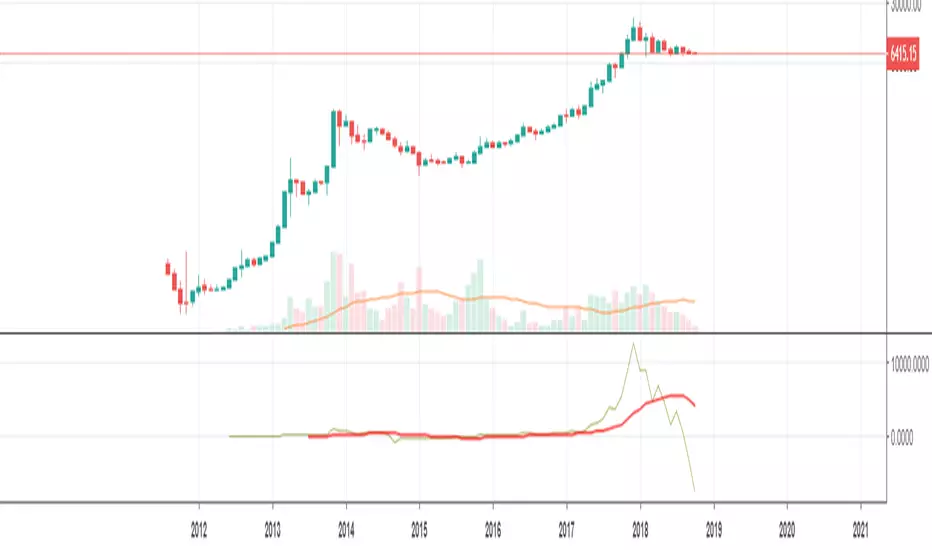
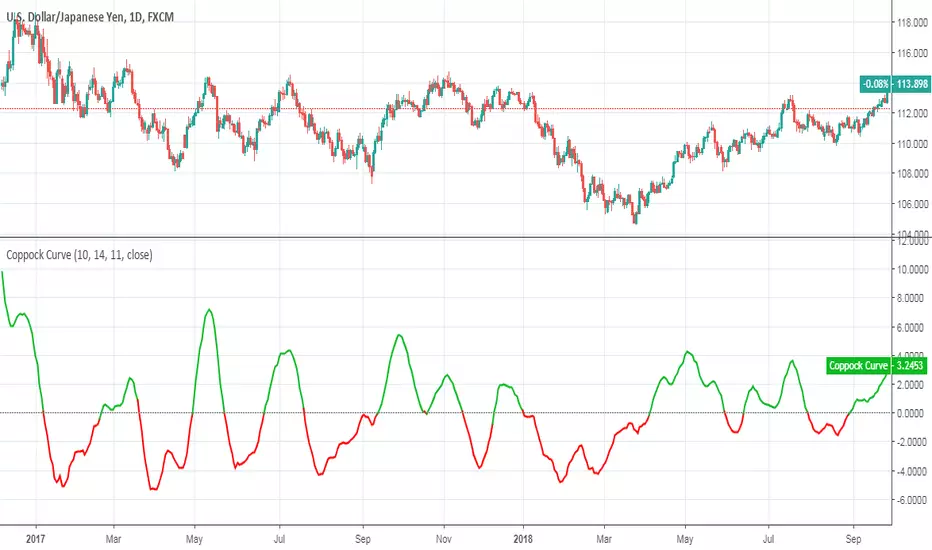
Coppock CurveThis indicator was originally developed by Edwin "Sedge" Coppock (Barron's Magazine, October 1962).
Specially for @AlexMayorov :
1) Buy when indicator crosses the zero line upside
2) Sell when indicator crosses the zero line downside
Pine Script® indicator
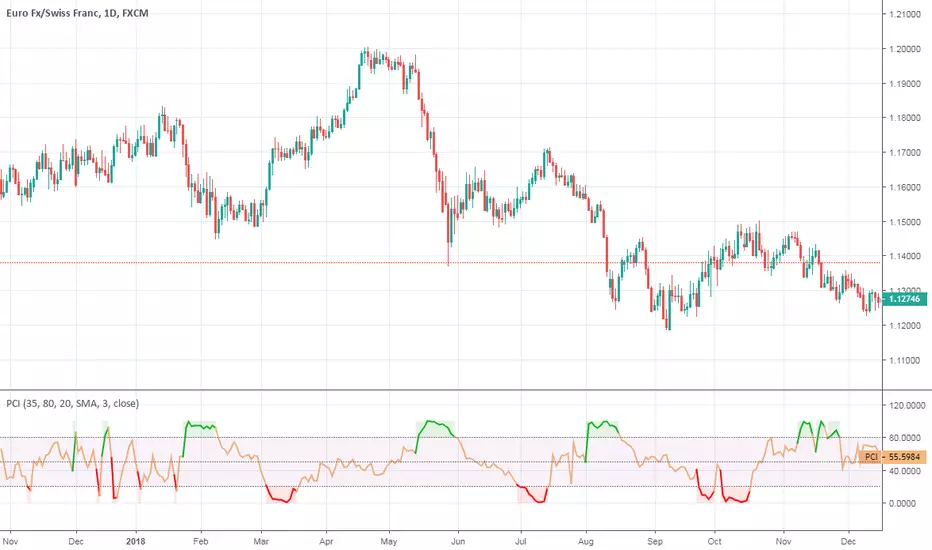
Phase Change IndexPhase Change Index script.
This indicator was developed and described by M. H. Pee (Stocks & Commodities V.22:5 (28-37): Phase Change Index).
Other indicators of M. H. Pee:
Pine Script® indicator
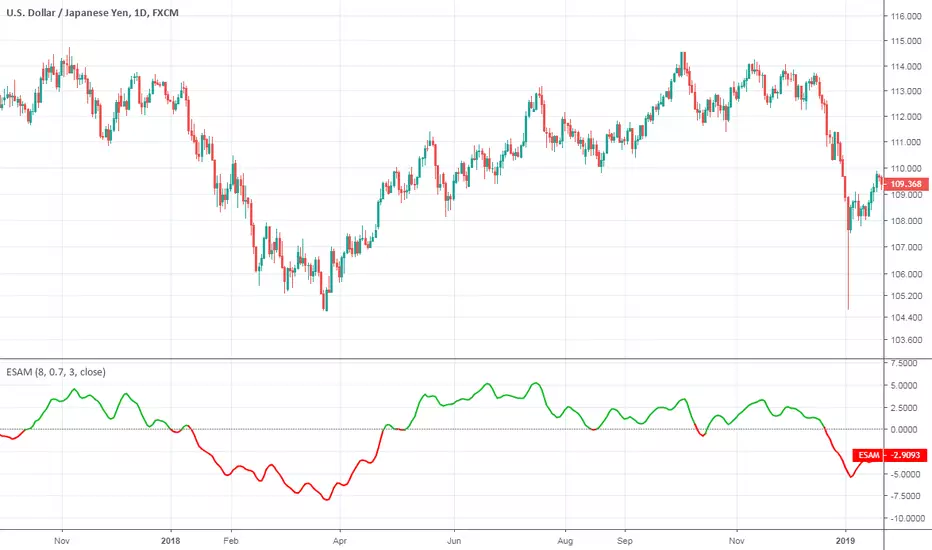
Ehlers Smoothed Adaptive MomentumEhlers Smoothed Adaptive Momentum script.
This indicator was developed and described by John F. Ehlers in his book "Cybernetic Analysis for Stocks and Futures" (2004, Chapter 12: Adapting to the Trend).
Pine Script® indicator
Pine Script® indicator

Pine Script® indicator
Pine Script® indicator

Pine Script® indicator

Pine Script® indicator

Stoch Momentum Index* Original code from UCSgears.
* Added circles for when Stoch MI and signal line crosses.
Pine Script® indicator

Pine Script® indicator

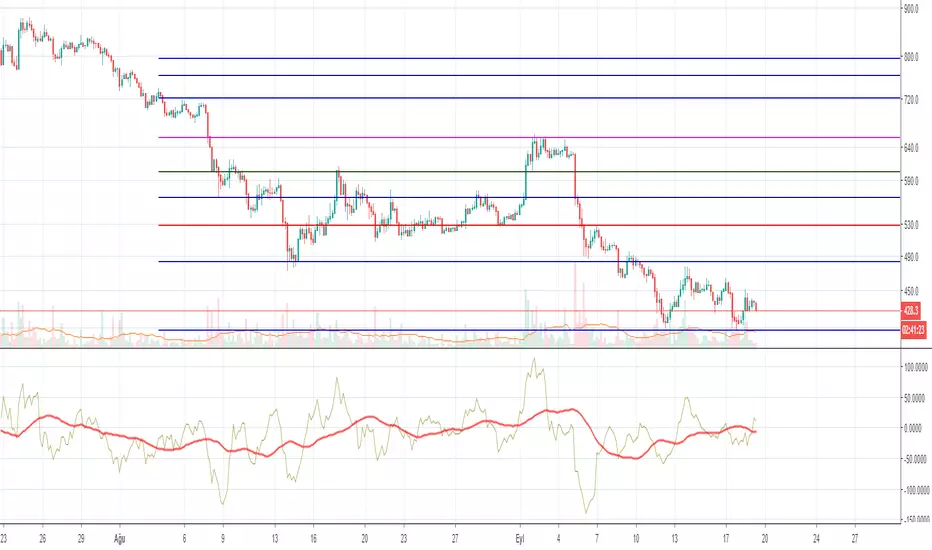
TrapTradingBuy on dips and sell into rallies. Simple as that.
- Short line (green)
- Base line (white)
- Long line (red)
When the market price touches the white or the red(green) lines, buy(sell) orders are generated.
The exit points are 2 lines above(below) the entries.
Parameters
- Period: It affects the value of Base line and the spacing of each line.
- Multiple: Specify the spacing between each line.
Pine Script® strategy

Dynamic Momentum Index (DMI) Backtest This indicator plots Dynamic Momentum Index indicator. The Dynamic Momentum
Index (DMI) was developed by Tushar Chande and Stanley Kroll. The indicator
is covered in detail in their book The New Technical Trader.
The DMI is identical to Welles Wilder`s Relative Strength Index except the
number of periods is variable rather than fixed. The variability of the time
periods used in the DMI is controlled by the recent volatility of prices.
The more volatile the prices, the more sensitive the DMI is to price changes.
In other words, the DMI will use more time periods during quiet markets, and
less during active markets. The maximum time periods the DMI can reach is 30
and the minimum is 3. This calculation method is similar to the Variable
Moving Average, also developed by Tushar Chande.
The advantage of using a variable length time period when calculating the RSI
is that it overcomes the negative effects of smoothing, which often obscure short-term moves.
The volatility index used in controlling the time periods in the DMI is based
on a calculation using a five period standard deviation and a ten period average
of the standard deviation.
You can change long to short in the Input Settings
WARNING:
- For purpose educate only
- This script to change bars colors.
Pine Script® strategy

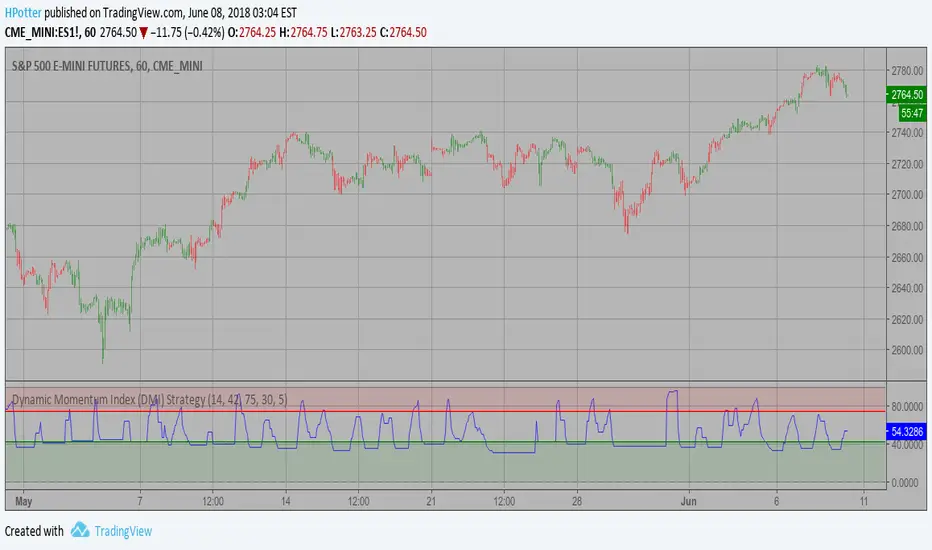
Dynamic Momentum Index (DMI) Strategy This indicator plots Dynamic Momentum Index indicator. The Dynamic Momentum
Index (DMI) was developed by Tushar Chande and Stanley Kroll. The indicator
is covered in detail in their book The New Technical Trader.
The DMI is identical to Welles Wilder`s Relative Strength Index except the
number of periods is variable rather than fixed. The variability of the time
periods used in the DMI is controlled by the recent volatility of prices.
The more volatile the prices, the more sensitive the DMI is to price changes.
In other words, the DMI will use more time periods during quiet markets, and
less during active markets. The maximum time periods the DMI can reach is 30
and the minimum is 3. This calculation method is similar to the Variable
Moving Average, also developed by Tushar Chande.
The advantage of using a variable length time period when calculating the RSI
is that it overcomes the negative effects of smoothing, which often obscure short-term moves.
The volatility index used in controlling the time periods in the DMI is based
on a calculation using a five period standard deviation and a ten period average
of the standard deviation.
WARNING:
- This script to change bars colors.
Pine Script® indicator
Pine Script® indicator

Trend Continuation FactorTrend Continuation Factor indicator script.
This indicator was originally developed by M.H. Pee (Stocks & Commodities V. 20:3 (58-64): Trend Continuation Factor).
Pine Script® indicator

Trend Detection IndexTrend Detection Index indicator script.
This indicator was originally developed by M.H. Pee (Stocks & Commodities V. 19:10 (54-61): Trend Detection Index).
Pine Script® indicator
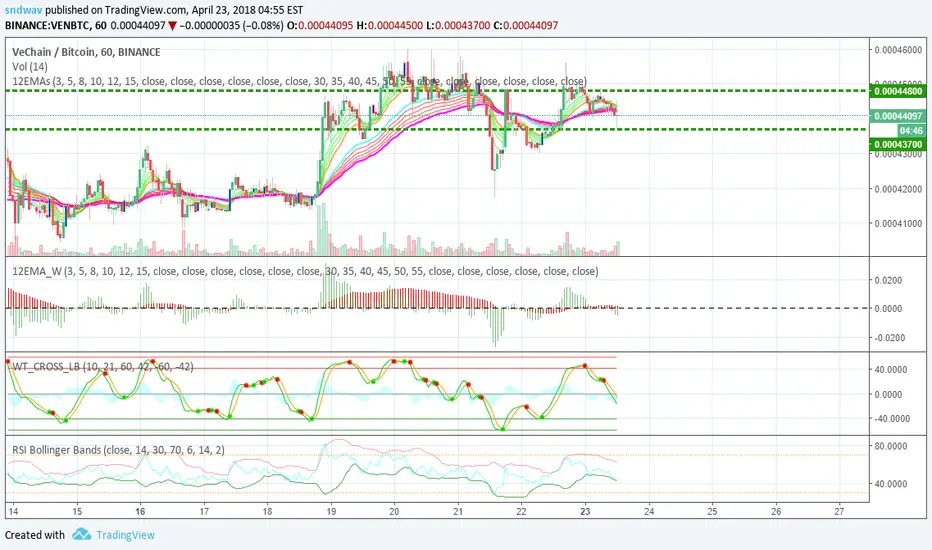
Frosted 12 EMA WIDTHThis is a complementary indicator for the 12 EMAs indicator ()
This width indicator shows the fanning width of each fan (shorter MAs and longer MAs).
To make things easier to see:
You can turn off one of the histograms to view just one of the widths (and add a 2nd instance of this indicator, turning off the other width).
Pine Script® indicator
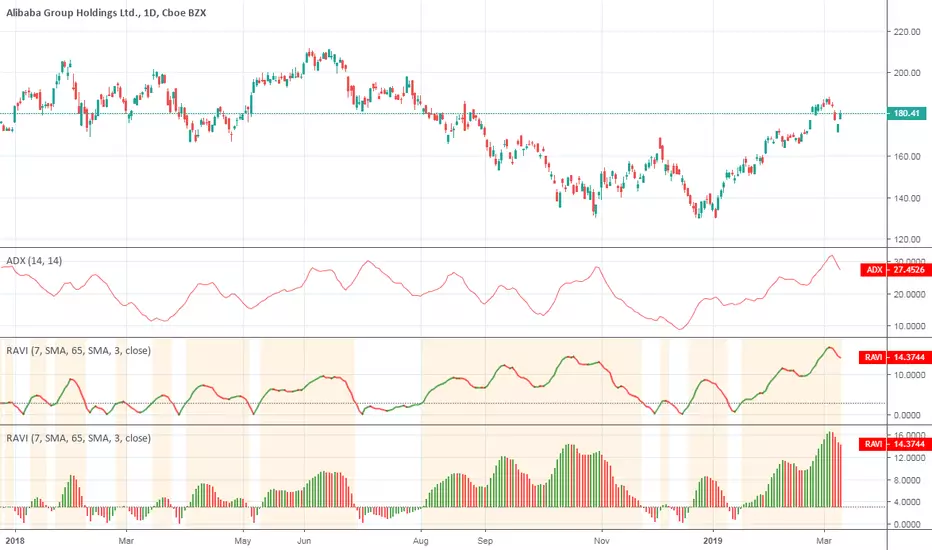
Range Action Verification Index (RAVI)Range Action Verification Index (RAVI) indicator script. This indicator was originally developed by Tushar Chande (see his book "Beyond Technical Analysis: How to Develop and Implement a Winning Trading System").
Pine Script® indicator
Pine Script® indicator

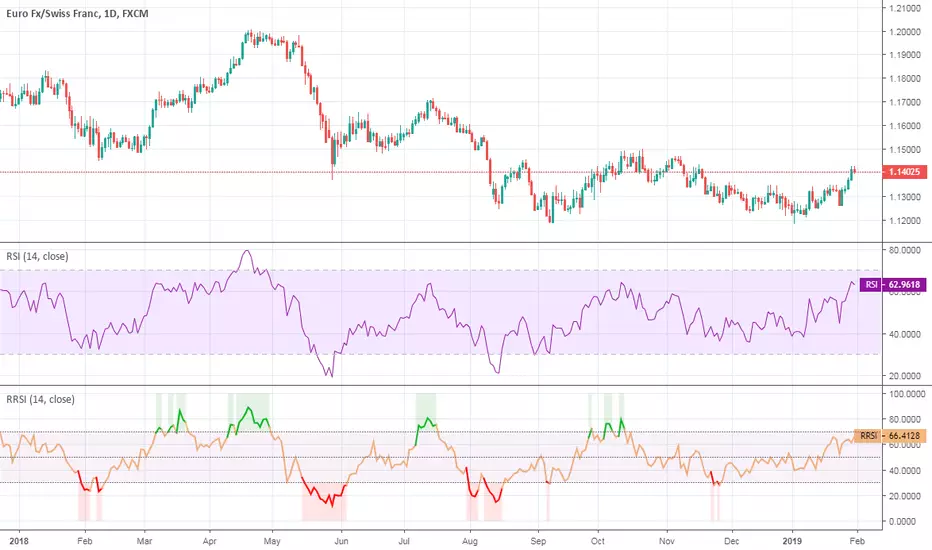
Rapid RSIRapid RSI indicator script. This indicator was originally developed by Ian Copsey (Stocks & Commodities V. 24:10 (16-23): Forex Focus).
Pine Script® indicator
Relative Momentum IndexRelative Momentum Index indicator script. This indicator was originally developed by Roger Altman (Stocks & Commodities V. 11:2 (57-60)).
RMI with momentum period of 1 will be equal to an RSI when they have the same period and source price.
Pine Script® indicator

Stochastic Momentum IndexStochastic Momentum Index indicator script. This indicator was originally developed by William Blau (Stocks & Commodities V. 11:1 (11-18)).
Pine Script® indicator
