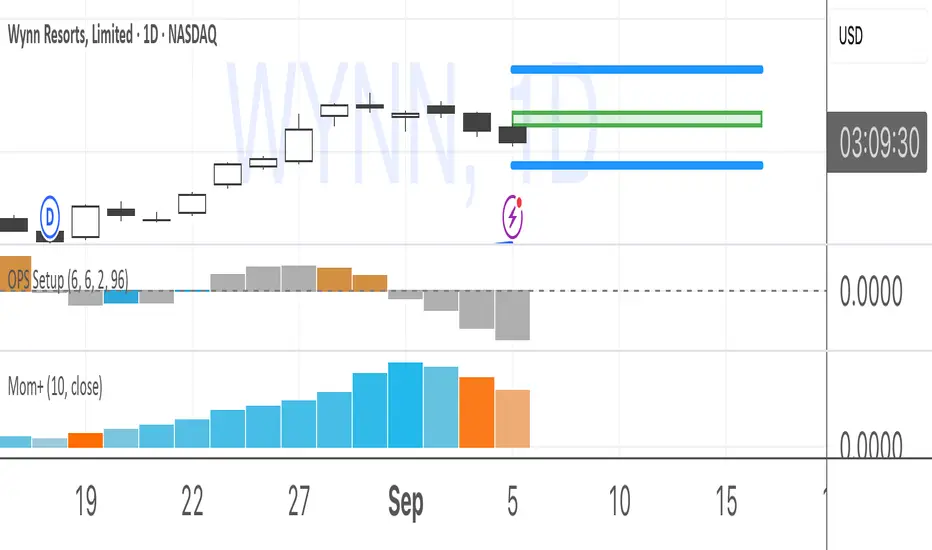
Indicator showing potential momentum divergences on Moving Average's Slope. The problem with the classic divergence is that when the signal appears, it is sometimes too late to enter a trade . The potential divergence corrects this problem by signaling the beginning of a potential divergence . Moving average slope is a momentum indicator that offers relevant...
Fast and Slow Trend-Line Momentum is a momentum indicator using FATL, SATL, RFTL, & RSTL Digital Filters What is FTLM-STLM? Fast Trend Line Momentum (FTLM) and Slow Trend Line Momentum (SLTM) indicators show the rate of price change, FATL and SATL are calculated the similar way as Momentum indicator. FTLM(bar) = FATL(bar) – RFTL(bar) STLM(bar) = SATL(bar) –...
Heavily modified version of my previous "Relative Aggregate Strength Oscillator" -Added high/low lines, alma curves,, lrc bands, changed candle calculations + other small things. Replaces the standard RSI indicator with something a bit more insightful. Credits to @wolneyyy - 'Mean Deviation Detector - Throw Out All Other Indicators ' And @algomojo - 'Responsive...
The Multi-timeframe momentum indicator is similar in concept to a velocity indicator like rate-of-change, but visualizes smoothed price changes by applying an EMA and linear regression to price difference at every bar. Momentums from 1 minute to 1 quarter are plotted on a single chart using the request.security function. Standard and Fibonacci timeframes are...
STD Aadaptive, floating RSX Dynamic Momentum Index is an attempt to improve Chande's original work on Dynamic Momentum Index. The full name of this indicator is "Standard-Deviation-Adaptive, floating-level, Dynamic Momentum Index on Jurik's RSX". What Is Dynamic Momentum Index? The dynamic momentum index is used in technical analysis to determine if a...
//Credits: @Noldo - Whale Trading System @rumpypumpydumpy - ALMA Ribbons @QuantNomad - Elastic Volume Weighted Moving Average Composite Indicator, created by taking QuantNomad's EVWMA and using that as input for a variation of rumpypumpydumpy's ALMA Ribbons. Each Ribbon had its sub ribbons summed up and then averaged. The averages were then...
Jurik Velocity ("smoother moment") is a very simple and very useful calculation. This indicator was created to expose this calculation to folks who might find it useful in their own indicators and strategies. What is velocity? Velocity is a vector quantity that refers to "the rate at which an object changes its position." Imagine a person moving rapidly - one...
Credits to @wolneyyy - "Mean Deviation Detector - Throw Out All Other Indicators" And @algomojo - "Responsive Coppock Curve" And the default Relative Strength Index The candles are the average of the MFI ,CCI ,MOM and RSI values presented as candles, they seemed similar enough in style to me so I created candles out of each and the took the sum of all the...
This Momentum indicator shows a green or red ribbon when smoothed momentum is bullish or bearish. It also includes a long moving average for overall trend confirmation. Wait until the ribbon holds above or below the long moving average and take positions in that direction. To get an easier to read momentum indicator, I smoothed the momentum out and paired it next...
Stacked Daily & Weekly EMAs + Labels Pretty much self-explanatory indicator that shows the current momentum based on the key exponential moving averages. Three stages of the EMAs: 1. Stacked Positively (Bullish) - EMAs are stacked on top of each other which represents a healthy bullish uptrend (green Label). 2. Stacked Negatively (Bearish) - EMAs are stacked...
If you struggle with the entries, low % win rate or trading the squeeze setup overall, this indicator is for you! If you look closely at your losing trades, chances are the losers have one thing in common = inverse momentum. I created this tool after I found out that Stacked EMAs and picture perfect trend is not the only thing you need for a squeeze setup....
A combination of "On Balance Volume (OBV)" and "Volume Oscillator". "OBV Momentum" is a trend momentum indicator, that can be used to identify strong trends and also trend changes based on volume. High positive values indicate strong volume on the buy side, high negative values indicate strong volume on the sell side. An increasing OBV momentum indicates a...
This is a score metric used by the Accelerating Dual Momentum strategy. According to the website you referenced when you created, the strategy is as follows: Strategy Rules This strategy allocates 100% of of the portfolio to one asset each month. 1. On the last trading day of each month, calculate the “momentum score” for the S&P 500 ( SPY ) and the...
The script shows change in a single EMA over a specified period as a histogram. The period of EMA as well as Change period can be specified. Moreover, it also shows change in direction of EMA. The change can be negative for a downward trend and positive for an upward trend.
This is a script based on the original TMA- RSI Divergence indicator by PhoenixBinary. The Phoenix Binary community and the TMA community built this version to be public code for the community for further use and revision after the reported passing of Phoenix Binary (The community extends our condolences to Phoenix's family. The intended uses are the same as the...
About this indicator: This indicator aims to combine two good performing strategies, which can be used separately or together, mainly for investment positions, although it can also be used for intraday trading. Strategy 1) Squeeze Oscillator and Average Directional Index: This strategy is taught by Jaime Aibsai, which determines market entries based on reading...
Momentum 2.0 is a normalized Momentum oscillator with a moving base-level. The oscillator value is normalized by its standard deviation, similar to the z-score technique. Instead of the zero level, the indicator uses the base-level calculated as the inverted long-term average value of the oscillator. Similar to the zero-level crossing signal used for the Momentum...
This Indicator use the calculated RSI of the top 13 stocks that have the highest market capitalization in SET:SET50 where suitable for TFEX trading( TFEX:S501! ) . Conducted with 2 RSI period as follow: RSI Main (14) RSI Average (100) How to use: 1) Use this Indicator by Crossover If the RSI Main Cross UP the RSI Average can assume as BUY...