[ETH] Optimized Trend Strategy - Lorenzo SuperScalpStrategy Title: Optimized Trend Strategy - Lorenzo SuperScalp
Description:
The Optimized Trend Strategy is a comprehensive trading system tailored for Ethereum (ETH) and optimized for the 15-minute timeframe but adaptable to various timeframes. This strategy utilizes a combination of technical indicators—RSI, Bollinger Bands, and MACD—to identify and act on price trends efficiently, providing traders with actionable buy and sell signals based on market conditions.
Key Features:
Multi-Indicator Approach:
RSI (Relative Strength Index): Identifies overbought and oversold conditions to time market entries and exits.
Bollinger Bands: Acts as a dynamic support and resistance level, helping to pinpoint precise entry and exit zones.
MACD (Moving Average Convergence Divergence): Detects momentum changes through bullish and bearish crossovers.
Signal Conditions:
Buy Signal:
RSI is below 45 (indicating an oversold condition).
Price is near or below the lower Bollinger Band.
MACD bullish crossover occurs.
Sell Signal:
RSI is above 55 (indicating an overbought condition).
Price is near or above the upper Bollinger Band.
MACD bearish crossunder occurs.
Trade Execution Logic:
Long Trades: Opened when a buy signal flashes. If there’s an open short position, it is closed before opening a long.
Short Trades: Opened when a sell signal flashes. If there’s an open long position, it is closed before opening a short.
The strategy also ensures a minimum number of bars between consecutive trades to avoid rapid trading in choppy conditions.
Pyramiding Support:
Up to 3 consecutive trades in the same direction are allowed, enabling traders to scale into positions based on strong signals.
Visual Indicators:
RSI Levels: Dotted lines at 45 and 55 for quick reference to oversold and overbought levels.
Buy and Sell Signals: Visual markers on the chart indicate where trades are executed, ensuring clarity on entry and exit points.
Best Used For:
Swing Trading & Scalping: While optimized for the 15-minute timeframe, this strategy works across various timeframes, making it suitable for both short-term scalping and swing trading.
Crypto Trading: Tailored for Ethereum but effective for other cryptocurrencies due to its dynamic indicator setup.
Moving Averages

Triple EMA Crossover StrategyTriple EMA Crossover Strategy
Overview
The Triple EMA Crossover Strategy is a trend-following trading system that utilizes three Exponential Moving Averages (EMAs) to identify potential entry and exit points in the market. This strategy is based on the principle that when shorter-term prices cross above longer-term prices, it can indicate a bullish trend, and conversely when they cross below, it can signal a bearish trend.
Components
Exponential Moving Averages (EMAs):
Short EMA: A fast-moving average that reacts quickly to price changes (commonly set to 9 periods).
Medium EMA: A medium-term average that smooths out price data and helps confirm trends (commonly set to 21 periods).
Long EMA: A slow-moving average that helps identify the overall trend direction (commonly set to 55 periods).
Trading Signals:
Buy Signal: A long entry is triggered when:
The Short EMA (9) crosses above the Medium EMA (21).
The Medium EMA (21) is above the Long EMA (55).
Sell Signal: A short entry is signaled when:
The Short EMA (9) crosses below the Medium EMA (21).
The Medium EMA (21) is below the Long EMA (55).
Stop Loss and Take Profit:
Stop Loss: Implement a predefined percentage or ATR-based stop loss to limit potential losses.
Take Profit: Set a target based on a risk-to-reward ratio that reflects your trading strategy's goals.
Advantages
Trend Identification: The EMA crossover system allows traders to identify the current trend dynamically, focusing on upward or downward price movements.
Simplicity: The strategy is straightforward, making it accessible for both new and experienced traders.
Flexibility: This method can be applied across multiple timeframes and asset classes, making it versatile for various trading styles.
Disadvantages
Lagging Indicator: Moving averages are lagging indicators, meaning signals may come later than the actual price movement, which can lead to missed opportunities.
Whipsaw Effect: In ranging markets, the strategy may produce false signals leading to potential losses.

Price Action StrategyThe **Price Action Strategy** is a tool designed to capture potential market reversals by utilizing classic reversal candlestick patterns such as Hammer, Shooting Star, Doji, and Pin Bar near dinamic support and resistance levels.
***Note to moderators
- The moving average was removed from the strategy because it was not suitable for the strategy and not participating in the entry or exit criteria.
- The moving average length has been replaced/renamed by the support/resistance lenght.
- The bullish engulfing and bearish engulfing patterns were also removed because in practice they were not working as entry criteria, since the candle price invariably closes far from the support/resistance level even considering the sensitivity range. There was no change in the backtest results after removing these patterns.
### Key Elements of the Strategy
1. Support and Resistance Levels
- Support and resistance are pivotal price levels where the asset has previously struggled to move lower (support) or higher (resistance). These levels act as psychological barriers where buying interest (at support) or selling interest (at resistance) often increases, potentially causing price reversals.
- In this strategy, support is calculated as the lowest low and resistance as the highest high over a 16-period length. When the price nears these levels, it indicates possible zones for a reversal, and the strategy looks for specific candlestick patterns to confirm an entry.
2. Candlestick Patterns
- This strategy uses classic reversal patterns, including:
- **Hammer**: Indicates a buy signal, suggesting rejection of lower prices.
- **Shooting Star**: Suggests a sell signal, showing rejection of higher prices.
- **Doji**: Reflects indecision and potential reversal.
- **Pin Bar**: Represents price rejection with a long shadow, often signaling a reversal.
By combining these reversal patterns with the proximity to dinamic support or resistance levels, the strategy aims to capture potential reversal movements.
3. Sensitivity Level
- The sensitivity parameter adjusts the acceptable range (Default 0.018 = 1.8%) around support and resistance levels within which reversal patterns can trigger trades (i.e. the closing price of the candle must occur within the specified range defined by the sensitivity parameter). A higher sensitivity value expands this range, potentially leading to less accurate signals, as it may allow for more false positives.
4. Entry Criteria
- **Buy (Long)**: A Hammer, Doji, or Pin Bar pattern near support.
- **Sell (Short)**: A Shooting Star, Doji, or Pin Bar near resistance.
5. Exit criteria
- Take profit = 9.5%
- Stop loss = 16%
6. No Repainting
- The Price Action Strategy is not subject to repainting.
7. Position Sizing by Equity and risk management
- This strategy has a default configuration to operate with 35% of the equity. The stop loss is set to 16% from the entry price. This way, the strategy is putting at risk about 16% of 35% of equity, that is, around 5.6% of equity for each trade. The percentage of equity and stop loss can be adjusted by the user according to their risk management.
8. Backtest results
- This strategy was subjected to deep backtest and operations in replay mode on **1000000MOGUSDT.P**, with the inclusion of transaction fees at 0.12% and slipagge of 5 ticks, and the past results have shown consistent profitability. Past results are no guarantee of future results. The strategy's backtest results may even be due to overfitting with past data.
9. Chart Visualization
- Support and resistance levels are displayed as green (support) and red (resistance) lines.
- Only the candlestick pattern that generated the entry signal to triger the trade is identified and labeled on the chart. During the operation, the occurrence of new Doji, Pin Bar, Hammer and Shooting Star patterns will not be demonstrated on the chart, since the exit criteria are based on percentage take profit and stop loss.
Doji:
Pin Bar and Doji
Shooting Star and Doji
Hammer
10. Default settings
Chart timeframe: 20 min
Moving average lenght: 16
Sensitivity: 0.018
Stop loss (%): 16
Take Profit (%): 9.5
BYBIT:1000000MOGUSDT.P

- Trading Bot – TopBot Anomaly Robot Strategy -- Introduction -
This strategy is based on a search for abnormal market price movements relative to a time-shifted main moving average. Different variations of the main moving average are created and shifted proportionally rather than linearly, giving the strategy greater reactivity and serving as position entry points. What's more ? This strategy stands out with a major innovation, allowing position exits to be set on variations in the moving average (and not on the moving average itself, like all strategies that close positions on return to the moving average), which greatly improves actual results.
- Detailed operation of the strategy -
It defines a function that calculates various moving averages (depending on the type of moving average defined by the user) and the chosen length. The function takes into account different types of moving averages: SMA, PCMA, EMA, WMA, DEMA, ZLEMA and HMA, and is offset in time so that it can be an entry or exit condition in real time (otherwise you'd have to wait for the next candle for the moving average to be calculated).
It calculates shifted variants (semi-parallel) as a percentage of this main moving average, high and low, to define position entry points (depending on user settings, up to 10 shifted levels for ten position entries for each direction). By calculating shifts as percentages rather than fixed values, the resulting deviations are not parallel to the main moving average, but can be used to detect sudden price contractions. By adjusting these deviations proportionally, we can observe variations relative to the main moving average more clearly, enabling us to detect dynamic support and resistance zones that adapt to market fluctuations. The fact that they are not strictly parallel avoids too rigid an interpretation and gives a more nuanced reading of trends, capturing small divergences that could indicate more subtle changes in market dynamics.
The most distinctive feature of this strategy concerns position exits: the script calculates two new moving averages shifted in proportion to the main moving average (adjustable) to define position exit price levels.
The strategy enters position when one of the deviations from the position entry moving average is crossed, and exits position when the deviation from the position exit moving average is crossed.
Position entry can be single or up to ten entry levels per direction to smooth trades. Differentiated settings are available for Longs and Shorts.
In this type of strategy, the return to the moving average is generally used as the position exit point, but this strategy incorporates a unique feature: the position exit can be made on a deviation from the moving average, adjustable and differentiated for Long and Short positions.
This is a major change compared to other strategies using a moving-average position exit, since the result is thatchanging the position exit point considerably improves the strategy's results .
Backtest with a classic exit back to the moving average :
Backtest with an exit back on an (adjustable) derivative of the moving average :
- “Ready to use” and user-adjustable parameters -
The strategy interface has been optimized for easy creation of trading robots, with all settings underlying the calculations and numerous options for optimization. Here are the contents of the strategy parameters interface:
In addition, important information about strategy settings and results is displayed directly on the chart. The percentage profit displayed may differ slightly from that of the backtest, as it includes potential profits from open trades (strategy.openprofit) in its calculation.
- Conditions, options and settings for graph and backtest presentation -
Here are the conditions and settings for the graph presented on the screen:
The strategy is set for 10 possible LONG and SHORT entries
10% of capital in x2 leverage is invested at each position entry (i.e. 20% of capital under backtest conditions)
The backtest runs for 14 months: from 08/17/2023 to 08/19/2024
It is carried out on PENDLEUSDT.P on BitGet Swap in 4H
LONGS strategy settings: 0.18 - 0.19 - 0.2 - 0.21 - 0.22 - 0.23 - 0.24 - 0.25 - 0.26 - 0.275 - LONGS output deviation: 0.03 (3%)
Strategy settings for SHORTS: 0.21 - 0.22 - 0.23 - 0.24 - 0.25 - 0.26 - 0.27 - 0.28 - 0.29 - 0.3 - LONGS output deviation: 0.032 (3.2%)
All other settings are strategy defaults - Broker fees + spread are set at 0.13% per trade
We can see several interesting points:
The strategy has very high winrate if set to this objective
The settings here have not been “over-optimized”, i.e. all 10 entries are unused, leaving room for larger-than-expected market movements in the future. In this particular case, it is set to favor safety over profitability optimization, but other approaches are possible to maximize profitability.
The result is 277.75% , thanks to the strategy's adjustment of position exit levels. With a conventional exit at the moving average, results are only 204.47%, a significant difference.
- How to adjust and apply the strategy? -
Generally speaking, the strategy works well on a large proportion of cryptocurrencies, especially for LONG positions. The recommended timeframes are: 30M-45M-1H-2H-3H-4H and the most appropriate timeframe will vary according to the cryptocurrency. It is also possible, with certain assets, to run the strategy on shorter timeframes such as 5M or 15M with success.
The strategy can be used with a single position entry level, maximizing capital utilization on each trade and/or having several strategies active on a single account at the same time
It can also be used in a “safe” way, using up to ten successive entries to smooth out unforeseen market movements and minimize risk as much as possible. In this case, enter positions with 1/10 of the capital each time, for a setting of ten entries, and give preference to a single active bot per account so that all positions can be covered (a fixed dollar amount, not a percentage, is then recommended)
The recommended leverage is x1 or x2 for controlled long-term trading, especially with ten entry levels, although sometimes higher leverage could be considered with controlled risk.
Here's how to set up the strategy:
Start by finding a cryptocurrency displaying a nice curve with the default settings
Then try out the default settings on all timeframes, and select the timeframe with the best curve or the best result
Deactivate shorts
Set the first long triggerlevel to the value that gives the best result
(optional): Change the moving average type, period and data source to find the most optimized setting before proceeding to the next step
Set the 10thlong inputlevel to the last value modifying the result
Set the 8 intermediate input levels, distributing them as evenly as possible
Then adjust the output level of the longs, which can greatly improve the results
Temporarily deactivate the longs, activate the shorts and follow the same process
Reactivate longs and shorts
- How to program robots for automated trading using this strategy -
If you want to use this strategy for automated trading, it's very simple. All you need is an account with a cryptocurrency broker that allows APIs, and an intermediary between TradinView and your broker who will manage your orders.
Here's how it works:
On your intermediary, create a bot that will manage the details of your orders (amount, single or multiple entries, exit conditions). This bot is linked to the broker via an API and will be able to place real orders. Each bot has four different signals that enable it to be activated via a webhook. When one of the signals is received, it executes the orders for you.
On TradingView, set the strategy to a suitable asset and timeframe. Once set, enter in the strategy parameters the signals specific to the bot you've created. Confirm and close the parameters.
Still on TradingView, create an alarm based on your set strategy (on the strategy tester). Give the alarm the name of your choice and in “Message” enter only{{strategy.order.comment}}.
In alarm notifications, activate the webhook and enter the webhook of your trading intermediary. Confirm the alarm.
As long as the alarm is activated in TradingView, the strategy will monitor the market and send an order to enter or exit a position as soon as the conditions are met. Your bot will receive the instruction and place orders with your broker. Subsequent changes to the strategy settings do not change those stored in the alarm. If you wish to change the settings for one of your bots, simply delete the old alarm and create a new one.
Note: In your bot settings, on your intermediary, make sure to allow: - Multiple inputs - A single output signal to close all positions - Stoploss disabled (if necessary, use the strategy one)

Gabriel's Witcher Strategy [65 Minute Trading Bot]Strategy Description: Gabriel's Witcher Strategy
Author: Gabriel
Platform: TradingView Pine Script (Version 5)
Backtested Asset: Avalanche (Coinbase Brokage for Volume adjustment)
Timeframe: 65 Minutes
Strategy Type: Comprehensive Trend-Following and Momentum Strategy with Scalping and Risk Management Features
Overview
Gabriel's Witcher Strategy is an advanced trading bot designed for the Avalanche pair on a 65-minute timeframe. This strategy integrates a multitude of technical indicators to identify and execute high-probability trading opportunities. By combining trend-following, momentum, volume analysis, and range filtering, the strategy aims to capitalize on both long and short market movements. Additionally, it incorporates scalping mechanisms and robust risk management features, including take-profit (TP) levels and commission considerations, to optimize trade performance and profitability.
====Key Components====
Source Selection:
Custom Source Flexibility: Allows traders to select from a wide range of price and volume sources (e.g., Close, Open, High, Low, HL2, HLC3, OHLC4, VWAP, On-Balance Volume, etc.) for indicator calculations, enhancing adaptability to various trading styles.
Various curves of Volume Analysis are employed:
Tick Volume Calculation: Utilizes tick volume as a fallback when actual volume data is unavailable, ensuring consistency across different data feeds.
Volume Indicators: Incorporates multiple volume-based indicators such as On-Balance Volume (OBV), Accumulation/Distribution (AccDist), Negative Volume Index (NVI), Positive Volume Index (PVI), and Price Volume Trend (PVT) for comprehensive market analysis.
Trend Indicators:
ADX (Average Directional Index): Measures trend strength using either the Classic or Masanakamura method, with customizable length and threshold settings. It's used to open positions when the mesured trend is strong, or exit when its weak.
Jurik Moving Average (JMA): A smooth moving average that reduces lag, configurable with various parameters including source, resolution, and repainting options.
Parabolic SAR: Identifies potential reversals in market trends with adjustable start, increment, and maximum settings.
Custom Trend Indicator: Utilizes highest and lowest price points over a specified timeframe to determine current and previous trend bases, visually represented with color-filled areas.
Momentum Indicators:
Relative Strength Index (RSI): Evaluates the speed and change of price movements, smoothed with a custom length and source. It's used to not enter the market for shorts in oversold or longs for overbought conditions, and to enter for long in oversold or shorts for overboughts.
Momentum-Based Calculations: Employs both Double Exponential Moving Averages (DEMA) on a MACD-based RSI to enhance momentum signal accuracy which is then further accelerated by a Hull MA. This is the technical analysis tool that determines bearish or bullish momentum.
OBV-Based Momentum Conditions: Uses two exponential moving averages of OBV to determine bullish or bearish momentum shifts, anomalities, breakouts where banks flow their funds in or Smart Money Concepts trade.
Moving Averages (MA):
Multiple MA Types: Includes Simple Moving Average (SMA), Exponential Moving Average (EMA), Weighted Moving Average (WMA), Hull Moving Average (HMA), and Volume-Weighted Moving Average (VWMA), selectable via input parameters.
MA Speed Calculation: Measures the percentage change in MA values to determine the direction and speed of the trend.
Range Filtering:
Variance-Based Filter: Utilizes variance and moving averages to filter out trades during low-volatility periods, enhancing trade quality.
Color-Coded Range Indicators: Visualizes range filtering with color changes on the chart for quick assessment.
Scalping Mechanism:
Heikin-Ashi Candles: Optionally uses Heikin-Ashi candles for smoother price action analysis.
EMA-Based Trend Detection: Employs fast, medium, and slow EMAs to determine trend direction and potential entry points.
Fractal-Based Filtering: Detects regular or BW (Black & White) fractals to confirm trade signals.
Take Profit (TP) Management:
Dynamic TP Levels: Calculates TP levels based on the number of consecutive long or short entries, adjusting targets to maximize profits.
TP Signals and Re-Entry: Plots TP signals on the chart and allows for automatic re-entry upon TP hit, maintaining continuous trade flow.
Risk Management:
Commission Integration: Accounts for trading commissions to ensure net profitability.
Position Sizing: Configured to use a percentage of equity for each trade, adjustable via input parameters.
Pyramiding: Allows up to one additional position per direction to enhance gains during strong trends.
Alerts and Visual Indicators:
Buy/Sell Signals: Plots visual indicators (triangles and flags) on the chart to signify entry and TP points.
Bar Coloring: Changes bar colors based on ADX and trend conditions for immediate visual cues.
Price Levels: Marks significant price levels related to TP and position entries with cross styles.
Input Parameters
Source Settings:
Custom Sources (srcinput): Choose from various price and volume sources to tailor indicator calculations.
ADX Settings:
ADX Type (ADX_options): Select between 'CLASSIC' and 'MASANAKAMURA' methods.
ADX Length (ADX_len): Defines the period for ADX calculation.
ADX Threshold (th): Sets the minimum ADX value to consider a strong trend.
RSI Settings:
RSI Length (len_3): Period for RSI calculation.
RSI Source (src_3): Source data for RSI.
Trend Strength Settings:
Channel Length (n1): Period for trend channel calculation.
Average Length (n2): Period for smoothing trend strength.
Jurik Moving Average (JMA) Settings:
JMA Source (inp): Source data for JMA.
JMA Resolution (reso): Timeframe for JMA calculation.
JMA Repainting (rep): Option to allow JMA to repaint.
JMA Length (lengths): Period for JMA.
Parabolic SAR Settings:
SAR Start (start): Initial acceleration factor.
SAR Increment (increment): Acceleration factor increment.
SAR Maximum (maximum): Maximum acceleration factor.
SAR Point Width (width): Visual width of SAR points.
Trend Indicator Settings:
Trend Timeframe (timeframe): Period for trend indicator calculations.
Momentum Settings:
Source Type (srcType): Select between 'Price' and 'VWAP'.
Momentum Source (srcPrice): Source data for momentum calculations.
RSI Length (rsiLen): Period for momentum RSI.
Smooth Length (sLen): Smoothing period for momentum RSI.
OBV Settings:
OBV Line 1 (e1): EMA period for OBV line 1.
OBV Line 2 (e2): EMA period for OBV line 2.
Moving Average (MA) Settings:
MA Length (length): Period for MA calculations.
MA Type (matype): Select MA type (1: SMA, 2: EMA, 3: HMA, 4: WMA, 5: VWMA).
Range Filter Settings:
Range Filter Length (length0): Period for range filtering.
Range Filter Multiplier (mult): Multiplier for range variance.
Take Profit (TP) Settings:
TP Long (tp_long0): Percentage for long TP.
TP Short (tp_short0): Percentage for short TP.
Scalping Settings:
Scalping Activation (ACT_SCLP): Enable or disable scalping.
Scalping Length (HiLoLen): Period for scalping indicators.
Fast EMA Length (fastEMAlength): Period for fast EMA in scalping.
Medium EMA Length (mediumEMAlength): Period for medium EMA in scalping.
Slow EMA Length (slowEMAlength): Period for slow EMA in scalping.
Filter (filterBW): Enable or disable additional fractal filtering.
Pullback Lookback (Lookback): Number of bars for pullback consideration.
Use Heikin-Ashi Candles (UseHAcandles): Option to use Heikin-Ashi candles for smoother trend analysis.
Strategy Logic
Indicator Calculations:
Volume and Source Selection: Determines the primary data source based on user input, ensuring flexibility and adaptability.
ADX Calculation: Computes ADX using either the Classic or Masanakamura method to assess trend strength.
RSI Calculation: Evaluates market momentum using RSI, further smoothed with custom periods.
Trend Strength Assessment: Utilizes trend channel and average lengths to gauge the robustness of current trends.
Jurik Moving Average (JMA): Smooths price data to reduce lag and enhance trend detection.
Parabolic SAR: Identifies potential trend reversals with adjustable parameters for sensitivity.
Momentum Analysis: Combines RSI with DEMA and OBV-based conditions to confirm bullish or bearish momentum.
Moving Averages: Employs multiple MA types to determine trend direction and speed.
Range Filtering: Filters out low-volatility periods to focus on high-probability trades.
Trade Conditions:
Long Entry Conditions:
ADX Confirmation: ADX must be above the threshold, indicating a strong uptrend.
RSI and Momentum: RSI below 70 and positive momentum signals.
JMA and SAR: JMA indicates an uptrend, and Parabolic SAR is below the price.
Trend Indicator: Confirms the current trend direction.
Range Filter: Ensures market is in an upward range.
Scalping Option: If enabled, additional scalping conditions must be met.
Short Entry Conditions:
ADX Confirmation: ADX must be above the threshold, indicating a strong downtrend.
RSI and Momentum: RSI above 30 and negative momentum signals.
JMA and SAR: JMA indicates a downtrend, and Parabolic SAR is above the price.
Trend Indicator: Confirms the current trend direction.
Range Filter: Ensures market is in a downward range.
Scalping Option: If enabled, additional scalping conditions must be met.
Position Management:
Entry Execution: Places long or short orders based on the identified conditions and user-selected position types (Longs, Shorts, or Both).
Take Profit (TP): Automatically sets TP levels based on predefined percentages, adjusting dynamically with consecutive trades.
Re-Entry Mechanism: Allows for automatic re-entry upon TP hit, maintaining active trading positions.
Exit Conditions: Closes positions when TP levels are reached or when opposing trend signals are detected.
Visual Indicators:
Bar Coloring: Highlights bars in green for bullish conditions, red for bearish, and orange for neutral.
Plotting Price Levels: Marks significant price levels related to TP and trade entries with cross symbols.
Signal Shapes: Displays triangle and flag shapes on the chart to indicate trade entries and TP hits.
Alerts:
Custom Alerts: Configured to notify traders of long entries, short entries, and TP hits, enabling timely trade management and execution.
Usage Instructions
Setup:
Apply the Strategy: Add the script to your TradingView chart set to BTCUSDT with a 65-minute timeframe.
Configure Inputs: Adjust the input parameters under their respective groups (e.g., Source Settings, ADX, RSI, Trend Strength, etc.) to match your trading preferences and risk tolerance.
Position Selection:
Choose Position Type: Use the Position input to select Longs, Shorts, or Both based on your market outlook.
Execution: The strategy will automatically execute and manage positions according to the selected type, ensuring targeted trading actions.
Signal Interpretation:
Buy Signals: Blue triangles below the bars indicate potential long entry points.
Sell Signals: Red triangles above the bars indicate potential short entry points.
Take Profit Signals: Flags above or below the bars signify TP hits for long and short positions, respectively.
Bar Colors: Green bars suggest bullish conditions, red bars indicate bearish conditions, and orange bars represent neutral or consolidating markets.
Risk Management:
Default Position Size: Set to 100% of equity. Adjust the default_qty_value as needed for your risk management strategy.
Commission: Accounts for a 0.1% commission per trade. Adjust the commission_value to match your broker's fees.
Pyramiding: Allows up to one additional position per direction to enhance gains during strong trends.
Backtesting and Optimization:
Historical Testing: Utilize TradingView's backtesting features to evaluate the strategy's performance over historical data.
Parameter Tuning: Optimize input parameters to align the strategy with current market dynamics and personal trading objectives.
Alerts Configuration:
Set Up Alerts: Enable and configure alerts based on the predefined alertcondition statements to receive real-time notifications of trade signals and TP hits.
Additional Features
Comprehensive Indicator Integration: Combines multiple technical indicators to provide a holistic view of market conditions, enhancing trade signal accuracy.
Scalping Options: Offers an optional scalping mechanism to capitalize on short-term price movements, increasing trading flexibility.
Dynamic Take Profit Levels: Adjusts TP targets based on the number of consecutive trades, maximizing profit potential during favorable trends.
Advanced Volume Analysis: Utilizes various volume indicators to confirm trend strength and validate trade signals.
Customizable Range Filtering: Filters trades based on market volatility, ensuring trades are taken during optimal conditions.
Heikin-Ashi Candle Support: Optionally uses Heikin-Ashi candles for smoother price action analysis and reduced noise.
====Recommendations====
Thorough Backtesting:
Historical Performance: Before deploying the strategy in a live trading environment, perform comprehensive backtesting to understand its performance under various market conditions. These are the premium settings for Avalanche Coinbase.
Optimization: Regularly review and adjust input parameters to ensure the strategy remains effective amidst changing market volatility and trends. Backtest the strategy for each crypto and make sure you are in the right brokage when using the volume sources as it will affect the overall outcome of the trading strategy.
Risk Management:
Position Sizing: Adjust the default_qty_value to align with your risk tolerance and account size.
Stop-Loss Implementation: Although the strategy includes TP levels, they're also consided to be a stop-loss mechanisms to protect against adverse market movements.
Commission Adjustment: Ensure the commission_value accurately reflects your broker's fees to maintain realistic backtesting results. Generally, 0.1~0.3% are most of the average broker's comission fees.
Slipage: The slip comssion is 1 Tick, since the strategy is adjusted to only enter/exit on bar close where most positions are available.
Continuous Monitoring:
Strategy Performance: Regularly monitor the strategy's performance to ensure it operates as expected and make adjustments as needed. A max-drawndown hit has been added to operate in case the premium Avalanche settings go wrong, but you can turn it off an adjust the equity percentage to 50% if you are confortable with the high volatile max-drown or even 100% if your account allows you to borrow cash.
Customization:
Indicator Parameters: Tailor indicator settings (e.g., ADX length, RSI period, MA types) to better fit your specific trading style and market conditions.
Scalping Options: Enable or disable scalping based on your trading preferences and risk appetite.
Conclusion
Gabriel's Witcher Strategy is a robust and versatile trading solution designed to navigate the complexities of the Crypto market. By integrating a wide array of technical indicators and providing extensive customization options, this strategy empowers traders to execute informed and strategic trades. Its comprehensive approach, combining trend analysis, momentum detection, volume evaluation, and range filtering, ensures that trades are taken during optimal market conditions. Additionally, the inclusion of scalping features and dynamic take-profit management enhances the strategy's adaptability and profitability potential. Unlike any trading strategy, with both diligent testing and continuous monitoring under the strategy tester, it's possible to achieve sustained success by adjusting the settings to the individual Crypto that need it, for example this one is preset for Avalanche Coinbase 65 Miinutes but it can be adjust for BTCUSD or Etherium if you backtest and search for the right settings.

VIDYA ProTrend Multi-Tier ProfitHello! This time is about a trend-following system.
VIDYA is quite an interesting indicator that adjusts dynamically to market volatility, making it more responsive to price changes compared to traditional moving averages. Balancing adaptability and precision, especially with the more aggressive short trade settings, challenged me to fine-tune the strategy for a variety of market conditions.
█ Introduction and How it is Different
The "VIDYA ProTrend Multi-Tier Profit" strategy is a trend-following system that combines the VIDYA (Variable Index Dynamic Average) indicator with Bollinger Bands and a multi-step take-profit mechanism.
Unlike traditional trend strategies, this system allows for more adaptive profit-taking, adjusting for long and short positions through distinct ATR-based and percentage-based targets. The innovation lies in its dynamic multi-tier approach to profit-taking, especially for short trades, where more aggressive percentages are applied using a multiplier. This flexibility helps adapt to various market conditions by optimizing trade management and profit allocation based on market volatility and trend strength.
BTCUSD 6hr performance
█ Strategy, How it Works: Detailed Explanation
The core of the "VIDYA ProTrend Multi-Tier Profit" strategy lies in the dual VIDYA indicators (fast and slow) that analyze price trends while accounting for market volatility. These indicators work alongside Bollinger Bands to filter trade entries and exits.
🔶 VIDYA Calculation
The VIDYA indicator is calculated using the following formula:
Smoothing factor (𝛼):
alpha = 2 / (Length + 1)
VIDYA formula:
VIDYA(t) = alpha * k * Price(t) + (1 - alpha * k) * VIDYA(t-1)
Where:
k = |Chande Momentum Oscillator (MO)| / 100
🔶 Bollinger Bands as a Volatility Filter
Bollinger Bands are calculated using a rolling mean and standard deviation of price over a specified period:
Upper Band:
BB_upper = MA + (K * stddev)
Lower Band:
BB_lower = MA - (K * stddev)
Where:
MA is the moving average,
K is the multiplier (typically 2), and
stddev is the standard deviation of price over the Bollinger Bands length.
These bands serve as volatility filters to identify potential overbought or oversold conditions, aiding in the entry and exit logic.
🔶 Slope Calculation for VIDYA
The slopes of both fast and slow VIDYAs are computed to assess the momentum and direction of the trend. The slope for a given VIDYA over its length is:
Slope = (VIDYA(t) - VIDYA(t-n)) / n
Where:
n is the length of the lookback period. Positive slope indicates bullish momentum, while negative slope signals bearish momentum.
LOCAL picture
🔶 Entry and Exit Conditions
- Long Entry: Occurs when the price moves above the slow VIDYA and the fast VIDYA is trending upward. Bollinger Bands confirm the signal when the price crosses the upper band, indicating bullish strength.
- Short Entry: Happens when the price drops below the slow VIDYA and the fast VIDYA trends downward. The signal is confirmed when the price crosses the lower Bollinger Band, showing bearish momentum.
- Exit: Based on VIDYA slopes flattening or reversing, or when the price hits specific ATR or percentage-based profit targets.
🔶 Multi-Step Take Profit Mechanism
The strategy incorporates three levels of take profit for both long and short trades:
- ATR-based Take Profit: Each step applies a multiple of the ATR (Average True Range) to the entry price to define the exit point.
The first level of take profit (long):
TP_ATR1_long = Entry Price + (2.618 * ATR)
etc.
█ Trade Direction
The strategy offers flexibility in defining the trading direction:
- Long: Only long trades are considered based on the criteria for upward trends.
- Short: Only short trades are initiated in bearish trends.
- Both: The strategy can take both long and short trades depending on the market conditions.
█ Usage
To use the strategy effectively:
- Adjust the VIDYA lengths (fast and slow) based on your preference for trend sensitivity.
- Use Bollinger Bands as a filter for identifying potential breakout or reversal scenarios.
- Enable the multi-step take profit feature to manage positions dynamically, allowing for partial exits as the price reaches specified ATR or percentage levels.
- Leverage the short trade multiplier for more aggressive take profit levels in bearish markets.
This strategy can be applied to different asset classes, including equities, forex, and cryptocurrencies. Adjust the input parameters to suit the volatility and characteristics of the asset being traded.
█ Default Settings
The default settings for this strategy have been designed for moderate to trending markets:
- Fast VIDYA Length (10): A shorter length for quick responsiveness to price changes. Increasing this length will reduce noise but may delay signals.
- Slow VIDYA Length (30): The slow VIDYA is set longer to capture broader market trends. Shortening this value will make the system more reactive to smaller price swings.
- Minimum Slope Threshold (0.05): This threshold helps filter out weak trends. Lowering the threshold will result in more trades, while raising it will restrict trades to stronger trends.
Multi-Step Take Profit Settings
- ATR Multipliers (2.618, 5.0, 10.0): These values define how far the price should move before taking profit. Larger multipliers widen the profit-taking levels, aiming for larger trend moves. In higher volatility markets, these values might be adjusted downwards.
- Percentage Levels (3%, 8%, 17%): These percentage levels define how much the price must move before taking profit. Increasing the percentages will capture larger moves, while smaller percentages offer quicker exits.
- Short TP Multiplier (1.5): This multiplier applies more aggressive take profit levels for short trades. Adjust this value based on the aggressiveness of your short trade management.
Each of these settings directly impacts the performance and risk profile of the strategy. Shorter VIDYA lengths and lower slope thresholds will generate more trades but may result in more whipsaws. Higher ATR multipliers or percentage levels can delay profit-taking, aiming for larger trends but risking partial gains if the trend reverses too early.

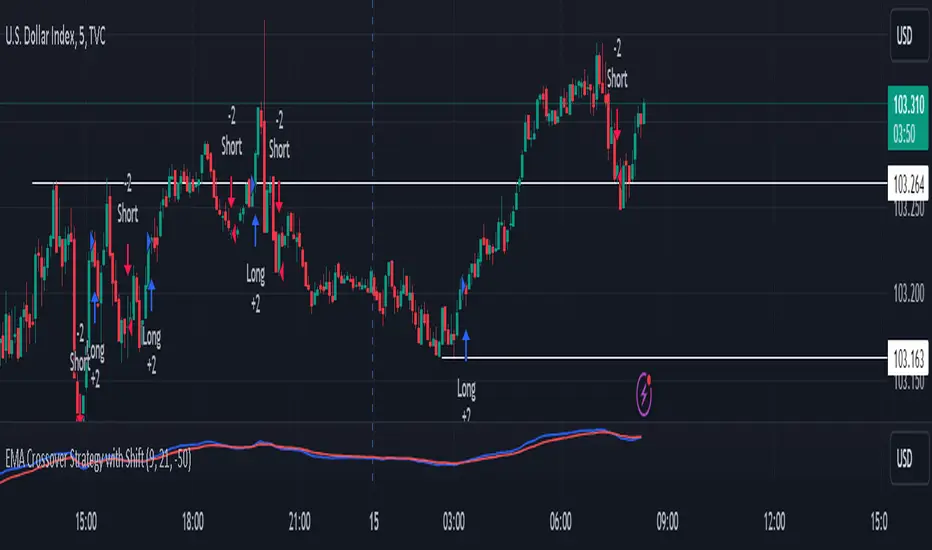
Dont make me crossStrategy Overview
This trading strategy utilizes Exponential Moving Averages (EMAs) to generate buy and sell signals based on the crossover of two EMAs, which are shifted downwards by 50 points. The strategy aims to identify potential market reversals and trends based on these crossovers.
Components of the Strategy
Exponential Moving Averages (EMAs):
Short EMA: This is calculated over a shorter period (default is 9 periods) and is more responsive to recent price changes.
Long EMA: This is calculated over a longer period (default is 21 periods) and provides a smoother view of the price trend.
Both EMAs are adjusted by a fixed shift amount of -50 points.
Input Parameters:
Short EMA Length: The period used to calculate the short-term EMA. This can be adjusted based on the trader's preference or market conditions.
Long EMA Length: The period used for the long-term EMA, also adjustable.
Shift Amount: A fixed value (default -50) that is subtracted from both EMAs to shift their values downwards. This is useful for visual adjustments or specific strategy requirements.
Plotting:
The adjusted EMAs are plotted on the price chart. The short EMA is displayed in blue, and the long EMA is displayed in red. This visual representation helps traders identify the crossover points easily.
Signal Generation:
Buy Signal: A buy signal is generated when the short EMA crosses above the long EMA. This is interpreted as a bullish signal, indicating potential upward price movement.
Sell Signal: A sell signal occurs when the short EMA crosses below the long EMA, indicating potential downward price movement.
Trade Execution:
When a buy signal is triggered, the strategy enters a long position.
Conversely, when a sell signal is triggered, the strategy enters a short position.
Trading Logic
Market Conditions: The strategy is most effective in trending markets. During sideways or choppy market conditions, it may generate false signals.
Risk Management: While this script does not include explicit risk management features (like stop-loss or take-profit), traders should consider implementing these to manage their risk effectively.
Customization
Traders can customize the EMA lengths and the shift amount based on their analysis and preferences.
The strategy can also be enhanced with additional indicators, such as volume or volatility measures, to filter signals further.
Use Cases
This strategy can be applied to various timeframes, such as intraday, daily, or weekly charts, depending on the trader's style.
It is suitable for both novice and experienced traders, offering a straightforward approach to trading based on technical analysis.
Summary
The EMA Crossover Strategy with a -50 shift is a straightforward technical analysis approach that capitalizes on the momentum generated by the crossover of short and long-term EMAs. By shifting the EMAs downwards, the strategy can help traders visualize potential entry and exit points more clearly, although it's important to consider additional risk management and market context for effective trading.
Exponantial Spread StrategyIt is strongly recommended to evaluate the strategy's performance on long time frames such as 1D or 4H.
This strategy calculates a custom moving average by the formula EMA+(TEMA-DEMA)*G,
G being the gain parameter. The main idea behind that is since TEMA is much more adaptive than DEMA their spread give us momentum, and incorporating this with a gain allows us to calculate a very responsive but yet not noisy moving average.
We calculate 4 MAs like described with gains 0,1,2,3 from less adaptive (normal EMA) to most adaptive. When they align in terms of position and the price is above the original MA we enter a long position, and do partial exits at each crossunder weighted by how adaptive ma is, the more adaptive the less weight, we do a full stop when the price crossed below under the original MA or the position aligment changed.

MACD Trend Trading with Dynamic Position Sizing // AlgoFyreThe MACD Trend Trading with Dynamic Position Sizing strategy combines MACD and trend indicators for trend trading. It uses MACD crossovers to identify entry points and a trend source for directional bias. The strategy incorporates risk management through dynamic position sizing based on a fixed risk amount. It allows for both long and short positions with customizable stop-loss and take-profit levels. The script includes visualization options for entry, stop-loss, and take-profit levels, enhancing trade analysis.
TABLE OF CONTENTS
🔶 ORIGINALITY
🔸Dynamic Position Sizing
🔸Trend-MACD Combination
🔸Customizable Risk Management
🔶 FUNCTIONALITY
🔸Indicators
🞘 Trend Indicator
🞘 Moving Average Convergence Divergence (MACD)
🔸Conditions
🞘 Long Entry
🞘 Short Entry
🔶 INSTRUCTIONS
🔸Step-by-Step Guidelines
🞘 Setting Up the Strategy
🞘 Alerts
🔸Customize settings
🔶 CONCLUSION
▅▅▅▅▅▅▅▅▅▅▅▅▅▅▅▅▅▅▅▅▅▅▅▅▅▅▅▅▅▅▅▅▅▅▅▅▅▅▅▅▅▅▅▅▅
🔶 ORIGINALITY The MACD Trend Trading with Dynamic Position Sizing strategy uniquely combines MACD indicators with trend analysis to optimize entry and exit points. Unlike static trading strategies, it employs dynamic position sizing based on a fixed risk amount, ensuring consistent risk management. This approach allows traders to adapt to varying market conditions by adjusting position sizes according to predefined risk parameters, enhancing both flexibility and control in trading decisions. The strategy's integration of customizable stop-loss and take-profit levels further refines its risk management capabilities, making it a robust tool for both trending and volatile markets.
🔸Dynamic Position Sizing This strategy calculates position sizes dynamically, based on a fixed risk amount, allowing traders to maintain consistent risk exposure across trades.
🔸Trend-MACD Combination By combining trend direction with MACD crossovers, the strategy enhances the accuracy of entry signals, aligning trades with prevailing market trends.
🔸Customizable Risk Management Traders can set flexible risk-reward ratios and adjust stop-loss and take-profit levels, tailoring the strategy to their risk tolerance and market conditions.
🔶 FUNCTIONALITY The MACD Trend Trading with Dynamic Position Sizing strategy leverages a combination of trend indicators and the MACD to identify optimal trading opportunities. This strategy is designed to capitalize on short-term price movements by dynamically adjusting position sizes based on predefined risk parameters. It allows traders to manage risk effectively while taking advantage of both long and short positions.
🔸Indicators 🞘 Trend Indicator: Utilizes the trend source to determine market direction, ensuring trades align with prevailing trends.
Recommendation: We recommend using the Adaptive MAs (Hurst, CVaR, Fractal) indicator with the following settings for trend detection. However, you can use any trend indicator that suits your trading style.
🞘 Moving Average Convergence Divergence (MACD): Employs MACD crossovers to generate entry signals, enhancing the accuracy of trade execution. Use the "Moving Average Convergence Divergence" Indicator with the following settings:
🔸Conditions 🞘 Long Entry: Initiates a long position when the price is above the trend source, and a MACD crossover occurs with both MACD and signal lines below zero.
🞘 Short Entry: Initiates a short position when the price is below the trend source, and a MACD crossunder occurs with both MACD and signal lines above zero.
🔶 INSTRUCTIONS
The MACD Trend Trading with Dynamic Position Sizing strategy can be set up by adding it to your TradingView chart and configuring parameters such as the MACD source, trend source, and risk management settings. This strategy is designed to capitalize on short-term price movements by dynamically adjusting position sizes based on predefined risk parameters. Enhance the accuracy of signals by combining this strategy with additional indicators like trend-following or momentum-based tools. Adjust settings to better manage risk and optimize entry and exit points.
🔸Step-by-Step Guidelines
🞘 Setting Up the Strategy
Adding the Strategy to the Chart:
Go to your TradingView chart.
Click on the "Indicators" button at the top.
Search for "MACD Trend Trading with Dynamic Position Sizing" in the indicators list.
Click on the strategy to add it to your chart.
Configuring the Strategy:
Open the strategy settings by clicking on the gear icon next to its name on the chart.
MACD: Select the MACD from the MACD Indicator.
MACD Signal: Select the MACD Signal from the MACD Indicator.
Trend Source: Choose the trend source to determine market direction. If you use the Adaptive MAs (Hurst, CVaR, Fractal) with our settings shown above, choose the MA1 Smoothing Line.
Stop Loss Percentage: Set the stop loss distance from the trend source as a percentage.
Risk/Reward Ratio: Define the desired risk/reward ratio for trades.
Backtesting and Practice:
Backtest the strategy on historical data to understand how it performs in various market environments.
Practice using the strategy on a demo account before implementing it in live trading.
Market Awareness:
Keep an eye on market news and events that might cause extreme price movements. The strategy reacts to price data and might not account for news-driven events that can cause large deviations.
🔶 CONCLUSION
The MACD Trend Trading with Dynamic Position Sizing strategy provides a robust framework for capitalizing on short-term market trends by combining the MACD indicator with dynamic position sizing. This strategy leverages MACD crossovers to identify entry points and utilizes a trend source for directional bias, ensuring trades align with prevailing market conditions. By incorporating dynamic position sizing based on a fixed risk amount, traders can effectively manage risk and adapt to varying market conditions. The strategy's customizable stop-loss and take-profit levels further enhance its risk management capabilities, making it a versatile tool for both trending and volatile markets. With its strategic blend of technical indicators and risk management, the MACD Trend Trading strategy offers traders a comprehensive approach to optimizing trade execution and maximizing potential returns.

Simple RSI stock Strategy [1D] The "Simple RSI Stock Strategy " is designed to long-term traders. Strategy uses a daily time frame to capitalize on signals generated by the Relative Strength Index (RSI) and the Simple Moving Average (SMA). This strategy is suitable for low-leverage trading environments and focuses on identifying potential buy opportunities when the market is oversold, while incorporating strong risk management with both dynamic and static Stop Loss mechanisms.
This strategy is recommended for use with a relatively small amount of capital and is best applied by diversifying across multiple stocks in a strong uptrend, particularly in the S&P 500 stock market. It is specifically designed for equities, and may not perform well in other markets such as commodities, forex, or cryptocurrencies, where different market dynamics and volatility patterns apply.
Indicators Used in the Strategy:
1. RSI (Relative Strength Index):
- The RSI is a momentum oscillator used to identify overbought and oversold conditions in the market.
- This strategy enters long positions when the RSI drops below the oversold level (default: 30), indicating a potential buying opportunity.
- It focuses on oversold conditions but uses a filter (SMA 200) to ensure trades are only made in the context of an overall uptrend.
2. SMA 200 (Simple Moving Average):
- The 200-period SMA serves as a trend filter, ensuring that trades are only executed when the price is above the SMA, signaling a bullish market.
- This filter helps to avoid entering trades in a downtrend, thereby reducing the risk of holding positions in a declining market.
3. ATR (Average True Range):
- The ATR is used to measure market volatility and is instrumental in setting the Stop Loss.
- By multiplying the ATR value by a custom multiplier (default: 1.5), the strategy dynamically adjusts the Stop Loss level based on market volatility, allowing for flexibility in risk management.
How the Strategy Works:
Entry Signals:
The strategy opens long positions when RSI indicates that the market is oversold (below 30), and the price is above the 200-period SMA. This ensures that the strategy buys into potential market bottoms within the context of a long-term uptrend.
Take Profit Levels:
The strategy defines three distinct Take Profit (TP) levels:
TP 1: A 5% from the entry price.
TP 2: A 10% from the entry price.
TP 3: A 15% from the entry price.
As each TP level is reached, the strategy closes portions of the position to secure profits: 33% of the position is closed at TP 1, 66% at TP 2, and 100% at TP 3.
Visualizing Target Points:
The strategy provides visual feedback by plotting plotshapes at each Take Profit level (TP 1, TP 2, TP 3). This allows traders to easily see the target profit levels on the chart, making it easier to monitor and manage positions as they approach key profit-taking areas.
Stop Loss Mechanism:
The strategy uses a dual Stop Loss system to effectively manage risk:
ATR Trailing Stop: This dynamic Stop Loss adjusts based on the ATR value and trails the price as the position moves in the trader’s favor. If a price reversal occurs and the market begins to trend downward, the trailing stop closes the position, locking in gains or minimizing losses.
Basic Stop Loss: Additionally, a fixed Stop Loss is set at 25%, limiting potential losses. This basic Stop Loss serves as a safeguard, automatically closing the position if the price drops 25% from the entry point. This higher Stop Loss is designed specifically for low-leverage trading, allowing more room for market fluctuations without prematurely closing positions.
to determine the level of stop loss and target point I used a piece of code by RafaelZioni, here is the script from which a piece of code was taken
Together, these mechanisms ensure that the strategy dynamically manages risk while offering robust protection against significant losses in case of sharp market downturns.
The position size has been estimated by me at 75% of the total capital. For optimal capital allocation, a recommended value based on the Kelly Criterion, which is calculated to be 59.13% of the total capital per trade, can also be considered.
Enjoy !

Overnight Positioning w EMA - Strategy [presentTrading]I've recently started researching Market Timing strategies, and it’s proving to be quite an interesting area of study. The idea of predicting optimal times to enter and exit the market, based on historical data and various indicators, brings a dynamic edge to trading. Additionally, it is integrated with the 3commas bot for automated trade execution.
I'm still working on it. Welcome to share your point of view.
█ Introduction and How it is Different
The "Overnight Positioning with EMA " is designed to capitalize on market inefficiencies during the overnight trading period. This strategy takes a position shortly before the market closes and exits shortly after it opens the following day. What sets this strategy apart is the integration of an optional Exponential Moving Average (EMA) filter, which ensures that trades are aligned with the underlying trend. The strategy provides flexibility by allowing users to select between different global market sessions, such as the US, Asia, and Europe.
It is integrated with the 3commas bot for automated trade execution and has a built-in mechanism to avoid holding positions over the weekend by force-closing positions on Fridays before the market closes.
BTCUSD 20 mins Performance
█ Strategy, How it Works: Detailed Explanation
The core logic of this strategy is simple: enter trades before market close and exit them after market open, taking advantage of potential price movements during the overnight period. Here’s how it works in more detail:
🔶 Market Timing
The strategy determines the local market open and close times based on the selected market (US, Asia, Europe) and adjusts entry and exit points accordingly. The entry is triggered a specific number of minutes before market close, and the exit is triggered a specific number of minutes after market open.
🔶 EMA Filter
The strategy includes an optional EMA filter to help ensure that trades are taken in the direction of the prevailing trend. The EMA is calculated over a user-defined timeframe and length. The entry is only allowed if the closing price is above the EMA (for long positions), which helps to filter out trades that might go against the trend.
The EMA formula:
```
EMA(t) = +
```
Where:
- EMA(t) is the current EMA value
- Close(t) is the current closing price
- n is the length of the EMA
- EMA(t-1) is the previous period's EMA value
🔶 Entry Logic
The strategy monitors the market time in the selected timezone. Once the current time reaches the defined entry period (e.g., 20 minutes before market close), and the EMA condition is satisfied, a long position is entered.
- Entry time calculation:
```
entryTime = marketCloseTime - entryMinutesBeforeClose * 60 * 1000
```
🔶 Exit Logic
Exits are triggered based on a specified time after the market opens. The strategy checks if the current time is within the defined exit period (e.g., 20 minutes after market open) and closes any open long positions.
- Exit time calculation:
exitTime = marketOpenTime + exitMinutesAfterOpen * 60 * 1000
🔶 Force Close on Fridays
To avoid the risk of holding positions over the weekend, the strategy force-closes any open positions 5 minutes before the market close on Fridays.
- Force close logic:
isFriday = (dayofweek(currentTime, marketTimezone) == dayofweek.friday)
█ Trade Direction
This strategy is designed exclusively for long trades. It enters a long position before market close and exits the position after market open. There is no shorting involved in this strategy, and it focuses on capturing upward momentum during the overnight session.
█ Usage
This strategy is suitable for traders who want to take advantage of price movements that occur during the overnight period without holding positions for extended periods. It automates entry and exit times, ensuring that trades are placed at the appropriate times based on the market session selected by the user. The 3commas bot integration also allows for automated execution, making it ideal for traders who wish to set it and forget it. The strategy is flexible enough to work across various global markets, depending on the trader's preference.
█ Default Settings
1. entryMinutesBeforeClose (Default = 20 minutes):
This setting determines how many minutes before the market close the strategy will enter a long position. A shorter duration could mean missing out on potential movements, while a longer duration could expose the position to greater price fluctuations before the market closes.
2. exitMinutesAfterOpen (Default = 20 minutes):
This setting controls how many minutes after the market opens the position will be exited. A shorter exit time minimizes exposure to market volatility at the open, while a longer exit time could capture more of the overnight price movement.
3. emaLength (Default = 100):
The length of the EMA affects how the strategy filters trades. A shorter EMA (e.g., 50) reacts more quickly to price changes, allowing more frequent entries, while a longer EMA (e.g., 200) smooths out price action and only allows entries when there is a stronger underlying trend.
The effect of using a longer EMA (e.g., 200) would be:
```
EMA(t) = +
```
4. emaTimeframe (Default = 240):
This is the timeframe used for calculating the EMA. A higher timeframe (e.g., 360) would base entries on longer-term trends, while a shorter timeframe (e.g., 60) would respond more quickly to price movements, potentially allowing more frequent trades.
5. useEMA (Default = true):
This toggle enables or disables the EMA filter. When enabled, trades are only taken when the price is above the EMA. Disabling the EMA allows the strategy to enter trades without any trend validation, which could increase the number of trades but also increase risk.
6. Market Selection (Default = US):
This setting determines which global market's open and close times the strategy will use. The selection of the market affects the timing of entries and exits and should be chosen based on the user's preference or geographic focus.

Adaptive MA Scalping StrategyAdaptive MA Scalping Strategy
The Adaptive MA Scalping Strategy is an innovative trading approach that merges the strengths of the Kaufman's Adaptive Moving Average (KAMA) with the Moving Average Convergence Divergence (MACD) histogram. This combination results in a momentum-adaptive moving average that dynamically adjusts to market conditions, providing traders with timely and reliable signals.
How It Works
Kaufman's Adaptive Moving Average (KAMA): Unlike traditional moving averages, KAMA adjusts its sensitivity based on market volatility. It becomes more responsive during trending markets and less sensitive during periods of consolidation, effectively filtering out market noise.
MACD Histogram Integration: The strategy incorporates the MACD histogram, a momentum indicator that measures the difference between a fast and a slow exponential moving average (EMA). By adding the MACD histogram values to the KAMA, the strategy creates a new line—the momentum-adaptive moving average (MOMA)—which captures both trend direction and momentum.
Signal Generation:
Long Entry: The strategy enters a long position when the closing price crosses above the MOMA. This indicates a potential upward momentum shift.
Exit Position: The position is closed when the closing price crosses below the MOMA, signaling a potential decline in momentum.
Cloud Calculation Detail
The MOMA is calculated by adding the MACD histogram value to the KAMA of the price. This addition effectively adjusts the KAMA based on the momentum indicated by the MACD histogram. When momentum is strong, the MACD histogram will have higher values, causing the MOMA to adjust accordingly and provide earlier entry or exit signals.
Performance on Stocks
This strategy has demonstrated excellent performance on stocks when applied to the 1-hour timeframe. Its adaptive nature allows it to respond swiftly to market changes, capturing profitable trends while minimizing the impact of false signals caused by market noise. The combination of KAMA's adaptability and MACD's momentum detection makes it particularly effective in volatile market conditions commonly seen in stock trading.
Key Parameters
KAMA Length (malen): Determines the sensitivity of the KAMA. A length of 100 is used to balance responsiveness with noise reduction.
MACD Fast Length (fast): Sets the period for the fast EMA in the MACD calculation. A value of 24 helps in capturing short-term momentum changes.
MACD Slow Length (slow): Sets the period for the slow EMA in the MACD calculation. A value of 52 smooths out longer-term trends.
MACD Signal Length (signal): Determines the period for the signal line in the MACD calculation. An 18-period signal line is used for timely crossovers.
Advantages of the Strategy
Adaptive to Market Conditions: By adjusting to both volatility and momentum, the strategy remains effective across different market phases.
Enhanced Signal Accuracy: The fusion of KAMA and MACD reduces false signals, improving the accuracy of trade entries and exits.
Simplicity in Execution: With straightforward entry and exit rules based on price crossovers, the strategy is user-friendly for traders at all experience levels

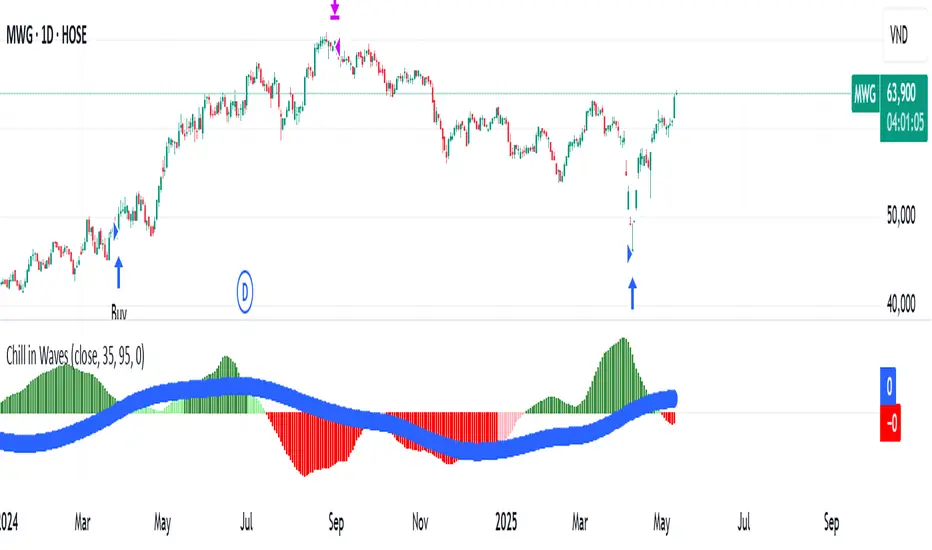
Chill in WavesChill in Waves is a distinctive technical indicator that integrates both volume and price action, specifically designed to help traders identify key market trends and optimize entry/exit points. What sets this indicator apart is its ability to normalize data using Z-score techniques, making it highly adaptable and reliable across any timeframe, from short-term intraday trading to long-term position strategies.
Key Features and What Makes it Unique:
1. Volume-Weighted Moving Averages (VWMA): At the core of Chill in Waves are two volume-weighted moving averages (VWMA), which highlight periods of strong price movement influenced by high trading volume. The use of VWMA ensures that market activity during times of increased volume has a greater influence on the signals generated. This provides a more accurate reflection of market sentiment compared to traditional moving averages.
2. Z-Score Normalization: One of the key innovations of Chill in Waves is its Z-score normalization of the difference between the fast and slow VWMAs. This normalization helps to smooth out the noise typically present in raw market data, allowing traders to better identify statistically significant deviations from historical price norms. By using normalized data, traders can confidently apply this indicator across all timeframes without the risk of distortion caused by extreme values or outliers. This is especially beneficial for traders who operate in volatile markets.
3. Versatility Across Timeframes: Unlike many indicators that are calibrated for specific timeframes, Chill in Waves is designed for use on all timeframes, from minute-by-minute charts to daily, weekly, and even monthly charts. The Z-score normalization ensures that signals are consistently reliable, no matter the timeframe you are trading in, providing traders with a flexible tool to adapt to any market conditions.
4. Clear Visual Cues for Buy/Sell Signals: Chill in Waves offers straightforward visual cues by plotting Z-scores with color-coded signals: green for potential bullish trends and red for bearish movements. This makes it easy for traders to quickly assess market conditions at a glance, without the need to interpret complex calculations.
5. Customizable Trailing Stop Feature: To further support effective risk management, Chill in Waves includes a customizable trailing stop feature, allowing traders to lock in profits while minimizing downside risk. The flexibility in adjusting the trailing stop percentage ensures that the indicator can be tailored to fit each trader’s risk tolerance and strategy.
Buy and Sell Logic:
Buy Logic: A long position is triggered when both the fast and slow VWMA Z-scores are trending upward, signaling a statistically significant shift toward bullish price action.
Sell Logic: Positions are closed when the trailing stop condition is met or after a predetermined period, ensuring traders can capture gains while limiting exposure to downside risk.
Customization Options:
VWMA Length: Traders can adjust the lengths of the fast and slow VWMA to better suit specific market conditions or individual asset classes.
Bar Color Customization: For additional visual clarity, you can enable an optional feature that changes the color of price bars based on the Z-score difference, providing further insight into market momentum.
Chill in Waves stands out as a flexible and robust indicator for traders across all timeframes, combining the power of volume-weighted moving averages with normalized data to produce accurate and adaptable buy/sell signals. Whether you're a short-term scalper or a long-term trend follower, this indicator offers you the calm confidence needed to ride the waves of market volatility.
Crypto Volatility Bitcoin Correlation Strategy Description:
The Crypto Volatility Bitcoin Correlation Strategy is designed to leverage market volatility specifically in Bitcoin (BTC) using a combination of volatility indicators and trend-following techniques. This strategy utilizes the VIXFix (a volatility indicator adapted for crypto markets) and the BVOL7D (Bitcoin 7-Day Volatility Index from BitMEX) to identify periods of high volatility, while confirming trends with the Exponential Moving Average (EMA). These components work together to offer a comprehensive system that traders can use to enter positions when volatility and trends are aligned in their favor.
Key Features:
VIXFix (Volatility Index for Crypto Markets): This indicator measures the highest price of Bitcoin over a set period and compares it with the current low price to gauge market volatility. A rise in VIXFix indicates increasing market volatility, signaling that large price movements could occur.
BVOL7D (Bitcoin 7-Day Volatility Index): This volatility index, provided by BitMEX, measures the volatility of Bitcoin over the past 7 days. It helps traders monitor the recent volatility trend in the market, particularly useful when making short-term trading decisions.
Exponential Moving Average (EMA): The 50-period EMA acts as a trend indicator. When the price is above the EMA, it suggests the market is in an uptrend, and when the price is below the EMA, it suggests a downtrend.
How It Works:
Long Entry: A long position is triggered when both the VIXFix and BVOL7D indicators are rising, signaling increased volatility, and the price is above the 50-period EMA, confirming that the market is trending upward.
Exit: The strategy exits the position when the price crosses below the 50-period EMA, which signals a potential weakening of the uptrend and a decrease in volatility.
This strategy ensures that traders only enter positions when the volatility aligns with a clear trend, minimizing the risk of entering trades during periods of market uncertainty.
Testing and Timeframe:
This strategy has been tested on Bitcoin using the daily timeframe, which provides a longer-term perspective on market trends and volatility. However, users can adjust the timeframe according to their trading preferences. It is crucial to note that this strategy does not include comprehensive risk management, aside from the exit condition when the price crosses below the EMA. Users are strongly advised to implement their own risk management techniques, such as setting appropriate stop-loss levels, to safeguard their positions during high volatility periods.
Utility:
The Crypto Volatility Bitcoin Correlation Strategy is particularly well-suited for traders who aim to capitalize on the high volatility often seen in the Bitcoin market. By combining volatility measurements (VIXFix and BVOL7D) with a trend-following mechanism (EMA), this strategy helps identify optimal moments for entering and exiting trades. This approach ensures that traders participate in potentially profitable market moves while minimizing exposure during times of uncertainty.
Use Cases:
Volatility-Based Entries: Traders looking to take advantage of market volatility spikes will find this strategy useful for timing entry points during market swings.
Trend Confirmation: By using the EMA as a confirmation tool, traders can avoid entering trades that go against the trend, which can result in significant losses during volatile market conditions.
Risk Management: While the strategy exits when price falls below the EMA, it is important to recognize that this is not a full risk management system. Traders should use caution and integrate additional risk measures, such as stop-losses and position sizing, to better manage potential losses.
How to Use:
Step 1: Monitor the VIXFix and BVOL7D indicators. When both are rising and the Bitcoin price is above the EMA, the strategy will trigger a long entry, indicating that the market is experiencing increased volatility with a confirmed uptrend.
Step 2: Exit the position when the price drops below the 50-period EMA, signaling that the trend may be reversing or weakening, reducing the likelihood of continued upward price movement.
This strategy is open-source and is intended to help traders navigate volatile market conditions, particularly in Bitcoin, using proven indicators for volatility and trend confirmation.
Risk Disclaimer:
This strategy has been tested on the daily timeframe of Bitcoin, but users should be aware that it does not include built-in risk management except for the below-EMA exit condition. Users should be extremely cautious when using this strategy and are encouraged to implement their own risk management, such as using stop-losses, position sizing, and setting appropriate limits. Trading involves significant risk, and this strategy does not guarantee profits or prevent losses. Past performance is not indicative of future results. Always test any strategy in a demo environment before applying it to live markets.

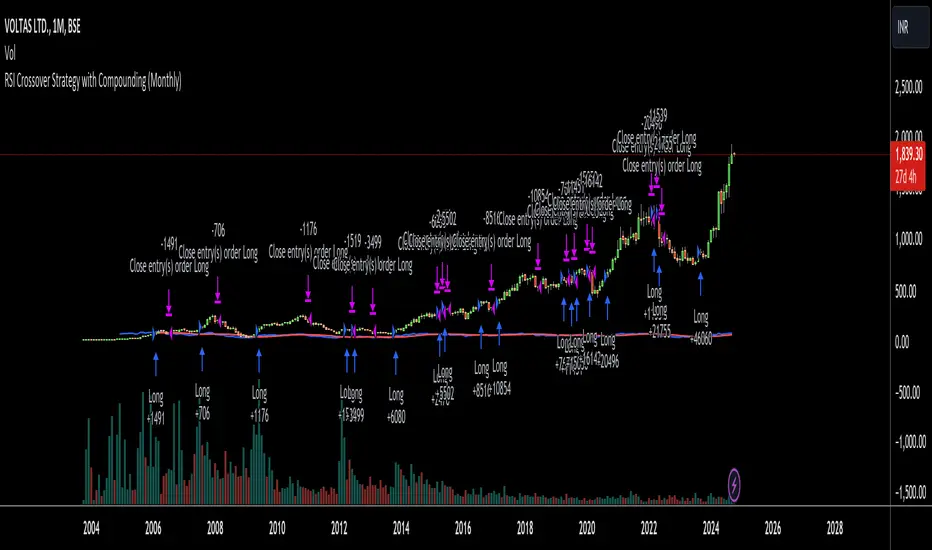
RSI Crossover Strategy with Compounding (Monthly)Explanation of the Code:
Initial Setup:
The strategy initializes with a capital of 100,000.
Variables track the capital and the amount invested in the current trade.
RSI Calculation:
The RSI and its SMA are calculated on the monthly timeframe using request.security().
Entry and Exit Conditions:
Entry: A long position is initiated when the RSI is above its SMA and there’s no existing position. The quantity is based on available capital.
Exit: The position is closed when the RSI falls below its SMA. The capital is updated based on the net profit from the trade.
Capital Management:
After closing a trade, the capital is updated with the net profit plus the initial investment.
Plotting:
The RSI and its SMA are plotted for visualization on the chart.
A label displays the current capital.
Notes:
Test the strategy on different instruments and historical data to see how it performs.
Adjust parameters as needed for your specific trading preferences.
This script is a basic framework, and you might want to enhance it with risk management, stop-loss, or take-profit features as per your trading strategy.
Feel free to modify it further based on your needs!
Trend Confirmation and ASO-based StrategyStrategy Name: Trend Confirmation with EMA, ASO, and ATR Bands Auto-Trading
Purpose:
This strategy aims to enhance trend confirmation and entry point precision by combining multiple technical indicators. Specifically, it uses the 200 EMA for trend confirmation, the Average Sentiment Oscillator (ASO) to capture market sentiment, and ATR bands for risk management. This provides a comprehensive approach to capturing trade opportunities. The strategy emphasizes trend-following trades, reducing noise while keeping risk management simple.
Uniqueness and Usefulness:
Uniqueness:
This strategy stands out because it integrates multiple elements that complement each other for increased effectiveness and originality. Instead of relying on a single indicator, it generates more accurate trading signals by allowing each indicator to work synergistically.
200 EMA: Used to confirm the long-term trend, providing clarity on the trend direction and ensuring trades align with the dominant market trend.
Average Sentiment Oscillator (ASO): Measures market sentiment based on the crossover between the bull and bear lines. Signals are generated only when ASO detects a trend shift, filtering out price fluctuations and noise.
ATR Bands: Evaluates market volatility and sets stop-loss levels upon entry. By using ATR bands, the strategy supports traders in maintaining a fixed stop-loss for risk management.
Each component analyzes the market from a different perspective, and together, they generate reliable signals for trend-following trades. These indicators are not simply combined but are clearly defined in their roles to improve signal quality.
Usefulness:
This strategy is suitable for medium to long-term traders who focus on trend-following. It emphasizes entry during the early stages of a trend and focuses on risk management by offering reliable signals with minimal noise. The combination of ASO and ATR bands allows traders to assess market volatility while setting take profit levels based on a risk-reward ratio. This helps avoid overreacting to short-term price fluctuations and supports sustainable trading practices.
Entry Conditions:
Long Entry:
Condition: Price is above the 200 EMA, and the ASO bull line crosses above the bear line while also exceeding the 50 level.
Signal: A buy signal is generated, indicating the start of an uptrend.
Short Entry:
Condition: Price is below the 200 EMA, and the ASO bear line crosses above the bull line while also exceeding the 50 level.
Signal: A sell signal is generated, indicating the start of a downtrend.
Exit Conditions:
Exit Strategy:
While this strategy automates both entries and exits, it is recommended that traders manually manage their positions for risk control when necessary. The stop-loss is set based on ATR bands at the time of entry, and a take-profit is set with a risk-reward ratio of 1:1.5.
Risk Management:
This strategy incorporates a fixed stop-loss mechanism, where the stop-loss is set at entry based on the ATR band value. Once set, the stop-loss remains fixed, ensuring that trades stay within a predetermined risk range. The take-profit is based on a risk-reward ratio of 1:1.5, increasing the potential reward relative to the risk.
Account Size: ¥100,000
Commissions and Slippage: Assumed commission of 94 pips per trade and slippage of 1 pip.
Risk per Trade: 10% of account equity (adjustable based on risk tolerance).
Configurable Options:
ASO Period: Period setting for the Average Sentiment Oscillator (default is 32).
ATR Multiplier: Multiplier for ATR band calculation (default is 2.0).
EMA Period: Settings for the 200 EMA.
Signal Display Control: Option to toggle entry signal visibility on or off.
Adequate Sample Size:
To verify the effectiveness of this strategy, it is recommended to conduct extensive backtesting over a long period, covering different market conditions, including both high and low volatility environments.
Credits:
Acknowledgments:
This strategy integrates technical approaches based on the Average Sentiment Oscillator, 200 EMA, and ATR bands, drawing insights from the broader trading community.
Clean Chart Description:
Chart Appearance:
This strategy maintains a clean chart display by offering a toggle to switch the visibility of the ASO, EMA, and entry signals on or off. This helps reduce visual clutter and enhances effective trend analysis.
Addressing the House Rule Violations:
Omissions and Unrealistic Claims:
This strategy makes no exaggerated claims or guarantees about performance. All signals are provided for educational purposes, and it is emphasized that past performance does not guarantee future results. Proper risk management is essential, and the importance of this is highlighted throughout the strategy.
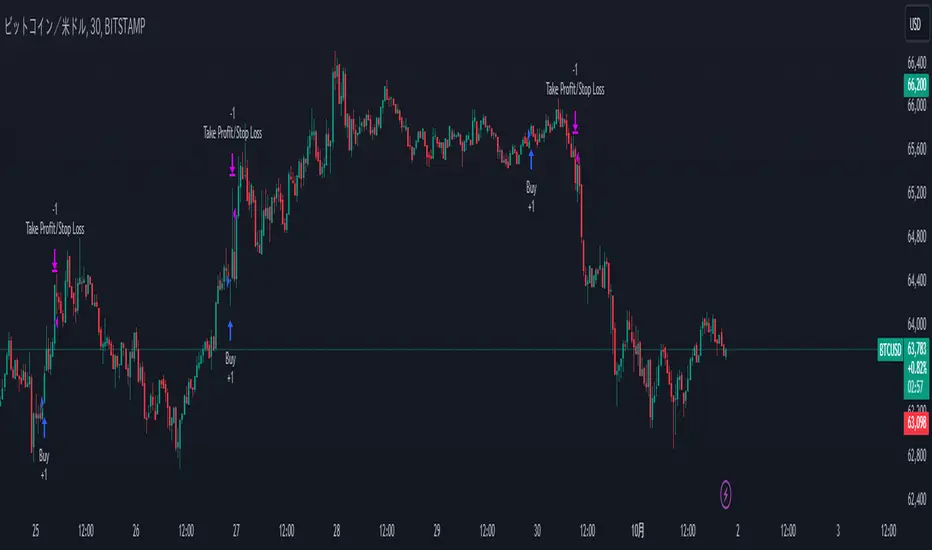
KAMA Cloud STIndicator:
Description:
The KAMA Cloud indicator is a sophisticated trading tool designed to provide traders with insights into market trends and their intensity. This indicator is built on the Kaufman Adaptive Moving Average (KAMA), which dynamically adjusts its sensitivity to filter out market noise and respond to significant price movements. The KAMA Cloud leverages multiple KAMAs to gauge trend direction and strength, offering a visual representation that is easy to interpret.
How It Works:
The KAMA Cloud uses twenty different KAMA calculations, each set to a distinct lookback period ranging from 5 to 100. These KAMAs are calculated using the average of the open, high, low, and close prices (OHLC4), ensuring a balanced view of price action. The relative positioning of these KAMAs helps determine the direction of the market trend and its momentum.
By measuring the cumulative relative distance between these KAMAs, the indicator effectively assesses the overall trend strength, akin to how the Average True Range (ATR) measures market volatility. This cumulative measure helps in identifying the trend’s robustness and potential sustainability.
The visualization component of the KAMA Cloud is particularly insightful. It plots a 'cloud' formed between the base KAMA (set at a 100-period lookback) and an adjusted KAMA that incorporates the cumulative relative distance scaled up. This cloud changes color based on the trend direction — green for upward trends and red for downward trends, providing a clear, visual representation of market conditions.
How the Strategy Works:
The KAMA Cloud ST strategy employs multiple KAMA calculations with varying lengths to capture the nuances of market trends. It measures the relative distances between these KAMAs to determine the trend's direction and strength, much like the original indicator. The strategy enhances decision-making by plotting a 'cloud' formed between the base KAMA (set to a 100-period lookback) and an adjusted KAMA that scales according to the cumulative relative distance of all KAMAs.
Key Components of the Strategy:
Multiple KAMA Layers: The strategy calculates KAMAs for periods ranging from 5 to 100 to analyze short to long-term market trends.
Dynamic Cloud: The cloud visually represents the trend’s strength and direction, updating in real-time as the market evolves.
Signal Generation: Trade signals are generated based on the orientation of the cloud relative to a smoothed version of the upper KAMA boundary. Long positions are initiated when the market trend is upward, and the current cloud value is above its smoothed average. Conversely, positions are closed when the trend reverses, indicated by the cloud falling below the smoothed average.
Suggested Usage:
Market: Stocks, not cryptocurrency
Timeframe: 1 Hour
Indicator:

Advanced Position Management [Mr_Rakun]Advanced Position Management
This Pine Script code is for a strategy titled "Advanced Position Management," aimed at effective trade execution and management using multiple take profit levels, trailing stop loss, and dynamic position sizing.
Take Profit Levels: It defines up to three take profit (TP) levels, allowing partial position exits at different price thresholds. The take profit levels and their respective quantities are adjustable using inputs.
Stop Loss and Trailing Stop: The script implements an initial stop loss based on a percentage from the entry price. Additionally, it features a trailing stop that moves based on either a percentage or previous TP levels, dynamically adjusting to maximize gains while protecting profits.
Position Size: The position size is customizable and based on USD value, allowing the trader to manage risk more effectively.
Advantages:
Flexibility: Multiple take profit levels and a dynamic stop loss system allow traders to lock in profits while keeping the position open for further gains.
Risk Management: The initial stop loss and trailing stop help to limit losses and protect profits as the trade moves in the desired direction.
Automation: Once the strategy is deployed, it automatically handles entry, exit, and stop management, reducing the need for constant monitoring.
------ TR ------
Gelişmiş Pozisyon Yönetimi
Bu Pine Script kodu, Gelişmiş Pozisyon Yönetimi için kendi stratejilerinize kolayca entegre edeceğiniz bir risk yönetimidir. Çoklu kâr al seviyeleri, takip eden stop-loss ve dinamik pozisyon büyüklüğü kullanarak işlem yürütme ve yönetiminde etkilidir.
Gelişmiş Pozisyon Yönetimi
Kâr Alma Seviyeleri;
Kod, pozisyonların farklı fiyat seviyelerinde kısmi kapatılmasını sağlayan üç farklı kâr alma (TP) seviyesini tanımlar. Bu kâr alma seviyeleri ve ilgili miktarları, girişlerle ayarlanabilir.
Stop Loss ve Takip Eden Stop;
Koda, giriş fiyatından bir yüzdeye dayalı olarak başlangıçta stop-loss uygulanır. Ayrıca, fiyat hareketine göre kendini ayarlayan takip eden bir stop-loss sistemi bulunur. Ayrıca TP seviyelerini takip eden stop loss özelliğide vardır.
Avantajları:
Esneklik;
Çoklu kâr alma seviyeleri ve dinamik stop-loss sistemi, trader'ların kazançlarını kilitleyip aynı zamanda pozisyonu açık tutmalarına olanak tanır.
Risk Yönetimi;
Başlangıç stop-loss ve takip eden stop, zararı sınırlamaya ve kazançları korumaya yardımcı olur.
Otomasyon;
Strateji bir kez devreye alındığında, giriş, çıkış ve stop yönetimi otomatik olarak gerçekleştirilir, bu da sürekli takip ihtiyacını azaltır.

Universal All Assets Strategy | viResearchUniversal All Assets Strategy | viResearch
The Universal All Assets Strategy by viResearch is a sophisticated trend-following algorithm designed to operate seamlessly across various asset classes. It leverages seven unique trend-following indicators to provide robust and adaptive trading signals. The strategy dynamically adjusts to market conditions, making it suitable for equities, commodities, forex, and cryptocurrencies.
Core Methodologies and Features:
Seven Integrated Trend Indicators:
The strategy integrates seven powerful trend-following indicators. These include directional moving averages, smoothed moving averages, RSI loops, Supertrend filters, and more. When the majority of these indicators align, the strategy generates a long or short signal, ensuring that traders are capturing significant trend opportunities while minimizing noise from market fluctuations.
Universal Asset Adaptability:
Designed to work across all assets, the strategy adjusts its parameters dynamically based on the asset being traded. Whether applied to stocks, forex, or crypto, it adapts to the specific volatility and price behavior of the instrument, ensuring reliable signal generation in any market condition.
Customizable Directional Bias and Volatility Filters:
The strategy allows for an optional directional bias and incorporates volatility-based adjustments through ATR filters and standard deviation metrics. These features provide greater flexibility, allowing users to fine-tune the strategy for both trending and ranging markets.
Operational Parameters:
User-Friendly Customization:
Universal All Assets Strategy offers comprehensive customization options, including adjustable backtesting dates, starting capital settings, plotting options, and an experimental directional bias feature. These parameters can be easily tailored to meet the trader's unique needs, allowing for optimal performance across various markets and trading styles.
Seven-Trend Confirmation System:
The algorithm relies on its seven trend-following indicators to confirm market direction. If the majority of indicators generate a long signal, the strategy will initiate a long position. Conversely, a majority short signal will trigger a short position, providing strong validation for trade entries and exits.
Thoroughly Tested for Realistic Conditions:
This strategy has been rigorously backtested and forward-tested under real-world trading conditions, accounting for slippage, commissions, and various account sizes. Its robust risk management features ensure a balanced approach to trading, reducing unnecessary drawdowns and prioritizing capital preservation over time.
Concluding Remarks:
The Universal All Assets Strategy | viResearch is designed to offer traders a powerful tool for identifying and acting on market trends across multiple asset classes. With its seven-indicator confirmation system, adaptive logic, and customizable settings, this strategy is an excellent choice for traders looking for consistency and reliability in their trading approach. Whether used for long or short opportunities, this strategy provides the flexibility and precision needed to succeed in today's markets.
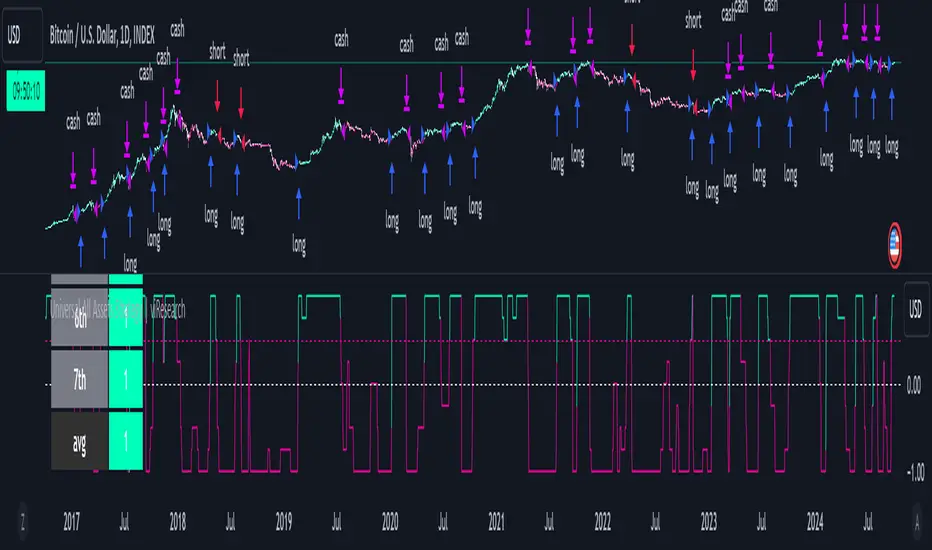
Neural Momentum StrategyThis strategy combines Exponential Moving Average (EMA) analysis with a multi-timeframe approach. It uses a neural scoring system to evaluate market momentum and generate precise trading signals. The strategy is implemented in Pine Script v5 and is designed for use on TradingView.
Key Components
The strategy utilizes short-term (10-period) and long-term (25-period) EMAs. It calculates the difference between these EMAs to assess trend direction and strength. A neural scoring system evaluates EMA crossovers (weight: 12 points), trend strength (weight: 10 points), and price acceleration (weight: 4 points). The system implements a score smoothing algorithm using a 10-period EMA.
Multi-timeframe Analysis
The strategy automatically selects a higher timeframe based on the current chart timeframe. It calculates scores for both the current and higher timeframes, then combines these scores using a weighted average. The higher timeframe factor ranges from 3 to 6, depending on the current timeframe.
Trading Logic
Entry occurs when the final combined score turns positive after a change. Exit happens when the final combined score turns negative after a change. The strategy recalculates scores on each bar, ensuring responsive trading decisions.
Risk Management
An optional adaptive stop-loss system based on Average True Range (ATR) is available. The default ATR period is 10, and the stop factor is 1.2. Stop levels are dynamically adjusted on the higher timeframe.
Customization Options
Users can adjust EMA periods, signal line period, scoring weights, and enable/disable multi-timeframe analysis. The strategy allows setting specific date ranges for backtesting and deployment.
Position Sizing
The strategy uses a percentage-of-equity position sizing method, with a default of 30% of account equity per trade.
Code Structure
The strategy is built using TradingView's strategy framework. It employs efficient use of the request.security() function for multi-timeframe analysis. The main calculation function, calculate_score(), computes the neural score based on EMA differences and acceleration.
Performance Considerations
The strategy adapts to various market conditions through its multi-faceted scoring system. Multi-timeframe analysis helps filter out noise and identify stronger trends. The neural scoring approach aims to capture subtle market dynamics often missed by traditional indicators.
Limitations
Performance may vary across different markets and timeframes. The strategy's effectiveness relies on proper calibration of its numerous parameters. Users should thoroughly backtest and forward test before live implementation.
To summarize, the Neural Momentum Strategy represents a sophisticated approach to market analysis. It combines traditional technical indicators with advanced scoring techniques and multi-timeframe analysis. This strategy is designed for traders seeking a data-driven and adaptive method. It aims to identify high-probability trading opportunities across various market conditions.
This Neural Momentum Strategy is for informational and educational purposes only. It should not be considered financial advice. The strategy may exhibit slight repainting behavior due to the nature of multi-timeframe analysis and the use of the request.security() function. Historical values might change as new data becomes available.
Trading carries a high level of risk, and may not be suitable for all investors. Before deciding to trade, you should carefully consider your investment objectives, level of experience, and risk appetite. The possibility exists that you could sustain a loss of some or all of your initial investment. Therefore, you should not invest money that you cannot afford to lose.
Past performance is not indicative of future results. The author and TradingView are not responsible for any losses incurred as a result of using this strategy. Always exercise caution when using this or any trading strategy, and thoroughly test it before implementing in live trading scenarios.
Users are solely responsible for any trading decisions they make based on this strategy. It is strongly recommended that you seek advice from an independent financial advisor if you have any doubts.

Quantoshi Global Liquidity StrategyThis strategy leverages global liquidity data alongside technical indicators like the Rate of Change (ROC) and Double Exponential Moving Average (DEMA) to identify optimal long-entry points during major market trends. The script is designed to capture long-term, sustained momentum and includes built-in risk management by filtering out rapid price spikes. It is best suited for swing trading or long-term trend trading.
Key Features:
Global Liquidity Data:
The strategy incorporates data from major global central banks and M2 money supply to calculate a comprehensive liquidity index, which is a critical component for long-term trend detection.
ROC-DEMA Crossover:
It combines the Rate of Change (ROC) and a 100-period Double Exponential Moving Average (DEMA) to identify momentum shifts. Long entries are triggered when these indicators confirm an upward trend.
Price Thresholds:
The strategy compares the current price to the price from several candles ago to ensure positions are not entered during unsustainable price surges.
Custom Alerts:
Automated alerts for long entries and exits allow users to automate their trades or receive timely notifications when market conditions are met.
How It Works:
The strategy enters long positions when ROC and DEMA signals confirm a positive trend, and the price conditions suggest a sustainable upward momentum. Long exits occur when the momentum reverses, with a clear crossover signal of ROC below DEMA. Custom alert messages make it ideal for automated trading setups.
Why It's Unique:
This strategy combines liquidity data with technical indicators to filter noise and focus on significant market shifts. It allows traders to capture major trend reversals without needing to actively monitor the charts, making it useful for those focused on swing or long-term trading.
Backtesting & Risk Management:
Given its long-term focus, this strategy generates only a few signals per decade when used on a weekly timescale. As a result, traditional backtesting show few trades, but historical analysis reveals its effectiveness in capturing major market movements.
Account Size:
The backtest is based on a $1,000 account size to represent a realistic trading scenario.
Commissions & Tick size: Commission fees of 0.1% and a tick size of 100 are applied to reflect real-world trading conditions.
Trade Size:
Risk per trade is limited to 5% of the account balance to align with sound risk management practices.

Flexible Moving Average StrategyThis strategy offers flexibility to choose between SMA and EMA, and allows users to set the review frequency to Daily, Weekly, or Monthly. It adapts to different market conditions by providing full control over the length and timeframe of the Moving Average.
### Key Features:
- **Moving Average Method**: Select between SMA and EMA.
- **Review Frequency**: Choose Daily, Weekly, or Monthly review periods.
- **Customizable**: Set the Moving Average length and timeframe.
- **Entry/Exit Rules**:
- **Enter Long**: When the close price is above the Moving Average at the end of the period.
- **Exit**: When the close price falls below the Moving Average.
### Parameters:
- **Review Frequency**: Daily, Weekly, Monthly
- **Moving Average Method**: SMA or EMA
- **Length & Timeframe**: Fully adjustable
This strategy suits traders who prefer a flexible, trend-following approach based on long-term price movements.
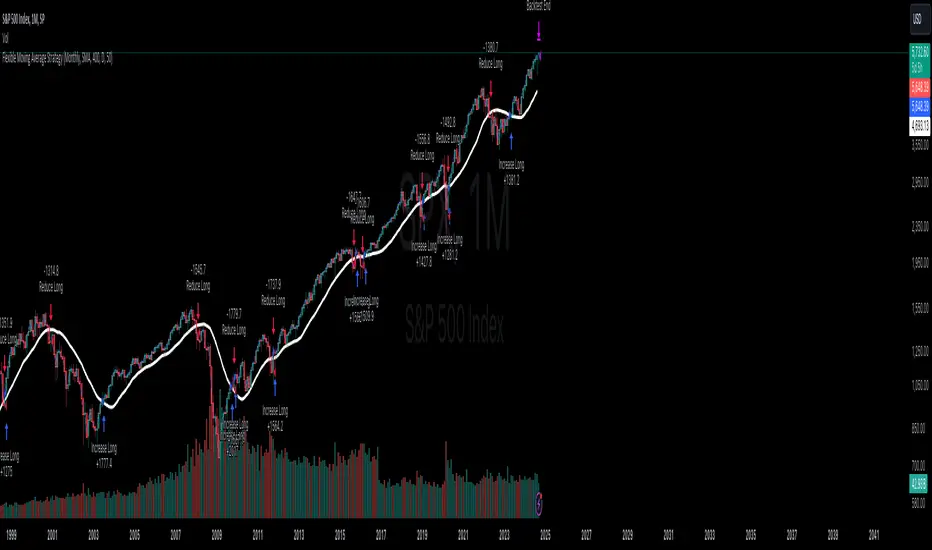
Multi-Step FlexiMA - Strategy [presentTrading]It's time to come back! hope I can not to be busy for a while.
█ Introduction and How It Is Different
The FlexiMA Variance Tracker is a unique trading strategy that calculates a series of deviations between the price (or another indicator source) and a variable-length moving average (MA). Unlike traditional strategies that use fixed-length moving averages, the length of the MA in this system varies within a defined range. The length changes dynamically based on a starting factor and an increment factor, creating a more adaptive approach to market conditions.
This strategy integrates Multi-Step Take Profit (TP) levels, allowing for partial exits at predefined price increments. It enables traders to secure profits at different stages of a trend, making it ideal for volatile markets where taking full profits at once might lead to missed opportunities if the trend continues.
BTCUSD 6hr Performance
█ Strategy, How It Works: Detailed Explanation
🔶 FlexiMA Concept
The FlexiMA (Flexible Moving Average) is at the heart of this strategy. Unlike traditional MA-based strategies where the MA length is fixed (e.g., a 50-period SMA), the FlexiMA varies its length with each iteration. This is done using a **starting factor** and an **increment factor**.
The formula for the moving average length at each iteration \(i\) is:
`MA_length_i = indicator_length * (starting_factor + i * increment_factor)`
Where:
- `indicator_length` is the user-defined base length.
- `starting_factor` is the initial multiplier of the base length.
- `increment_factor` increases the multiplier in each iteration.
Each iteration applies a **simple moving average** (SMA) to the chosen **indicator source** (e.g., HLC3) with a different length based on the above formula. The deviation between the current price and the moving average is then calculated as follows:
`deviation_i = price_current - MA_i`
These deviations are normalized using one of the following methods:
- **Max-Min normalization**:
`normalized_i = (deviation_i - min(deviations)) / range(deviations)`
- **Absolute Sum normalization**:
`normalized_i = deviation_i / sum(|deviation_i|)`
The **median** and **standard deviation (stdev)** of the normalized deviations are then calculated as follows:
`median = median(normalized deviations)`
For the standard deviation:
`stdev = sqrt((1/(N-1)) * sum((normalized_i - mean)^2))`
These values are plotted to provide a clear indication of how the price is deviating from its variable-length moving averages.
For more detail:
🔶 Multi-Step Take Profit
This strategy uses a multi-step take profit system, allowing for exits at different stages of a trade based on the percentage of price movement. Three take-profit levels are defined:
- Take Profit Level 1 (TP1): A small, quick profit level (e.g., 2%).
- Take Profit Level 2 (TP2): A medium-level profit target (e.g., 8%).
- Take Profit Level 3 (TP3): A larger, more ambitious target (e.g., 18%).
At each level, a corresponding percentage of the trade is exited:
- TP Percent 1: E.g., 30% of the position.
- TP Percent 2: E.g., 20% of the position.
- TP Percent 3: E.g., 15% of the position.
This approach ensures that profits are locked in progressively, reducing the risk of market reversals wiping out potential gains.
Local
🔶 Trade Entry and Exit Conditions
The entry and exit signals are determined by the interaction between the **SuperTrend Polyfactor Oscillator** and the **median** value of the normalized deviations:
- Long entry: The SuperTrend turns bearish, and the median value of the deviations is positive.
- Short entry: The SuperTrend turns bullish, and the median value is negative.
Similarly, trades are exited when the SuperTrend flips direction.
* The SuperTrend Toolkit is made by @EliCobra
█ Trade Direction
The strategy allows users to specify the desired trade direction:
- Long: Only long positions will be taken.
- Short: Only short positions will be taken.
- Both: Both long and short positions are allowed based on the conditions.
This flexibility allows the strategy to adapt to different market conditions and trading styles, whether you're looking to buy low and sell high, or sell high and buy low.
█ Usage
This strategy can be applied across various asset classes, including stocks, cryptocurrencies, and forex. The primary use case is to take advantage of market volatility by using a flexible moving average and multiple take-profit levels to capture profits incrementally as the market moves in your favor.
How to Use:
1. Configure the Inputs: Start by adjusting the **Indicator Length**, **Starting Factor**, and **Increment Factor** to suit your chosen asset. The defaults work well for most markets, but fine-tuning them can improve performance.
2. Set the Take Profit Levels: Adjust the three **TP levels** and their corresponding **percentages** based on your risk tolerance and the expected volatility of the market.
3. Monitor the Strategy: The SuperTrend and the FlexiMA variance tracker will provide entry and exit signals, automatically managing the positions and taking profits at the pre-set levels.
█ Default Settings
The default settings for the strategy are configured to provide a balanced approach that works across different market conditions:
Indicator Length (10):
This controls the base length for the moving average. A lower length makes the moving average more responsive to price changes, while a higher length smooths out fluctuations, making the strategy less sensitive to short-term price movements.
Starting Factor (1.0):
This determines the initial multiplier applied to the moving average length. A higher starting factor will increase the average length, making it slower to react to price changes.
Increment Factor (1.0):
This increases the moving average length in each iteration. A larger increment factor creates a wider range of moving average lengths, allowing the strategy to track both short-term and long-term trends simultaneously.
Normalization Method ('None'):
Three methods of normalization can be applied to the deviations:
- None: No normalization applied, using raw deviations.
- Max-Min: Normalizes based on the range between the maximum and minimum deviations.
- Absolute Sum: Normalizes based on the total sum of absolute deviations.
Take Profit Levels:
- TP1 (2%): A quick exit to capture small price movements.
- TP2 (8%): A medium-term profit target for stronger trends.
- TP3 (18%): A long-term target for strong price moves.
Take Profit Percentages:
- TP Percent 1 (30%): Exits 30% of the position at TP1.
- TP Percent 2 (20%): Exits 20% of the position at TP2.
- TP Percent 3 (15%): Exits 15% of the position at TP3.
Effect of Variables on Performance:
- Short Indicator Lengths: More responsive to price changes but prone to false signals.
- Higher Starting Factor: Slows down the response, useful for longer-term trend following.
- Higher Increment Factor: Widens the variability in moving average lengths, making the strategy adapt to both short-term and long-term price trends.
- Aggressive Take Profit Levels: Allows for quick profit-taking in volatile markets but may exit positions prematurely in strong trends.
The default configuration offers a moderate balance between short-term responsiveness and long-term trend capturing, suitable for most traders. However, users can adjust these variables to optimize performance based on market conditions and personal preferences.
