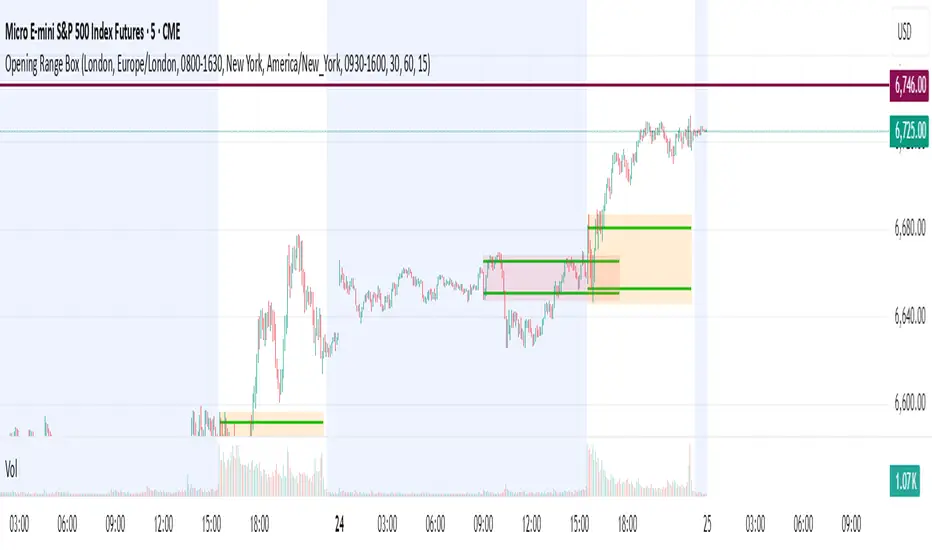
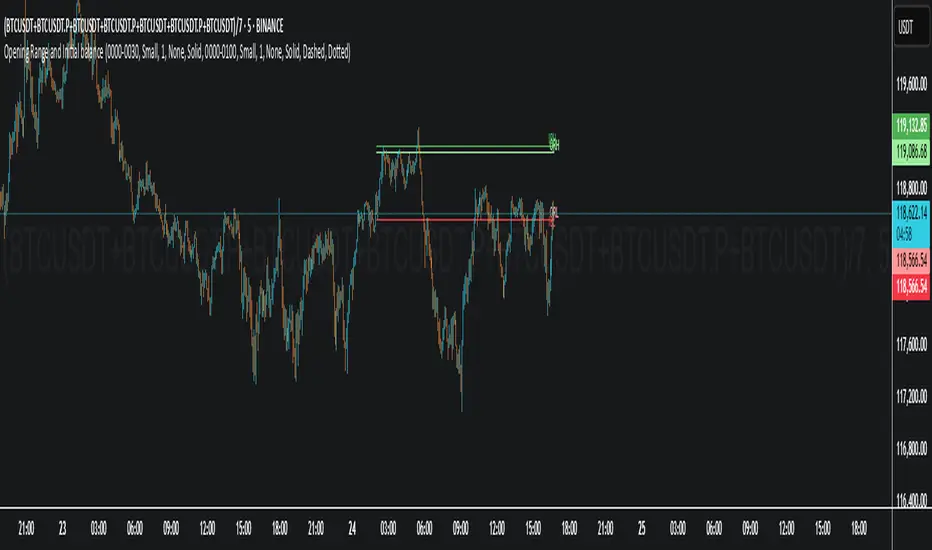
Initial Value Breakout [OmegaTools]Initial Value Breakout (Ω IVB) is an intraday market structure indicator designed to identify, extend, and contextualize the Initial Value range formed during a user-defined opening session, with a default focus on the New York market open. The script is built for traders who want a structured and objective framework for reading early-session price discovery, tracking breakout direction, mapping expansion levels, and estimating adaptive continuation targets based on recent realized behavior. It is particularly effective on instruments where the opening phase provides meaningful information about participation, volatility, and directional intent, such as index futures, equities, and liquid intraday markets.
The core idea of the indicator is to capture the high and low established during a configurable opening window and treat that range as the session’s Initial Value structure. Once the session ends, the script projects this structure forward through a configurable validity period, allowing the trader to monitor how price interacts with the key boundaries for the rest of the day. In practice, this creates a clean reference framework that can be used to distinguish between balanced sessions, failed breakouts, and genuine range expansion environments.
During the selected opening session, the indicator continuously tracks the session high and session low while also collecting bar-by-bar mid-price data. This allows the script not only to define the upper and lower boundaries of the Initial Value range, but also to calculate a more stable internal reference level that reflects the opening distribution of price. Instead of relying on a simple midpoint between the session high and low, the script derives a center line using a hybrid central tendency approach that combines the average and median of opening-session mid-prices. This makes the central line more robust to isolated spikes and erratic early-session prints while still preserving responsiveness to the underlying structure.
After the Initial Value range is formed, the script monitors price action for breakout events and updates a directional bias when price crosses above the Initial Value high or below the Initial Value low. This bias acts as a structural state variable for the session and is used both as a visual context cue and as part of the adaptive target logic. In practical terms, the bias helps the trader distinguish whether the market is currently expressing upside or downside initiative relative to the opening range, which is often critical when evaluating continuation setups versus reversion opportunities.
In addition to the primary Initial Value high and low, the indicator can display deviation levels that project one full Initial Value range above and below the original boundaries. These expansion levels provide objective continuation references and are useful for identifying whether a breakout is developing into a true trend day or simply producing a short-lived excursion. Because the deviation levels are derived directly from the width of the opening range, they scale automatically with the session’s early volatility and remain instrument-agnostic in their construction.
A key advanced feature of Ω IVB is its adaptive target system. Rather than relying exclusively on fixed range multiples, the script estimates continuation targets using recent realized breakout extensions observed during prior sessions. When a session ends and the Initial Value structure is reset, the script records how far price extended beyond the Initial Value boundary in the direction of the active bias within the configured validity window. Upside extensions and downside extensions are tracked separately in rolling samples, allowing the indicator to maintain side-specific behavior profiles. The script then computes projected upside and downside targets by applying the average of these recent realized extensions to the current session’s Initial Value boundaries. This creates dynamic targets that adapt to the instrument’s recent intraday expansion characteristics and can be more informative than static multipliers in changing volatility regimes.
The indicator also includes an optional VWAP that resets from the beginning of the Initial Value session. This provides an additional institutional-style benchmark for evaluating price acceptance, trend quality, and rotational behavior relative to the opening structure. When enabled, the VWAP can be used alongside the Initial Value lines and breakout bias to refine trade selection, especially in cases where price breaks the range but fails to hold above or below both the range boundary and VWAP.
From a visual design perspective, the script is intentionally built around line objects and line fill objects to produce a clean and precise intraday chart presentation. The Initial Value high and low are displayed as horizontal reference lines, while the optional center line, deviation levels, and adaptive targets can be layered on demand depending on the user’s preferred level of detail. Optional filled zones can be enabled to visually emphasize the Initial Value area and the deviation bands, making it easier to read structure at a glance without overcrowding the chart. Bullish and bearish colors are fully customizable so the indicator can be integrated into different chart themes and workflow preferences.
The session and validity inputs allow the script to be tailored to different instruments and trading styles while preserving the same logic. The session input defines the exact time window used to construct the Initial Value range in New York time, and the validity input determines how long the levels remain active and how far the script looks when measuring realized post-breakout extensions for the adaptive target model. This makes the tool flexible enough for traders who focus on the cash open, the first hour, or custom opening structures, while still maintaining a consistent statistical framework.
Ω IVB is well suited for traders who use opening range logic, session structure analysis, breakout continuation models, and rule-based intraday execution. It can be used to frame directional bias, identify acceptance or rejection around key opening references, plan profit-taking zones, and distinguish between balanced and expanding sessions. It becomes particularly powerful when combined with order flow analysis, volume studies, market internals, or discretionary tape reading, because it provides a stable structural map around which more granular execution decisions can be made.
As with any analytical tool, the indicator is intended to support decision-making rather than replace a complete trading process. It should be used within a broader framework that includes risk management, position sizing, and execution discipline. When used correctly, Initial Value Breakout provides a professional and systematic way to interpret the opening phase of the market and translate that information into actionable intraday structure.
By Eros, OmegaTools
Pine Script® indicator