CDOI ProfileCumulative Delta of Open Interest Profile
This script lets you visualize where there were Open Interest build-ups and discharges on a price basis.
It only supports pairs where TradingView added the appropriate Open Interest data (at the time of posting that is only Binance and Kraken perpetual contracts)
The script uses my own functions to poll lower timeframe data and compile it into a higher timeframe profile. And as such, it needs some tweaking to adjust it to your timeframe until Tradingview lets me do it codewise (hopefully one day)
The instructions for using the Indicators are as follows:
Condition: How often a new profile should be generated
Sampling Rate and 1/Nth of the TF: These have to be calculated together to have a product that should correspond to the current timeframe in minutes. A few examples below
----------- Sampling - 1Nth of the TF
5 min ------- 5 --------------- 1
10 min ------ 10 ------------- 1
15 min ------ 5 --------------- 3
20 min ------ 10 ------------- 2
30 min ------ 10 -------------- 3
45 min ------- 9 -------------- 5
1 hour ------- 10 ------------- 6
4 hours ----- 10 -------------- 24
1 day -------- 10 ------------- 144
Transparency: This one is pretty self-explanatory but only applies to the Profile bars
% change for a bar: This one indicates how precise each bar will be, but if you go too low the script becomes too heavy and stop running
Bar limit: Limits the amounts of bars the script is run for (ae for the last 1000 bars). Lower = faster loading, too high will stop running
UI color: Color and transparency of the center line and the box surrounding the whole profile
Open Interest

WhaleCrew Binance Open InterestShows Open Interest of ANY Binance pair (BTCUSD, ETHUSD, ADAUSD, ...).
Inverse and USDT pairs
Preset-Pairs (BTC, ETH, XRP, ADA, SOL, DOT, ...)
Custom Candle Colors (candles can be turned off)
Open Interest Auto SpaceManBTCOpen Interest Auto SpaceManBTC
This is an extension to the script, it aims to provide the data in a less hands on way by providing the basis for automatic calculation on which symbol the data is being pulled from.
Changelog:
Automatic Data retrieval on a percoin basis.
Ability to hide or show symbol.
Coloring choices for the user.

Binance Open InterestIntro
A free and open source indicator that shows you open interest for Binance USDT and coin margin perpetual swap contracts, plotted as candlesticks.
Open interest means the total number of outstanding derivatives contracts, or in plain and simple English: the total amount of positions that traders have opened and still remain open.
Instructions
I've included data for a variety of cryptocurrencies that are quite popular right now.
However, since it's open source you can of course add any coin you want.
It's important to know that coin margin contracts have their open interest denominated in USD.
So if, for example, the ETH/USD perp shows a value of 470 million, that means 470 mil USD.
Tether margin contracts on the other hand are denominated in the coin itself.
So if, for example, the SOL/USDT perp shows a value of 1 million, that means 1 mil SOL worth of open contracts.
This is how the exchange created and denominated the contracts and I kept it this way to keep the data clean.
You could multiply that 1 mil SOL by the SOL price and it would show you the total open interest in USD terms of course, but that would make the candles look a bit funky.
If you look at the code you can see that for the coin margin contracts I've multiplied BTC open interest by a 100 and for altcoins I multiplied it by 10.
This is because of the Binance contract specifications, they use a multiplier of a 100 for bitcoin and altcoins have a multiplier of 10.
If you google "Binance Trading Rules of coin-margined Contracts" you'll find this info.
Some coins only have a USDT margin perp and not a coin margin perp.
YFI for example doesn't have a coin margin perp, but it is included in the list.
So if you select YFI and choose "coin margin" the indicator won't show anything.
The indicator still works, just select a different contract and you'll see open interest data appear again.
Access
It's free so just favourite it and you'll be able to add it to your chart and use it.
And it's also open source so you could just copy the code and make your own version of it.
Cheers.

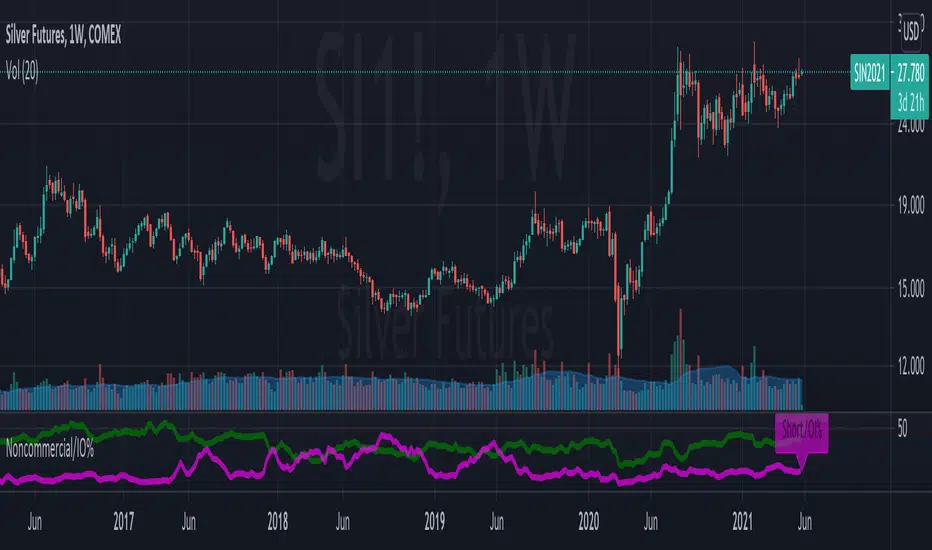
Noncommercial long futures position to overall Open InterestThis is an indicator that gets data from Quandl and presents weekly CFTC futures data (www.cftc.gov). In this indicator, the noncommercial long/short positions are calculated as a percentage of overall Open Interest. This indicates the bullish/bearish sentiment of the market.
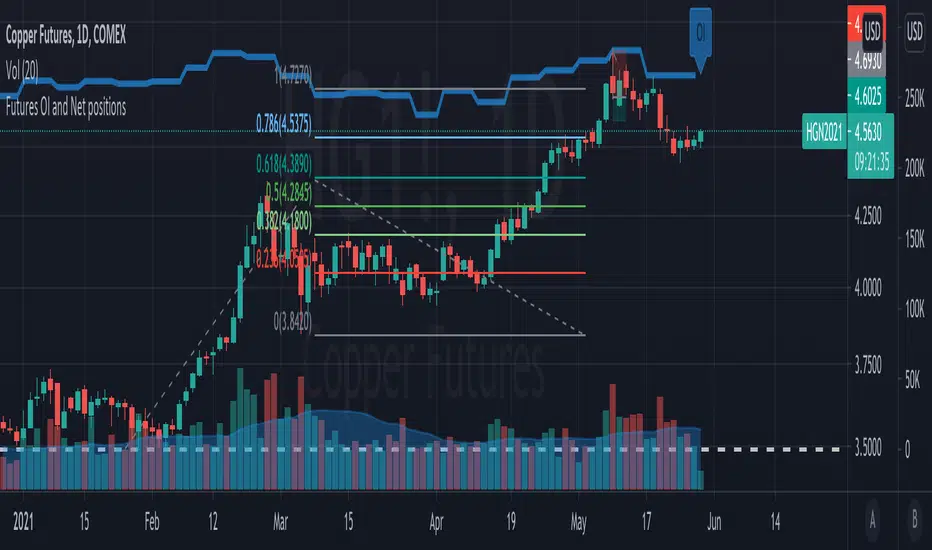
Futures OI and Net positionsThis is an indicator that gets data from Quandl and presents weekly CFTC futures data (www.cftc.gov). In this indicator, Open Interest (OI) and net noncommercial positions are presented. Net_noncommercial positions are calculated as noncommercial_long - noncommercial_short.
OI+BC CryptoIndicator shows change of Open Interest and colors bars if OI is rising(green), based on Bitfinex data.
Colored bars can tell you if there were real buys or sells in bar. There are several crypto assets.
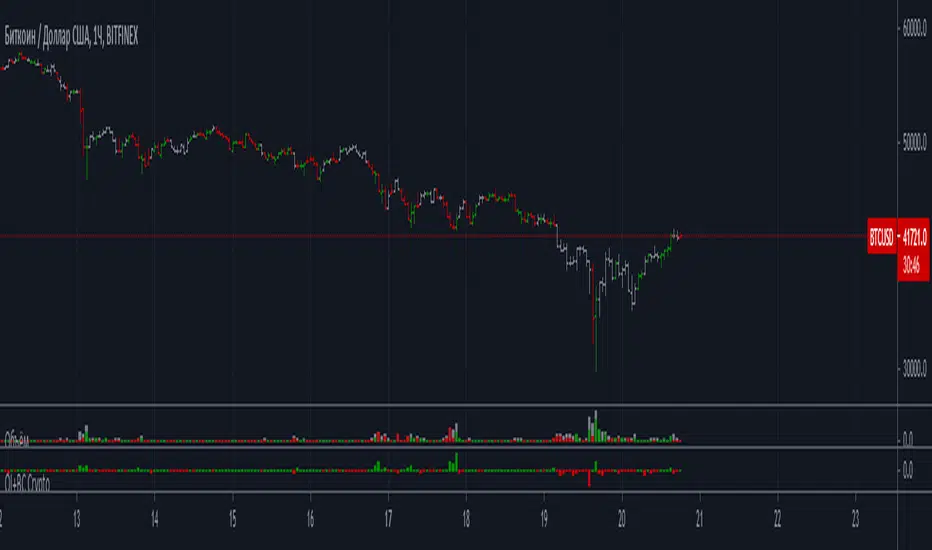
OI CryptoIndicator shows change of Open Interest based on Bitfinex data. There are several crypto assets


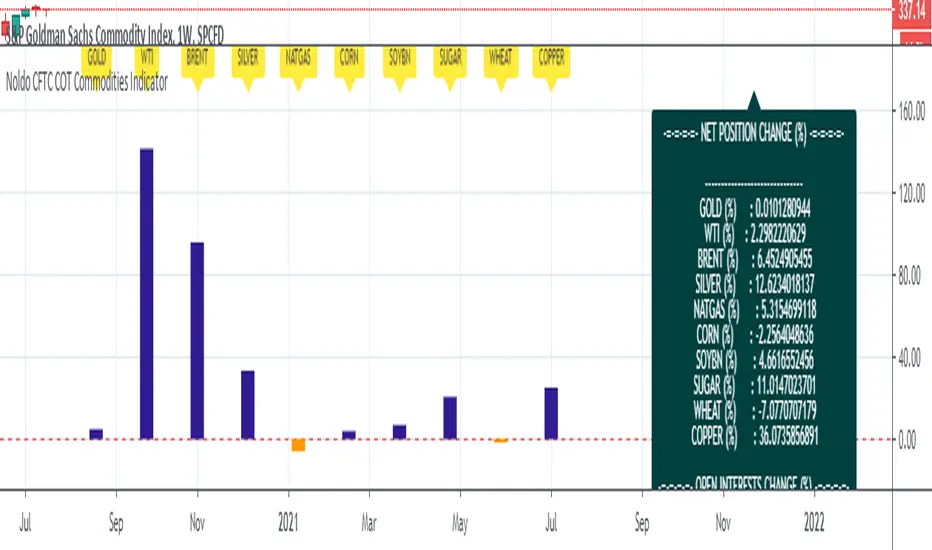
Noldo CFTC COT Commodities IndicatorHi.
Hello, this script has the same logic as Noldo CFTC COT Forex indicator :
It is the version for the future markets.
Major future assets are the subject.
Usage
This script works only on SPGSCI (S&P Goldman Sachs Commodity Index).
You must open SPGSCI :
www.tradingview.com
It only works on 1W graphics.
Because COT data is announced on Tuesday, it will cause repaint every Tuesday.
However, since it is a terminal, this factor is not strong enough to affect your decisions.
For use, you should open the bottom panel, go a little to the right in the history section and enlarge the panel you have opened.
The terminal will take its form in the presentation and provide analysis on the big screen.
COT data are pulled via Quandl.
Regards.
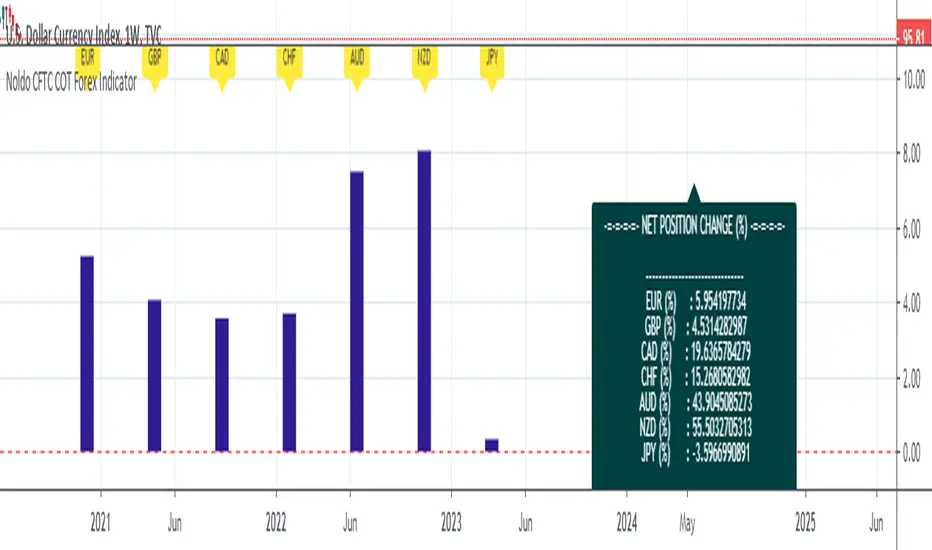
Noldo CFTC COT Forex IndicatorHello.
I decided to publish the COT Forex Indicator, which I created for convenience, as an open source.
The period DXY is determined by the differences between the two signals on the Pivot Reversal Strategy on the weekly chart.(1W)
Thus, relative period point search is automated.
When the new signal comes, after the closing, the number of bars between the previous bar before the new signal comes both directions.
This elapsed time is our period in which we will look back on relative changes.
If there is no signal, the period remains constant, thereby allowing us to notice excessive changes.
And in this period, COT data exchange and price changes are reflected in the terminal.
The automatic time-keeping of the period and the automatic generation of the relative differences of the terminals according to the period prevents a great loss of time.
Thus, we create one of the strong columns that enable us to make decisions.
The other column is the signals we obtained as a result of technical analysis.
The last column is the economic agenda and data tracking.
That's why I made my decision to share this:
Real life should not be distracted,
should not be drowned in the sea of technical analysis.
COT data is one of the most important and valuable tools that bring us signs of real life,
It should not be forgotten !
A lot of time is lost while doing these analyzes, and I wanted this to be much more practical and tidy!
And we can see if there are factors that will back up our incoming signals.
Usage
This script works only on DXY .
You must open DXY.
It only works on 1W graphics.
Because COT data is announced on Tuesday, it will cause repaint every Tuesday.
However, since it is a terminal, this factor is not strong enough to affect your decisions.
For use, you should open the bottom panel, go a little to the right in the history section and enlarge the panel you have opened.
The terminal will take its form in the presentation and provide analysis on the big screen.
COT data are pulled via Quandl.
General kind request:
Authors who know the technical broad expression of the security function or have an idea about its creation, please reach me.
Best regards.
Bitfinex BTC Open InterestBitfinex open interest, or bitcoin open interest chart, shows the amount of open positions currently on Bitfinex BTC / USD trading pairs. Usually when open interest reaches unusually high numbers we'll see an increased volatility in Bitcoin's price. The open interest chart could also be useful for determining the tops and bottoms for Bitcoin.

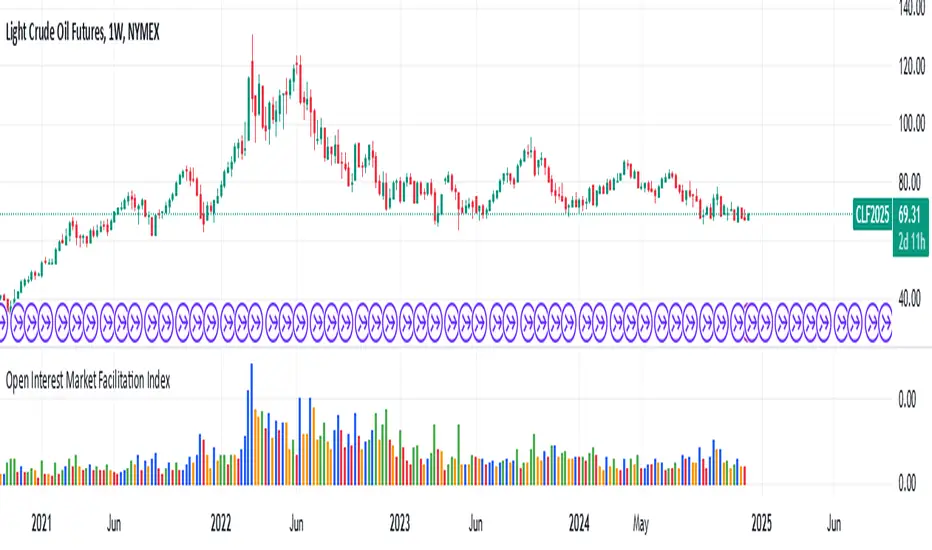
Open Interest Market Facilitation IndexOriginal script from ChartChampions :
Let's start.
This script was created by using Open Interest instead of Volume in the Market Facilitation Index.
Thus, it can make a difference in the Future and CFD Markets.
If your financial instrument is not from these markets, that is, if Open Interest is not used, you can choose Volume.
You can set "FUTURES" and "OTHERS" from the menu.
If you use the Open Interest (FUTURES) option in the menu on 1W bars and defined Future markets, it will not repaint.
This is the best use for Open Interests, as data is extracted from Quandl and CFTC COT reports are published once a week.
Color Change Rules :
In my version :
Green Bars = Green
Fade Bars = Orange
Fake Bars = Blue
Squat Bars = Red
To show the difference in the presentation, both the Futures option using Open Interest and the Others option using Volume were published to compare.
You can observe the difference.
Best regards.
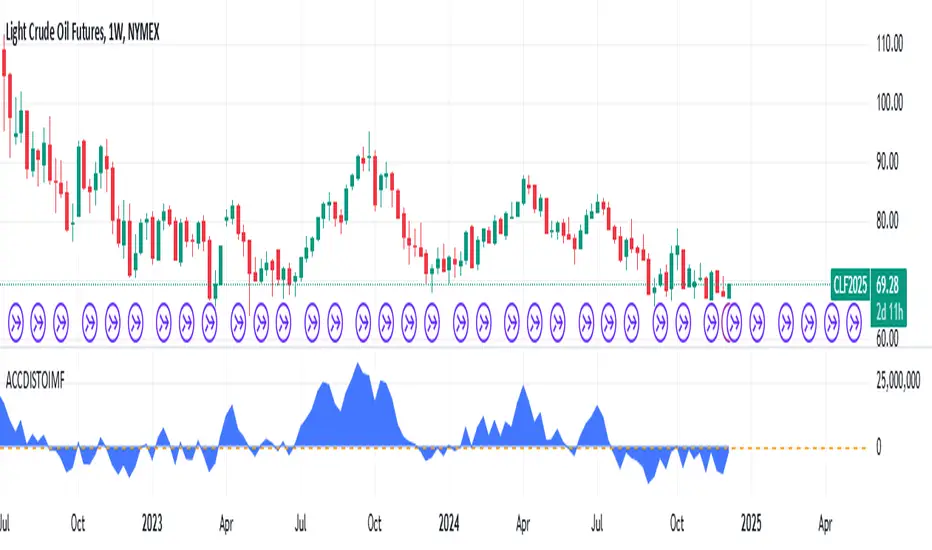
Accumulation/Distribution Open Interest Money Flow Hi, this script is the version of Accumulation / Distribution Money Flow (ADMF) that uses Open Interes ts in the required markets instead of Volume.
Can be set from the menu. (Futures/Others)
NOTE: I only modified this script.
The original script belongs to cl8DH.
Original of the script:
I think it will make a difference in the future and commodity markets.
Since the system uses CFTC data, use only for 1W timeframe.
With my best regards..
Open Interest Stochastic Money Flow IndexThis is the improved version of Stochastic Money Flow Index script that uses Open Interest instead of volume in Future markets.
I think it will make a difference especially in Future and CFD markets.
Since the system will pull data from Quandl, CFTC reports may cause repaint when disclosed.
So if you use it during the weekly time frame (1W), it will definitely not repaint.
You can also use the volume by selecting "Others" from the menu.This option applies to each instrument, you can use it on any financial instrument with or without COT data.
Bitcoin is included in the "Futures" option.
In Futures, you can observe the difference of Open Interest's success by comparing, since it counts exchanges between the two parties singularly, it reacts more firmly to speculative movements.
This script also includes alerts and bar color options, you can use from the menu.
It is also suitable for mutable variables.This script was freed from the integer loads.You can modify it in any adaptive or fractional period.
I hope it will help your analyzes, regards .

Open Interest Money Flow Index (OIMFI)CAUTION : This system was inspired from seiglerj' s "Money Flow Index " script. Open Interests are used instead of volume.
What is the Money Flow Index ( MFI )?
The Money Flow Index ( MFI ) is a technical oscillator that uses price and volume for identifying overbought or oversold conditions in an asset. It can also be used to spot divergences which warn of a trend change in price. The oscillator moves between 0 and 100.
Unlike conventional oscillators such as the Relative Strength Index ( RSI ), the Money Flow Index incorporates both price and volume data, as opposed to just price. For this reason, some analysts call MFI the volume-weighted RSI .
What Does the Money Flow Index ( MFI ) Tell You?
One of the primary ways to use the Money Flow Index is when there is a divergence. A divergence is when the oscillator is moving in the opposite direction of price. This is a signal of a potential reversal in the prevailing price trend.
For example, a very high Money Flow Index that begins to fall below a reading of 80 while the underlying security continues to climb is a price reversal signal to the downside. Conversely, a very low MFI reading that climbs above a reading of 20 while the underlying security continues to sell off is a price reversal signal to the upside.
Traders also watch for larger divergences using multiple waves in the price and MFI . For example, a stock peaks at $10, pulls back to $8, and then rallies to $12. The price has made two successive highs, at $10 and $12. If MFI makes a lower higher when the price reaches $12, the indicator is not confirming the new high. This could foreshadow a decline in price.
The overbought and oversold levels are also used to signal possible trading opportunities. Moves below 10 and above 90 are rare. Traders watch for the MFI to move back above 10 to signal a long trade, and to drop below 90 to signal a short trade.
Other moves out of overbought or oversold territory can also be useful. For example, when an asset is in an uptrend, a drop below 20 (or even 30) and then a rally back above it could indicate a pullback is over and the price uptrend is resuming. The same goes for a downtrend. A short-term rally could push the MFI up to 70 or 80, but when it drops back below that could be the time to enter a short trade in preparation for another drop .
Reference : www.investopedia.com
WARNING :
** Since each instrument in the list has its own unique contract data, you must first enter its name to display it. I recommend you to select OANDA from the markets. Finally, when the COT reports are issued, it may repaints. However, this repaint is usually close to closing or after close .(When COT reports are so sharp ) So use this script only 1W ( 1 week ) or 1 M ( 1 month ) timeframe.
** This data is taken to Tradingview with the help of Quandl. This is a very low possibility, but the system will not work if there is a malfunction.
FEATURES :
*** Working with all futures (Including : Bitcoin )
*** If you dont work with "Futures" , you can select "Others" from switchable menu and use volume for all instruments.
*** New generation elegant design used : Adaptive coloring Overbought - Oversold Levels according to the closing price.
NOTE : This code is open source under the MIT License. If you have any improvements or corrections to suggest, please send me a pull request via the github repository github.com
Stay tuned. Best wishes !

Weiss Wave Open Interest BarsFirstly :
LazyBear ' s "Weiss Wave " codes are used for open interests.
Original Weiss Wave Volume :
Let's start :
Open Interest vs. Volume: An Overview
Volume and open interest are two key measurements that describe the liquidity and activity of contracts In the options and futures markets. However, their meanings and applications are different. Volume refers to the number of contracts traded in a given period, while open interest denotes the number of active contracts.
Volume
Trading volume measures the number of options or futures contracts being exchanged between buyers and sellers, identifying the level of activity for that particular contract. For every buyer, there is a seller, and the transaction itself counts toward the daily volume.
Open Interest
Open interest indicates the number of options or futures contracts that are held by traders and investors in active positions. These positions have not been closed out, expired, or exercised. Open interest decreases when holders and writers of options (or buyers and sellers of futures) close out their positions. To close out positions, they must take offsetting positions or exercise their options. Open interest increases once again when investors and traders open new long positions or writers/sellers take on new short positions. Open interest also increases when new options or futures contracts are created.
Options or futures contract trading volume can only increase while open interest can either increase or decrease. While trading volume indicates the number of contracts that have been bought or sold, open interest identifies the number of contracts that are currently held.
Reference : www.investopedia.com
*** Worked to define all futures . You can look them in codes (between line : 13 to line 94 )
** CAUTION 1 : Since each instrument in the list has its own unique contract data, you must first enter its name to display it. I recommend you to select OANDA from the markets. Finally, when the COT reports are issued, it may repaints. However, this repaint is usually close to closing or after close .(When COT reports are so sharp ) So use this script only 1W ( 1 week ) or 1 M ( 1 month ) timeframe.
** CAUTION 2 : This data is taken to Tradingview with the help of Quandl. This is a tremendous possibility, but the system will not work if there is a malfunction.
Best regards.

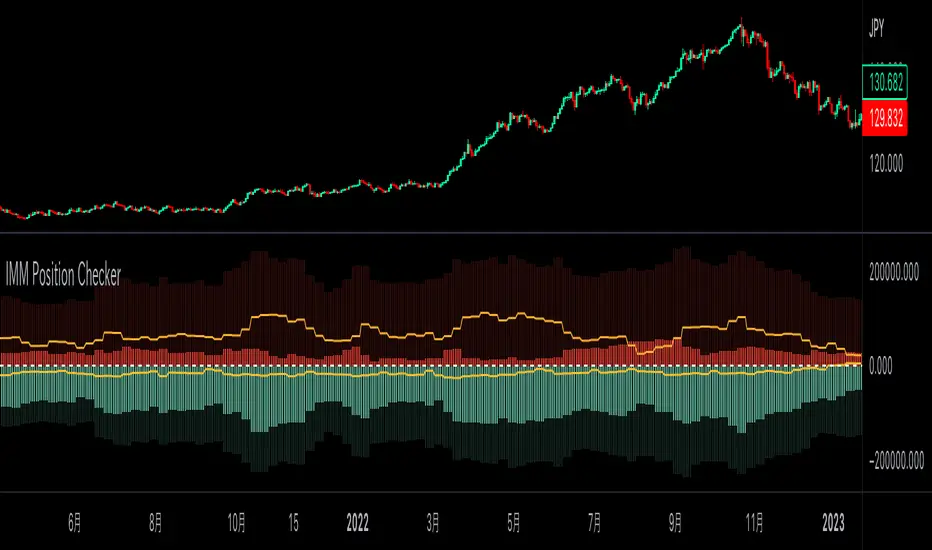
IMM Position CheckerCFTC建玉明細インジケータ『IMM Position Checker』
Commodity Futures Trading Commission (CFTC)からシカゴIMM通貨先物ポジションのデータを自動インポートし、チャート上に表示するインジケータです。
各証券会社や為替情報サイトで見られるものよりも、より期間・確認できる銘柄が広範で、ユーザーのニーズに合わせて表示できる自由度の高いものにしました。
詳細・購入はこちらにて(https://note.mu/cryptokitsune/n/n345110c8f4d2)
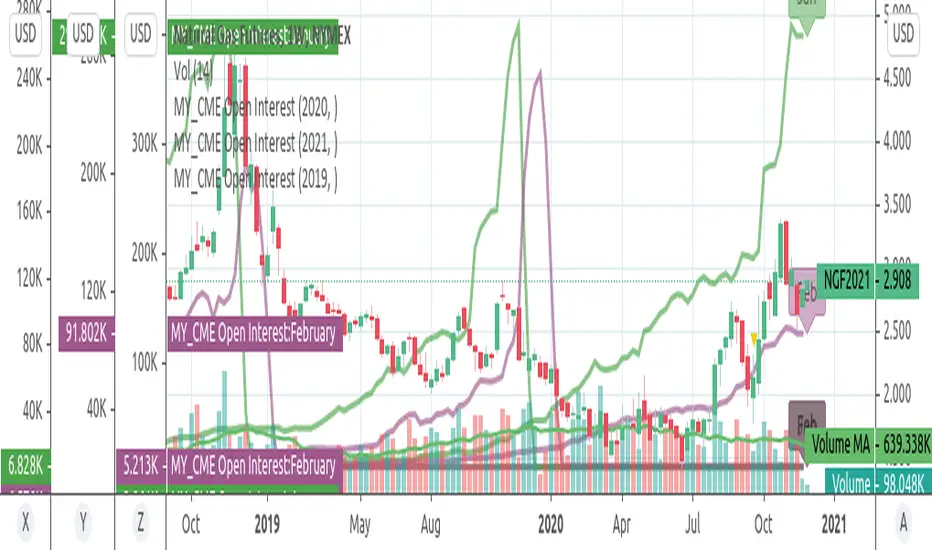
Open Interest:CME e-o-d vs CFTC e-o-wCFTC only publishes total OI on fridays, related to last Tuesday.
But what happened since last Tuesday?
CME Vol & Open Interest data is recorded&exported daily by quandl.com to tradingview
via the che CHRIS/CME datasets
www.quandl.com
Eg. Nat Gas next outstanding cntract n. 20, field n. 7(OI)
@quandl.com:
www.quandl.com
is exported @tradingview:
www.tradingview.com
Every outstanding contract's OI & vol is exported (black column), but not the total (yellow line):
tiny.cc
This script sums up all the existing outstanding contract's OI for the future (the black column), so one can have an idea of the total OI for the day (Yellow line).
As numer of outstanding contracts varies from future to future,Eg:
E-mini (ES) has 4 contracts, Gold(GC) 16 cntrcts, NatGas(NG) has 43, WTI(CL) has 38 etc
the scrips tries to guess how many exist for it and sums them up, to have the total OI for tha day
Number ofoutstanding contracts exported by quandl.com to tradingview is taken from
s3.amazonaws.com
There are 2 params you can enter on the script:
* override the ticket symbol on the chart ,if script cannot guessit or you need a different one
* enter the "preliminary" OI that is published by CME early the next day, butb not yet exported by quandl to tradingview
This script is Open so anyone can copy and modifyit for its use.
Please post comments and ideas if you find it useful
I try to keep a log of my work here:

MY_CME eod OI vs CFTC eow OIDaily e-o-d Open Interest as published by CME.
As CFTC COT Open Interest relates to last Tuesday, here you can have an idea how things evolved day-by-day since then.
As CME total OI is not accessibl as data, here I sum OI of the next 9 outstanding contracts, which gives a fair idea of the trend in OI

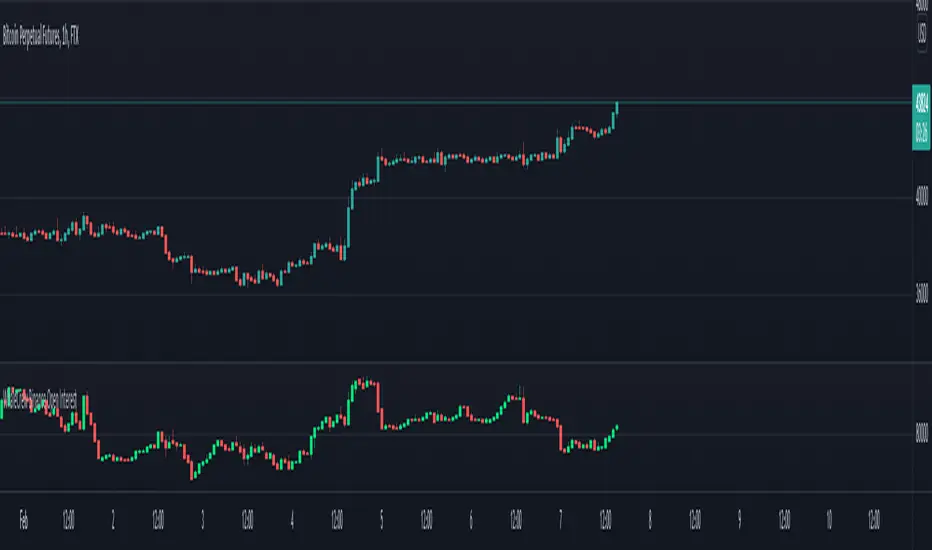
Bitfinex Open Interest ChangeThe script shows changes in Bitfinex open interest from the previous candle.
Key:
Positive green bar = Open interest increase, predominantly longs opening.
Positive red bar = Open interest increase, predominantly shorts opening.
Negative green bar = Open interest decrease, predominantly longs closing.
Negative red bar = Open interest decrease, predominantly shorts closing.
Token selection between top trading pairs is in the options.

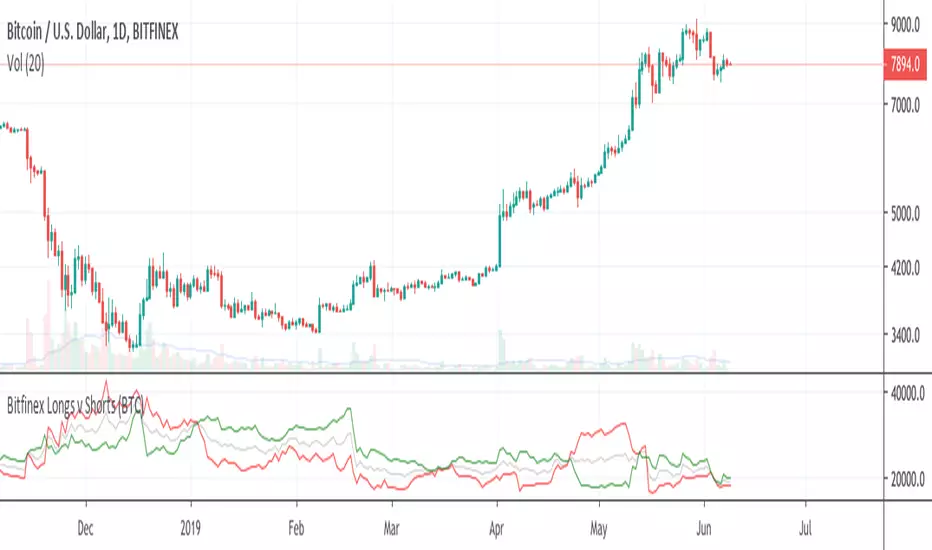
Bitfinex Longs v Shorts - Token Selectorimgur.com
The script enables you to easily switch between the top trading pairs on Bitfinex to show the long vs. short data.
MY_CME Open Interestend-of-day Open Interest as provided by CME for D interval.
Can select Commodity (Gold.Silver,Crude), year, contract (Feb,April,June,AugOct,Dec)