Smart Money Trap SignalSmart Money Trap Signal – Indicator Description
The Smart Money Trap Signal is a precision-based trading tool designed to identify areas where institutional traders (smart money) are likely to trap retail traders through false breakouts and liquidity grabs. These traps often occur near key highs and lows, where retail traders are lured into trades just before price reverses sharply.
🔍 Key Features:
Liquidity Sweep Detection
Identifies false breakouts of recent swing highs or lows, signaling potential liquidity grabs by large players.
Reversal Confirmation
Confirms the trap using a classic price action reversal pattern (bullish or bearish engulfing), helping filter out weak signals.
Optional Volume Spike Filter
Allows additional confirmation based on a significant spike in volume, indicating potential institutional involvement.
Buy and Sell Trap Signals
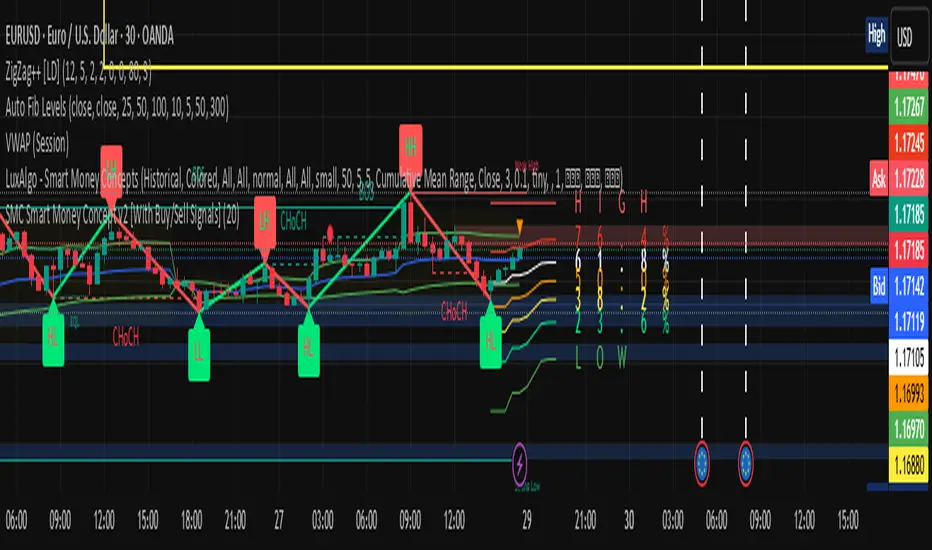
🔴 Smart Money Short (SMT↓) – Triggered when price sweeps a high and reverses down.
🟢 Smart Money Long (SMT↑) – Triggered when price sweeps a low and reverses up.
Alerts & Labels
Real-time alert conditions and on-chart labels to help you catch setups without missing opportunities.
📈 How to Use:
Apply on Higher Timeframes (1H, 4H, Daily) for cleaner signals.
Look for SMT signals at key supply/demand zones or market structure points.
Combine with your existing trading strategy, such as order blocks or break of structure (BoS), for higher accuracy.
Use volume filter only if you're analyzing markets where volume data is reliable.
⚠️ Disclaimer:
This tool is meant to assist with trade identification, not trade execution. Always use proper risk management and validate setups with your trading plan.
Pine Script® indicator