IV vs Realised Volatility (VIX/HV Comparator)VIX / HV Comparator – Implied vs Realised Volatility
This indicator compares Implied Volatility (IV) from a volatility index (VIX, India VIX, etc.) with the Realised / Historical Volatility (HV) of the current chart symbol.
It helps you see whether options are pricing volatility as rich or cheap relative to what the underlying is actually doing.
What it does
Pulls IV from any user-selected vol index symbol (e.g. CBOE:VIX for SPX, NSEINDIA:INDIAVIX for Nifty).
Calculates realised volatility from the chart’s price data using returns over a user-defined lookback.
Annualises HV so IV and HV are displayed on the same percentage scale, on any timeframe (intraday or higher).
Optionally shows an IV/HV ratio in a separate pane to highlight when options are rich or cheap relative to realised volatility.
How to read it
Main panel:
Orange line – Implied Volatility (IV) from your chosen vol index.
Aqua line – Realised / Historical Volatility (HV) of the current chart symbol.
Fill between lines:
Green shading -> IV > HV -> options are priced richer than what the underlying is currently realising.
Red shading -> HV > IV -> realised vol is higher than the options market is implying.
Sub-panel (optional):
IV / HV ratio
- Above 1 -> IV > HV (vol rich).
- Below 1 -> IV < HV (vol cheap).
- Horizontal guides (for example 1.2 / 0.8) help frame “significantly rich/cheap” zones.
A small label on the latest bar displays the current IV, HV and their difference in vol points.
Inputs (key ones)
IV Index Symbol – choose the volatility index that corresponds to your underlying (VIX, India VIX, etc.).
Realised Vol Lookback – number of bars used to compute HV (for example 20).
Trading Days per Year and Active Hours per Day – used for annualising HV so it stays consistent across timeframes.
IV Scale Factor – adjust if your IV index is quoted in decimals (0.15) instead of points (15).
Practical uses
Context for options trades – Quickly see if current IV is high or low relative to realised volatility when deciding on strategies (premium selling vs buying, spreads, hedges).
Vol regime analysis – Track shifts where HV starts to rise above IV (real stress building) or IV spikes far above HV (fear premium / insurance bid).
Cross-timeframe checks – Use on intraday charts for short-term trading context, or on daily/weekly charts for bigger picture vol regimes.
This tool is not a stand-alone signal generator. It is meant to be a volatility dashboard you combine with your usual price action, trend, and options strategy rules to understand how the options market is pricing risk vs what the underlying is actually delivering.
Optionsstrategies

GexView📈 OVERVIEW
GexView indicator plots the Historical Gamma Exposure (GEX) profile, directly on the chart. It enables traders and analysts to observe how GEX profile evolve across multiple days/sessions.
🧲 CONCEPT
Today everybody uses Gamma Exposure. Gamma is the ROC (Rate of Change) for an option’s delta. GEX is crucial for all traders, not just intraday traders, because it helps assess market stability and potential volatility shifts driven by options positioning.
High positive GEX generally implies a mean-reverting market, where big price swings are dampened, while negative GEX signals increased volatility and potential large moves.
Understanding GEX allows traders to anticipate liquidity-driven price action, identify key support and resistance levels, and adjust strategies accordingly. In today’s market, where options flow heavily influences underlying assets, ignoring GEX can mean missing critical market dynamics that impact both short-term and long-term positions.
💡 UNIQUENESS
This indicator is a unique tool and offers a groundbreaking way to visualize market dynamics by plotting Historical Gamma Exposure (GEX), like a Volume Profile across multiple days or sessions. For the first time, traders can clearly see how GEX levels evolve over time, revealing how certain price zones gain or lose importance as market conditions change. This multi-session GEX profile allows users to identify persistent areas of dealer positioning and potential support or resistance that develop and shift over days. Unlike traditional GEX tools designed primarily for intraday use, this indicator provides valuable insight for both short-term traders and medium-term investors seeking to understand how option market flows influence price behaviour over extended periods.
⚙️ FEATURES
• Historical Gamma Exposure
The GexView indicator by default plots the last 6 days of the GEX profile, providing a framework for understanding the bigger picture.
• GEX profile
Displays the 10 largest GEX levels across all expirations (thick lines), as well as the 10 largest GEX levels for the next expiration (thin lines, 0DTE or upcoming).
• Update
Daily, after market close, based on new open interest. No more manual level imports.
Just one-click update.
• Settings
Option to plot total sum GEX for all expirations, or only net GEX for next expiration.
• Watchlist
SPX, NDX, DIA, SPY, QQQ, VIX, VXX, IBIT
(Additional tickers coming soon)
• Mapping
The indicator automatically detects and maps the underlying ticker on your chart, or lets you plot any symbol from the available watchlist.
🔍 HOW TO USE
• Identify intraday support and resistance levels shaped by option market dynamics
• Quickly spot significant GEX levels and compare how they relate to other key levels.
• Compare current vs. past GEX distributions for contextual trend analysis
• Observe structural GEX shifts that may align with volatility or mean-reversion setups
• Easily understanding if an asset trading on positive gamma (around green lines), or negative gamma (around red lines)
Examples:
1. DIA ETF
2. QQQ and VIX
📚 NOTES
• Calculation
GEX for All Expirations: This is the total sum (Call+Put) of gamma exposure of all expirations.
GEX for Nearest Expirations: This is the net sum (Call-Put) of gamma exposure of next expirations (0DTE if available).
• Trading Session - RTH & ETH
The indicator can include the extended trading hours when activated on the chart.
✅ VISUALIZATION
• Vertical implementation of gamma exposure profile.
• Thick lines represent the total gamma exposure across all expiration contracts.
• Thin lines represent the gamma exposure of next expiration only.
• All Expirations: Green colour if Calls > Puts, Red colour if Calls < Puts
• Next Expiration: Lime colour if Calls > Puts, Maroon colour if Calls < Puts
⚠️ DISCLAIMER
This indicator is provided for informational and educational purposes only.
It does not constitute financial advice or a recommendation to buy or sell any financial instrument.
Historical Gamma patterns and analytical interpretations do not guarantee future performance.
All analysis should be combined with independent research and risk management.

I4I Inside Vortex Strike RateThis indicator identifies what I call an "Inside Vortex": It's similar to a Doji but more strict in having to be inside a keltner and also have a lower ATR than a blended average.
The bar itself is not that special. But it indicates that a potential big move might come in the next 2 periods.
After the patter: It then looks at what I call the Market Maker High and Low: A % of a blended ATR. It then looks back 100-200 or more bars and calculates the overall strike % in history for the High and low after the pattern happens.
This allows us to know how often these levels are hit within the next 2 periods to find if we have any edge on spread, call or put prices or use them as targets.
So its:
Pattern:
Levels
Strike Rate.
Very unique and EXTREME useful. Especially for options traders.

TradeUniv.com Expected MovesTradeUniv.com Expected Moves
See where the market expects stocks to move based on options pricing data. This indicator shows you upper and lower price levels that help identify potential support, resistance, and overextended moves.
What Are Expected Moves?
Expected moves are calculated from option prices and show where the market thinks a stock is likely to trade by the end of the day or week. Think of them as probability zones - when price reaches or crosses these levels, it may signal an unusual
move or potential reversal opportunity.
What You'll See on Your Chart:
• Upper Level (Green) - Expected high for the period
• Lower Level (Red) - Expected low for the period• Midpoint (Gray) - Previous day's closing price (your reference point)
• Shaded Area - The expected trading range between levels
How to Use:
1. Visit www.tradeuniv.com
2. Select your favorite tickers
3. Click "Generate Script" and copy the TradingView input
4. Paste it into this indicator's settings
5. The indicator automatically shows the expected moves for whatever chart you're viewing
Perfect For:
• Day traders planning entry and exit zones
• Identifying when price has moved "too far too fast"
• Spotting potential reversal areas
• Understanding daily volatility expectations
• Planning option strategies around expected ranges
Features:
• Automatically detects daily vs weekly expirations (SPY, IWM, QQQ use daily; others use weekly)
• Customizable colors and line styles
• Price crossing alerts (get notified when price breaks above/below expected levels)
• Works on any timeframe
• Clean, minimal chart display
Important:
• Requires TradeUniv.com free account to generate data
• Refresh your data daily for accurate calculations
• Only shows levels for tickers you selected when generating

GB · Set upUp & Confirmation (Lower Pane)The GB Set-Up & Confirmation Indicator transforms raw momentum into a clear, color-coded decision framework for intraday scalping.
It’s the heartbeat monitor of 0DTE trading — revealing when momentum quietly shifts and when it explodes into confirmation.
Milliseconds Ahead: Confirm-on-Prior mode mimics predictive confirmation, letting traders catch reversals before the lag candle.
Noise-Adaptive: Near-zero band filtering reduces false breaks from micro volatility.
Visual Precision: Dual markers and labeled confirmations remove hesitation in execution.
Configurable Latency: Sensitivity presets + fine-tune ensure adaptability from SPX 1-min charts to QQQ 5-min momentum waves.
Platform: Designed for lower-pane deployment beneath the main price chart.
Primary Use: Time-sensitive momentum confirmation for 0DTE SPX/SPY/QQQ scalps.
Typical Workflow:
Wait for Early (Set-Up) triangle near the zero band → signals momentum shift.
Enter on the Confirmed triangle (or one candle prior if using “Confirm on Prior”).
Exit when opposite signal fires or wave color fades (momentum exhaustion).
Complementary Indicators: Pairs seamlessly with GB TMA Overlay, GB ORB Shading, or Phoenix Fire Confluence for full-stack entry validation.
Adaptive Sensitivity Presets
- Aggressive: reacts early to momentum pulses (scalp mode).
- Balanced: optimized for intraday consistency.
- Strict: waits for full trend maturity (swing mode).

PCP Arbitrage Monitor (Math by Thomas)Live monitor for Put–Call Parity (C + PV(K) = P + S) showing drift, arbitrage direction, and opportunity strength.
The PCP Arbitrage Monitor helps traders visualize and quantify deviations from the Put–Call Parity (PCP) relationship:
𝐶+𝐾𝑒−𝑟𝑇 = 𝑃+𝑆
When this equation drifts, it indicates a potential arbitrage opportunity between call, put, and underlying (spot or future).
This indicator plots the left-hand side (LHS) and right-hand side (RHS) of the PCP equation on your chart, computes the drift, and automatically highlights and displays actionable trade combinations when the deviation exceeds a set threshold.
⚙️ How It Works
Inputs
Call & Put Symbols – Select matching call and put options (same strike & expiry).
Strike (K) – The strike price for those options.
Expiry (UTC) – Option expiry date/time (used to calculate 𝑇 and PV(K)).
Risk-free Rate (r) – Annualized rate used for discounting the strike.
Lot Size / Tick Value – Used to calculate profit in INR.
Arbitrage Threshold – Minimum drift (in points) to trigger signals (default 200).
Displayed Data
LHS = C + PV(K) (Call + discounted Strike)
RHS = P + S (Put + Spot/Future)
Drift = LHS – RHS
Bookable Profit (INR)
Action Suggestion (only when |drift| ≥ threshold)
Background Highlight
🟩 Green – Call side expensive → Sell Call + Buy Put + Buy Fut
🟥 Red – Call side cheap → Buy Call + Sell Put + Sell Fut
Table
Displays all key values live in the top-right corner:
Option prices
LHS, RHS
Drift (points)
Time to expiry
Lot size
Bookable profit (INR)
Trade action (only if |drift| ≥ threshold)
📈 How to Use
Open a NIFTY Spot or Futures chart (works on both).
Enter the exact option symbols (e.g., NSE:NIFTY24DEC21900CE and NSE:NIFTY24DEC21900PE).
Adjust Strike (K) and Expiry to match those options.
Observe:
The green/red background highlights large deviations (≥ threshold).
The Action cell displays the arbitrage combination and expected profit.
A drift beyond the threshold suggests a potential risk-free arbitrage if executed simultaneously across all legs.
Hold positions till expiry if margin allows; the profit is theoretically locked in.
💡 Tips
Works on both Spot and Futures charts — the script auto-uses the chart’s close as 𝑆
Set smoothing to 0 to see raw parity values.
Adjust threshold based on costs and margin — e.g., 150–200 points for NIFTY is practical.
Only valid when options are European (no early exercise risk).
Ensure both option symbols are liquid and from the same expiry.
⚠️ Disclaimer
This tool is for educational and analytical purposes.
Real arbitrage execution depends on liquidity, bid-ask spread, slippage, and margin requirements.
Always validate prices with your broker before trading.

Gamma Exposure Levels by OMG (Oh My Gamma)OMG (Oh My Gamma) - Daily GEX Levels
An operational framework for Gamma analysis with daily data.
Indicator's Purpose & Demo Data
This indicator plots key strategic levels derived from Gamma Exposure (GEX) analysis. It showcases the operational logic of OhMyGamma analytical engine.
IMPORTANT: The levels plotted by this public script are based on a past date's snapshot for demonstration purposes. They are not valid for live trading and will not update automatically.
The real edge comes from using the fresh data structure provided daily.
How to Read the Levels
This indicator is designed to provide actionable intelligence, not just data. Here's how to read it:
The Levels: Each line represents a key strategic zone (Zero Gamma, Call/Put Walls, etc.) where a market reaction is statistically probable due to dealer hedging flows.
Line Thickness = Strategic Importance: The thickness of each line directly corresponds to its strategic rating. Thicker, solid lines represent higher-conviction zones.
Labels & Tooltips: Hover over a level's label on your chart to see its full description, confluences, and strategic rating.
Pro Tip: The Power of Confluence
This indicator is not a standalone "system". It's an institutional-grade intelligence layer. Its predictive power increases exponentially when used to find confluence with your own analysis.
The highest-probability trades occur when a key Gamma level aligns with:
Price Action: Key support/resistance zones, order blocks, or liquidity pools.
Volumetric Indicators: High/Low Volume Nodes (HVN/LVN) from Volume Profile, VWAP, and Anchored VWAP.
Use these levels to confirm your setups and gain the conviction to act.
How to Get the Daily Updated Script
This indicator requires a new Pine Script code each day to load the current session's data.
To get the daily updated code feel free to visit www.ohmygamma.com
Feedback & Suggestions
This tool is built for the community. Suggestions for improvements and new features are highly welcome and help the project evolve. Feel free to get in touch via the contact form on the website.
Disclaimer: This tool is for informational and educational purposes only. Trading involves significant risk. The authors assume no responsibility for any trading decisions.

Multi Straddle-Strangle ChartThis powerful indicator is designed for options traders who want to visualize and track the combined premium of multiple straddle and strangle strategies in a single, dedicated pane.
Quickly analyze and compare up to five different options strategies at a glance, directly on your chart. This tool is perfect for monitoring volatility, tracking potential profits/losses on a position, and spotting key support and resistance levels based on option premiums.
Key Features:
Plot Up to 5 Strategies: Simultaneously plot any combination of up to 5 straddles or strangles.
Real-Time Data: Fetches live data for both Call and Put options to give you an up-to-the-second view of the combined price.
Dynamic Symbol Generation: Automatically detects the underlying symbol (e.g., NIFTY, BANKNIFTY, stocks) and builds the correct option symbols based on your input.
Customizable Inputs: Easily configure the expiry date, strike prices and line colors for each of the 5 lines.
In-Chart Summary Table: A clean and clear table in the corner of your chart provides a quick summary of each enabled strategy and its current price.
Important Note on Usage:
This tool requires you to input a strike price in all fields, even if you do not plan to use all five lines. This is necessary because of a fundamental rule in the Pine Script language: every input must have a constant, non-empty default value. The indicator is optimized to only fetch data for the lines you have explicitly enabled with the "Enable Line X" checkbox.

Volatility Cone Forecaster Lite [PhenLabs]📊 Volatility Cone Forecaster
Version: PineScript™v6
📌Description
The Volatility Cone Forecaster (VCF) is an advanced indicator designed to provide traders with a forward-looking perspective on market volatility. Instead of merely measuring past price fluctuations, the VCF analyzes historical volatility data to project a statistical “cone” that outlines a probable range for future price movements. Its core purpose is to contextualize the current market environment, helping traders to anticipate potential shifts from low to high volatility periods (and vice versa). By identifying whether volatility is expanding or contracting relative to historical norms, it solves the critical problem of preparing for significant market moves before they happen, offering a clear statistical edge in strategy development.
This indicator moves beyond lagging measures by employing percentile analysis to rank the current volatility state. This allows traders to understand not just what volatility is, but how significant it is compared to the recent past. The VCF is built for discretionary traders, system developers, and options strategists who need a sophisticated understanding of market dynamics to manage risk and identify high-probability opportunities.
🚀Points of Innovation
Forward-Looking Volatility Projection: Unlike standard indicators that only show historical data, the VCF projects a statistical cone of future volatility.
Percentile-Based Regime Analysis: Ranks current volatility against historical data (e.g., 90th, 75th percentiles) to provide objective context.
Automated Regime Detection: Automatically identifies and labels the market as being in a ‘High’, ‘Low’, or ‘Normal’ volatility regime.
Expansion & Contraction Signals: Clearly indicates whether volatility is currently increasing or decreasing, signaling shifts in market energy.
Integrated ATR Comparison: Plots an ATR-equivalent volatility measure to offer a familiar point of reference against the statistical model.
Dynamic Visual Modeling: The cone visualization directly on the price chart provides an intuitive guide for future expected price ranges.
🔧Core Components
Realized Volatility Engine: Calculates historical volatility using log returns over multiple user-defined lookback periods (short, medium, long) for a comprehensive view.
Percentile Analysis Module: A custom function calculates the 10th, 25th, 50th, 75th, and 90th percentiles of volatility over a long-term lookback (e.g., 252 days).
Forward Projection Calculator: Uses the calculated volatility percentiles to mathematically derive and draw the upper and lower bounds of the future volatility cone.
Volatility Regime Classifier: A logic-based system that compares current volatility to the historical percentile bands to classify the market state.
🔥Key Features
Customizable Lookback Periods: Adjust short, medium, and long-term lookbacks to fine-tune the indicator’s sensitivity to different market cycles.
Configurable Forward Projection: Set the number of days for the forward cone projection to align with your specific trading horizon.
Interactive Display Options: Toggle visibility for percentile labels, ATR levels, and regime coloring to customize the chart display.
Data-Rich Information Table: A clean, on-screen table displays all key metrics, including current volatility, percentile rank, regime, and trend.
Built-in Alert Conditions: Set alerts for critical events like volatility crossing the 90th percentile, dropping below the 10th, or switching between expansion and contraction.
🎨Visualization
Volatility Cone: Shaded bands projected onto the future price axis, representing the probable price range at different statistical confidence levels (e.g., 75th-90th percentile).
Color-Coded Volatility Line: The primary volatility plot dynamically changes color (e.g., red for high, green for low) to reflect the current volatility regime, providing instant context.
Historical Percentile Bands: Horizontal lines plotted across the indicator pane mark the key percentile levels, showing how current volatility compares to the past.
On-Chart Labels: Clear labels automatically display the current volatility reading, its percentile rank, the detected regime, and trend (Expanding/Contracting).
📖Usage Guidelines
Setting Categories
Short-term Lookback: Default: 10, Range: 5-50. Controls the most sensitive volatility calculation.
Medium-term Lookback: Default: 21, Range: 10-100. The primary input for the current volatility reading.
Long-term Lookback: Default: 63, Range: 30-252. Provides a baseline for long-term market character.
Percentile Lookback Period: Default: 252, Range: 100-1000. Defines the period for historical ranking; 252 represents one trading year.
Forward Projection Days: Default: 21, Range: 5-63. Determines how many bars into the future the cone is projected.
✅Best Use Cases
Breakout Trading: Identify periods of deep consolidation when volatility falls to low percentile ranks (e.g., below 25th) and begins to expand, signaling a potential breakout.
Mean Reversion Strategies: Target trades when volatility reaches extreme high percentile ranks (e.g., above 90th), as these periods are often unsustainable and lead to contraction.
Options Strategy: Use the cone’s projected upper and lower bounds to help select strike prices for strategies like iron condors or straddles.
Risk Management: Widen stop-losses and reduce position sizes when the indicator signals a transition into a ‘High’ volatility regime.
⚠️Limitations
Probabilistic, Not Predictive: The cone represents a statistical probability, not a guarantee of future price action. Extreme, unpredictable news events can drive prices outside the cone.
Lagging by Nature: All calculations are based on historical price data, meaning the indicator will always react to, not pre-empt, market changes.
Non-Directional: The indicator forecasts the *magnitude* of future moves, not the *direction*. It should be paired with a directional analysis tool.
💡What Makes This Unique
Forward Projection: Its primary distinction is projecting a data-driven, statistical forecast of future volatility, which standard oscillators do not do.
Contextual Analysis: It doesn’t just provide a number; it tells you what that number means through percentile ranking and automated regime classification.
🔬How It Works
1. Data Calculation:
The indicator first calculates the logarithmic returns of the asset’s price. It then computes the annualized standard deviation of these returns over short, medium, and long-term lookback periods to generate realized volatility readings.
2. Percentile Ranking:
Using a 252-day lookback, it analyzes the history of the medium-term volatility and determines the values that correspond to the 10th, 25th, 50th, 75th, and 90th percentiles. This builds a statistical map of the asset’s volatility behavior.
3. Cone Projection:
Finally, it takes these historical percentile values and projects them forward in time, calculating the potential upper and lower price bounds based on what would happen if volatility were to run at those levels over the next 21 days.
💡Note:
The Volatility Cone Forecaster is most effective on daily and weekly charts where statistical volatility models are more reliable. For lower timeframes, consider shortening the lookback periods. Always use this indicator as part of a comprehensive trading plan that includes other forms of analysis.

FluidFlow OscillatorFluidFlow Oscillator: Study Material for Traders
Overview
The FluidFlow Oscillator is a custom technical indicator designed to measure price momentum and market flow dynamics by simulating fluid motion concepts such as velocity, viscosity, and turbulence. It helps traders identify potential buy and sell signals along with trend strength, momentum direction, and volatility conditions.
This study explains the underlying calculation concepts, signal logic, visual cues, and how to interpret the professional dashboard table that summarizes key indicator readings.
________________________________________
How the FluidFlow Oscillator Works
Core Mechanisms
1. Price Flow Velocity
o Measures the rate of change of price over a specified flow length (default 40 bars).
o Calculated as a percentage change of closing price: roc=close−closelen_flowcloselen_flow×100\text{roc} = \frac{\text{close} - \text{close}_{len\_flow}}{\text{close}_{len\_flow}} \times 100roc=closelen_flowclose−closelen_flow×100
o Smoothed by an EMA (Exponential Moving Average) to reduce noise, generating a "flow velocity" value.
2. Viscosity Factor
o Analogous to fluid viscosity, it adjusts the flow velocity based on recent price volatility.
o Volatility is computed as the standard deviation of close prices over the flow length.
o The viscosity acts as a damping factor to slow down the flow velocity in highly volatile conditions.
o This results in a "flow with viscosity" value, that smooths out the velocity considering market turbulence.
3. Turbulence Burst
o Captures sudden changes or bursts in the flow by measuring changes between successive viscosity-adjusted flows.
o The turbulence value is a smoothed absolute change in flow.
o A burst boost factor is added to the oscillator to incorporate this rapid change component, amplifying signals during sudden shifts.
4. Oscillator Calculation
o The raw oscillator value is the sum of flow with viscosity plus burst boost, scaled by 10.
o Clamped between -100 and +100 to limit extremes.
o Finally, smoothed again by EMA for cleaner visualization.
________________________________________
Signal Logic
The oscillator works with complementary components to produce actionable signals:
• Signal Line: An EMA-smoothed version of the oscillator for generating crossover-based signals.
• Momentum: The rate of change of the oscillator itself, smoothed by EMA.
• Trend: Uses fast (21-period EMA) and slow (50-period EMA) moving averages of price to identify market trend direction (uptrend, downtrend, or sideways).
Signal Conditions
• Bullish Signal (Buy): Oscillator crosses above the oversold threshold with positive momentum.
• Bearish Signal (Sell): Oscillator crosses below the overbought threshold with negative momentum.
Statuses
The oscillator provides descriptive market states based on level and momentum:
• Overbought
• Oversold
• Buy Signal
• Sell Signal
• Bullish / Bearish (momentum-driven)
• Neutral (no clear trend)
________________________________________
Color System and Visualization
The oscillator uses a sophisticated HSV color model adapting hues according to:
• Oscillator value magnitude and sign (positive or negative)
• Acceleration of oscillator changes
• Smooth color gradients to facilitate intuitive understanding of trend strength and momentum shifts
Background colors highlight overbought (red tint) and oversold (green tint) zones with transparency.
________________________________________
How to Understand the Professional Dashboard Table
The FluidFlow Oscillator offers an integrated table at the bottom center of the chart. This dashboard summarizes critical indicator readings in 8 columns across 3 rows:
Column Description
SIGNAL Current signal status (e.g., Buy, Sell, Overbought) with color coding
OSCILLATOR Current oscillator value (-100 to +100) with color reflecting intensity and direction
MOMENTUM Momentum bias indicating strength/direction of oscillator changes (Strong Up, Up, Sideways, Down, Strong Down)
TREND Current trend status based on EMAs (Strong Uptrend, Uptrend, Sideways, Downtrend, Strong Downtrend)
VOLATILITY Volatility percentage relative to average, indicating market activity level
FLOW Flow velocity value describing price momentum magnitude and direction
TURBULENCE Turbulence level indicating sudden bursts or spikes in price movement
PROGRESS Oscillator's position mapped as a percentage (0% to 100%) showing proximity to extreme levels
Rows Explained
• Row 1 (Header): Labels for each metric.
• Row 2 (Values): Current numerical or descriptive values color-coded along a professional scheme:
o Green or lime tones indicate positive or bullish conditions.
o Red or orange tones indicate caution, sell signals, or bearish conditions.
o Blue tones indicate neutral or stable conditions.
• Row 3 (Status Indicators): Emoji-like icons and bars provide a quick visual gauge of each metric's intensity or signal strength:
o For example, "🟢🟢🟢" suggests very strong bullish momentum, while "🔴🔴🔴" suggests strong bearish momentum.
o Progress bar visually demonstrates oscillator movement toward oversold or overbought extremes.
________________________________________
Practical Interpretation Tips
• A Buy signal with green colors and strong momentum usually precedes upward price moves.
• An Overbought status with red background and red table colors warns of potential price corrections or reversals.
• Watch the Turbulence to gauge market instability; spikes may precede price shocks or volatility bursts.
• Confirm signals with the Trend and Momentum columns to avoid false entries.
• Use the Progress bar to anticipate oscillations approaching key threshold levels for timing trades.
________________________________________
Alerts
The oscillator supports alerts for:
• Buy and sell signals based on oscillator crossovers.
• Overbought and oversold levels reached.
These help traders automate awareness of important market conditions.
________________________________________
Disclaimer
The FluidFlow Oscillator and its signals are for educational and informational purposes only. They do not guarantee profits and should not be considered as financial advice. Always conduct your own research and use proper risk management when trading. Past performance is not indicative of future results.
________________________________________
This detailed explanation should help you understand the workings of the FluidFlow Oscillator, its components, signal logic, and how to analyze its professional dashboard for informed trading decisions.

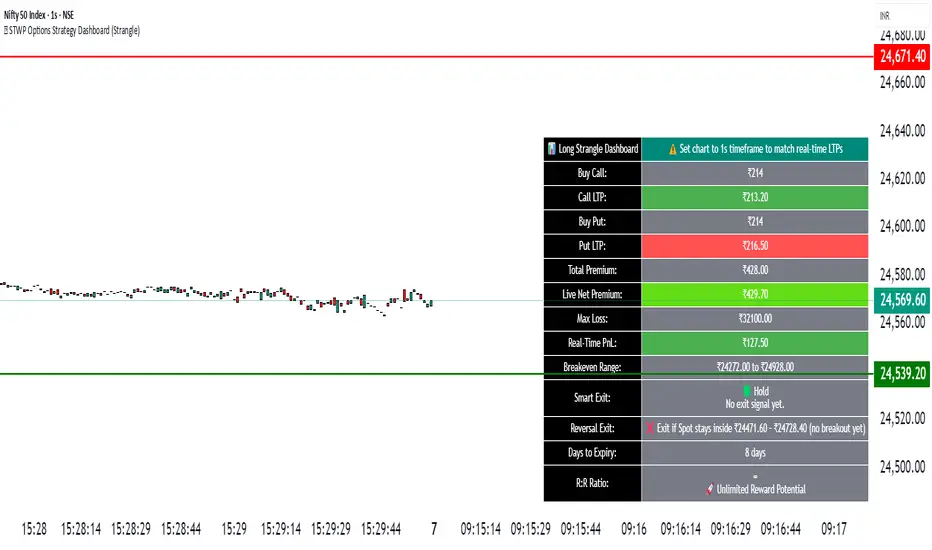
🧠 STWP Options Strategy Dashboard (Strangle)________________________________________
🧠 STWP Options Strategy Dashboard (Long/Short Strangle)
Author: simpletradewithpatience
Markets: NSE (India)
Best timeframe: 1-second chart
Built with: Pine Script v5
________________________________________
📌 Overview
A real-time options strategy dashboard tailored for NSE Strangles:
✅ Long Strangle → Buy OTM CE + Buy OTM PE
✅ Short Strangle → Sell OTM CE + Sell OTM PE
This tool offers a tick-by-tick visual dashboard to monitor:
Live premiums, PnL, breakeven levels, expiry decay, and Greeks.
It is designed **for manual use only** — no trade automation.
Ideal for strategy tracking, education, and decision support.
________________________________________
📌 Key Features
✅ Long & Short Strangle support
✅ Real-time tracking of CE & PE legs (LTPs, PnL, Premium)
✅ Max Loss / Profit calculator
✅ Breakeven range calculator
✅ Risk:Reward verdict (dynamic logic)
✅ Smart Exit logic with trade-specific warnings
✅ Reversal Exit logic based on spot compression
✅ Optional manual Greeks input (Delta, Gamma, Theta, IV)
✅ Greek-based bias: Bullish / Bearish / Neutral
✅ Days to Expiry (DTE) calculator
✅ Clean dashboard UI (emoji-labeled)
✅ Built for Indian NSE Options
✅ Designed to run on **1-second chart only**
________________________________________
📌 Option Symbol Inputs (LTP Tracking)
✅ Call Symbol: OTM CE (above spot)
✅ Put Symbol: OTM PE (below spot)
🎯 Symbol Tips: Use NSE format like `NSE:RELIANCE25JUL3050CE` and `PE`
⚠️ Valid option symbols are critical for accurate PnL tracking
________________________________________
📌 Strategy Parameters
- Call & Put Strike Prices
- Buy/Sell Premiums for both legs
- Lot Size & Number of Lots
- Loss Bearable Amount (₹)
- Expiry Date & Time (used for DTE tracking)
________________________________________
📌 Smart Exit Logic
🧠 A dynamic assistant that checks:
✅ Profit Target Hit
❌ Loss Threshold Breach
⏳ Expiry nearing with no breakout
🟡 Partial Profit Zone
📉 Guides the trader to avoid emotional decisions.
All messages are suggestive only — no trade recommendations.
________________________________________
📌 Reversal Exit Logic (Strangle Specific)
🔁 Detects if spot is trapped between the call/put strikes
➡️ If no breakout from the average strike zone, exit is suggested
⚠️ Helps prevent theta decay trap in Long Strangles
________________________________________
📌 Greeks (Optional Input)
🔹 Manual input for Delta, Gamma, Theta, and IV for both legs
🔍 Dashboard shows:
- Net Delta: Directional Bias
- Net Gamma: Volatility Risk
- Net Theta: Time Decay Risk
- Avg IV: Vol Crush or Low IV Warning
- Verdict: 🟢 Strong / 🟡 Moderate / ❌ Risky
________________________________________
📌 Dashboard Display
📈 Strategy Type: Long or Short Strangle
💹 Call & Put Premiums (Entry vs LTP)
📊 Total Net Premium
📉 Real-time PnL
📐 Breakeven Range (Lower & Upper)
🧠 Smart Exit verdict
🔁 Reversal Exit guidance
📆 Days to Expiry (DTE)
📊 R:R Ratio & Quality Verdict
📐 Greeks Summary + Risk Flags (if enabled)
________________________________________
⚠️ Important Notes
✅ Built for NSE Options only
✅ Designed for Long/Short Strangle strategies
✅ Use on 1-second chart only
❌ Will not function correctly on higher timeframes
✅ This is a manual dashboard — **no orders or automation**
✅ For educational, research, and tracking use only
❌ Not financial advice or a trading recommendation
________________________________________
💬 How to Use This Dashboard
1️⃣ Choose your strategy: Long or Short Strangle
2️⃣ Enter valid CE & PE symbols (OTM strikes)
3️⃣ Fill in strike prices and premiums (Buy/Sell)
4️⃣ Optionally enter Greeks (Delta, Gamma, etc.)
5️⃣ Set your expiry date
6️⃣ Monitor PnL, risk zones, exit suggestions
7️⃣ Use alerts (if enabled) for major thresholds
________________________________________
🤝 Final Note
This tool was built with patience and care by simpletradewithpatience to help fellow options traders trade more objectively, systematically, and confidently.
Feel free to share feedback on Tradingview.
Happy Trading! 📈
Stay disciplined. Stay smart.
________________________________________
🔠 Glossary
PnL – Profit & Loss
LTP – Last Traded Price
IV – Implied Volatility
DTE – Days to Expiry
ROI – Return on Investment
R:R – Risk to Reward Ratio
CE / PE – Call / Put Option
SEBI – Securities and Exchange Board of India
________________________________________
⚠️ Disclaimer
This script is for educational and research purposes only.
I am not a SEBI-registered advisor.
No buy or sell recommendations are made.
Trading options involves significant risk.
Use proper risk management and always consult a licensed advisor if in doubt.
The author is not responsible for any financial losses incurred.
By using this tool, you agree to these terms.
________________________________________
Option CalculatorOption Calculator – Comprehensive Feature Guide
The aiTrendview Option Calculator is a feature-rich options trading dashboard built using Pine Script, designed for real-time market interpretation and strategy selection. It integrates Black-Scholes-based pricing models with dynamic market inputs to help traders evaluate directional bias, volatility, risk, and potential profitability in a structured, intuitive format. The tool supports both beginner and experienced options traders in making data-driven decisions.
Core Inputs and Pricing Foundations
Users can input the strike price, days to expiration, implied volatility (IV), interest rate, and option type (call or put). These values feed directly into calculations for the option's theoretical price, Greeks, and expected move. For example:
• Strike Price helps define moneyness, impacting delta and risk/reward balance.
• Days to Expiry determines the speed of time decay (theta).
• Risk-Free Rate adjusts for time value and interest rate impact (rho).
• Implied Volatility affects premium pricing and vega exposure.
• Option Type sets the directional foundation for strategy analysis.
Live Market Data Integration
The script pulls current underlying price, price change, and volume comparison against a moving average (e.g., current volume vs. 20-day average). This helps identify unusual trading activity or volume spikes. Volatility readings are also incorporated using ATR or external volatility indexes to enhance the realism of IV assessments.
Greek Calculations
The dashboard provides visual and numerical values for all five major Greeks:
• Delta shows directional sensitivity and is plotted with a visual bar.
• Gamma represents the rate of delta change, especially critical near-the-money.
• Theta measures time decay and is most impactful in the final weeks before expiration.
• Vega tracks sensitivity to volatility shifts, crucial for premium-selling strategies.
• Rho reflects sensitivity to interest rates, primarily relevant in long-dated options.
Each Greek is calculated based on real-time inputs, providing a statistical framework for assessing risk and return.
Market Sentiment & Risk Environment
A sentiment scoring system interprets the put-call ratio (PCR), volume trends, and price momentum (e.g., RSI). IV levels are color-coded (e.g., low, medium, high) to identify whether options are relatively cheap or expensive. These values support better timing decisions and help identify whether to be a buyer or seller of premium.
Strategy Recommendation Engine
The script dynamically evaluates six core strategies based on current data:
1. Long Call
2. Short Put
3. Long Put
4. Bull Call Spread
5. Long Straddle
6. Iron Butterfly
Each strategy is assigned a confidence score (0–100%) and updated in real-time. This system is designed to match the appropriate strategy to market conditions such as trend, volatility, and time to expiration.
Risk-Adjusted Trading Insights
The dashboard helps traders evaluate whether to initiate trades, reduce exposure, or wait:
• High Confidence (80%+): Favorable environment; standard sizing recommended.
• Moderate Confidence (60–80%): Trade with caution and reduced risk.
• Low Confidence (<60%): Consider avoiding the trade or waiting for better setup.
It also supports risk mitigation through defined-risk strategies and provides guidance on stop-loss, profit targets, and time-based exits (e.g., managing options with <21 days to expiry).
Real-Time Monitoring
The script continuously tracks:
• Changes in Greeks as price, volatility, or time evolve.
• Profit probability estimates using expected move and breakeven pricing.
• Volume activity and IV rank to spot institutional behavior.
This empowers traders to manage trades proactively, adjust exposure, or lock in profits based on changing market conditions.
Practical Use Case Flow
Step 1: Input Setup
Enter option-specific parameters (strike, expiry days, IV, etc.) and let the dashboard auto-calculate risk metrics.
Step 2: Analyze Market
Use sentiment analysis, IV level, and volume data to understand the environment.
Step 3: Select Strategy
Rely on the confidence score and recommendation engine to choose a suitable options strategy.
Step 4: Manage Risk
Apply size rules based on signal strength, adjust based on exposure, and set alerts if needed.
Step 5: Monitor Outcomes
Track Greeks, probability, and progress metrics to stay informed throughout the trade.
Trading Environment Adaptation
• Low IV: Favor long premium strategies (e.g., long straddles, long calls).
• High IV: Favor premium selling strategies (e.g., iron condors, credit spreads).
• Bullish Markets: Focus on call-based trades or bullish spreads.
• Sideways Markets: Use neutral setups like iron butterflies or calendar spreads.
Position sizing and stop-loss logic are aligned with industry practices (e.g., risk no more than 2% per trade, take profit at 50%, and cut losses at double the premium received).
Dashboard Interpretation Guide
• Green: High confidence strategy, favourable IV, and strong volume confirmation.
• Yellow: Mixed signals or moderate conviction – proceed with caution.
• Red: Low confidence, poor conditions – better to wait for clearer opportunities.
Disclaimer from aiTrendview
This script is intended for educational and informational use only. It does not offer financial advice or trading signals, nor does it guarantee results. aiTrendview and its affiliates are not responsible for any financial loss or decision made using this tool. Options trading involves substantial risk and is not suitable for all investors. Past performance of any strategy or metric does not guarantee future results. Users are encouraged to consult with a certified financial advisor and conduct independent research before making trading decisions.

🧠 Options Strategy Dashboard (Straddle)________________________________________
🧠 STWP Options Strategy Dashboard (Long/Short Straddle)
Author: simpletradewithpatience
Markets: NSE (India)
Best timeframe: 1-second chart
Built with: Pine Script v5
________________________________________
📌 Overview
A real-time options strategy dashboard designed for NSE Straddles:
✅ Long Straddle → Buy ATM CE + Buy ATM PE
✅ Short Straddle → Sell ATM CE + Sell ATM PE
This tool provides a visual, tick-by-tick dashboard for monitoring:
Live premiums, real-time PnL, ROI, Greeks, and risk conditions — all in one screen.
It’s fully manual and built for educational & tracking purposes only — not for automation.
________________________________________
📌 Key Features
✅ Track Long & Short Straddles
✅ Live LTP tracking via dual symbol inputs
✅ Real-time PnL, breakeven, max profit/loss
✅ ROI & Risk:Reward calculation
✅ Smart Exit logic with context-based alerts
✅ Invalidation logic via Reversal Range breach
✅ Manual input of Greeks (Delta, Gamma, Theta, IV%)
✅ Greek-based warnings: Gamma Risk, IV Crush, Theta Decay
✅ Days to Expiry (DTE) tracking
✅ Fully customizable alert system
✅ Clean emoji-labelled dashboard UI
✅ Built for Indian NSE Options
✅ Requires 1-second chart for correct functioning
________________________________________
📌 Option Symbol Inputs (LTP Tracking)
✅ Call Symbol: ATM CE (same strike as Put)
✅ Put Symbol: ATM PE (same strike as Call)
✅ Symbol Tips: Use Tradingview dropdown to select NSE option symbols like NSE:RELIANCE25JUL3000CE and PE
⚠️ Providing valid option symbols is essential — all live data relies on them.
________________________________________
📌 Trade Setup Parameters
Spot Price at Entry
Strike Price (same for both legs)
Buy Price (for Long Straddle)
Sell Price (for Short Straddle)
Lot Size & Number of Lots
Loss Bearable Amount (₹) → Used by Smart Exit logic to trigger warnings
________________________________________
📌 Expiry Date Input
Expiry Year, Month, and Day
🎯 Used to calculate Days to Expiry (DTE) and enable:
⏱️ Expiry alerts like “Less than 2 Days”, “Theta Risk”, etc.
📉 Smart Exit logic dynamically adapts based on DTE
________________________________________
📌 Greeks (Optional)
🔹 Default: Leave Greeks empty
🔹 Optional: Input Delta, Gamma, Theta, IV for both Call & Put
🔍 Enables:
Net Delta, Gamma, Theta, IV
Greek-based alerts and visual verdict
🟢 Conservative 🟡 Moderate 🔴 Aggressive Risk
________________________________________
📌 Dashboard Display
📈 Strategy Type: Long or Short Straddle
💹 Entry Premiums & Live Net LTP
📊 Net Premium, Max Profit/Loss
📉 Real-time PnL (tick-level)
📐 Breakeven range
📊 ROI %, Risk:Reward & trade verdict
🚦 Smart Exit verdict: Hold, Exit Soon, or Book Loss
🔁 Reversal Range for invalidation
📆 Days to Expiry (DTE)
📐 Greek Data (if enabled) with Net & Avg values
⚠️ Greek Risk Verdict for managing directional exposure
________________________________________
📌 Alert System (Built-in Alerts)
🎯 Target Profit Hit
❌ Max Loss Reached
🛑 Loss Bearable Limit Breached
📍 Hold Signal
📉 Book Loss / Exit Soon
⏳ Expiry Nearing
⚠️ Reversal Breach (spot breaks outside expected range)
💥 High Gamma Risk (> ±0.05)
📉 High IV Alert (> 35%)
🚨 Combined Master Alert — if any key risk triggers
________________________________________
📌 Smart Exit System
⚙️ A dynamic, context-aware trade assistant
✅ Assesses price movement, expiry risk, and loss thresholds
✅ Provides real-time exit suggestions to prevent overholding
✅ Filters emotional decisions — encourages disciplined trading
________________________________________
📌 Reversal Exit Logic (For Straddles)
🔁 Detects directional invalidation
Reversal Range = ±35% of Total Premium around strike price
⚠️ If spot breaches this range, trade likely invalid — exit advised
📉 Works as directional filter for neutral strategies
________________________________________
⚠️ Important Notes
✅ Built for NSE Options – not suitable for other exchanges
✅ Designed only for Long/Short Straddles
✅ Use on 1-second chart only
❌ Will malfunction on higher timeframes
✅ For manual use only — no automation
✅ For educational and research use only
________________________________________
💬 How to Use This Dashboard
1️⃣ Select Strategy
Long Straddle (Buy Both Legs) or Short Straddle (Sell Both Legs)
2️⃣ Input Symbols
Use accurate NSE symbols for CE & PE
3️⃣ Enter Strike & Premiums
Same strike for both legs. Add Buy or Sell prices
4️⃣ (Optional) Enter Greeks
Add Delta, Gamma, Theta, IV for both legs
5️⃣ Set Expiry
Year, Month, Day — enables DTE alerts
6️⃣ Track Dashboard
Live PnL, Net Premium, ROI, Reversal Range, Smart Exit
7️⃣ Enable Alerts
Get push/email/sound notifications for PnL, expiry, and Greek risks
________________________________________
🤝 Final Note
This tool was built with patience and care by simpletradewithpatience to help fellow options traders trade more objectively, systematically, and confidently.
Feel free to share feedback on Tradingview.
Happy Trading! 📈
Stay disciplined. Stay smart.
________________________________________
🔠 Glossary
PnL – Profit & Loss
LTP – Last Traded Price
IV – Implied Volatility
DTE – Days to Expiry
ROI – Return on Investment
R:R – Risk to Reward Ratio
CE / PE – Call / Put Option
SEBI – Securities and Exchange Board of India
________________________________________
⚠️ Disclaimer
This script is for educational and research purposes only.
I am not a SEBI-registered advisor.
No buy or sell recommendations are made.
Trading options involves significant risk.
Use proper risk management and always consult a licensed advisor if in doubt.
The author is not responsible for any financial losses incurred.
By using this tool, you agree to these terms.
________________________________________

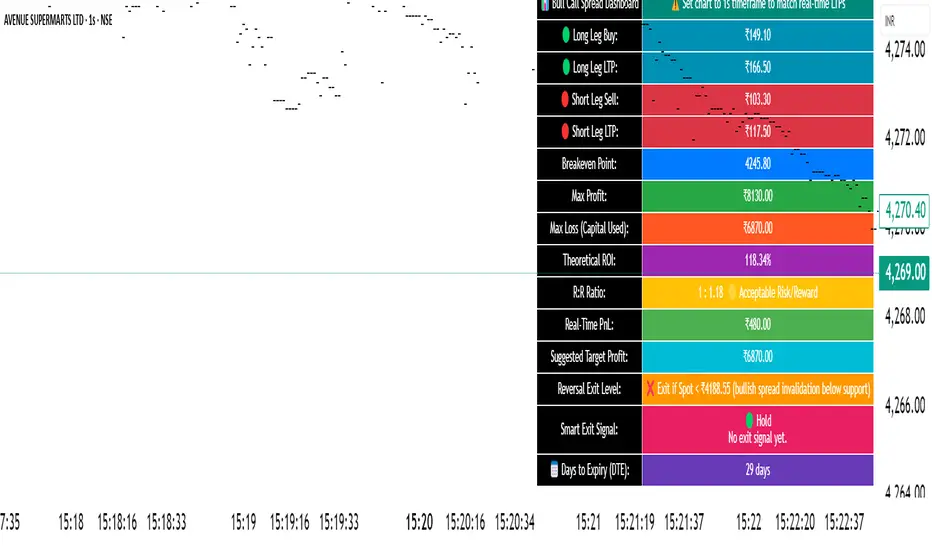
🧠 STWP Dashboard (Bull Call Spread / Bear Put Spread)________________________________________
🧠 STWP Options Strategy Dashboard (Bull Call Spread/ Bear Put Spread)
Author: @simpletradewithpatience
Markets: NSE (India)
Best timeframe: 1-second chart
Built with: Pine Script v5
________________________________________
📌 Overview
A real-time options strategy dashboard tailored for NSE traders, designed for two-leg spreads:
✅ Bull Call Spread → Buy Lower Strike CE, Sell Higher Strike CE
✅ Bear Put Spread → Buy Higher Strike PE, Sell Lower Strike PE
This tool gives you a real-time, color-coded visual interface with:
Entry premiums & breakeven levels
Live LTPs & PnL
ROI & Risk: Reward
Smart Exit logic
Alerts for expiry, Greeks, and PnL events
It’s fully manual, for educational and tracking use only — not for automated trading.
________________________________________
📌 Key Features
✅ Track Bull Call & Bear Put Spreads
✅ Live LTP tracking via symbol input
✅ Real-time PnL, breakeven, max profit/loss
✅ ROI & Risk:Reward calculation
✅ Smart Exit logic with trade verdicts
✅ Invalidation logic with Reversal Exit
✅ Manual input of Greeks (Delta, Gamma, Theta, IV%)
✅ Greek-based alerts for Gamma Risk, IV Crush, Theta Decay
✅ Days to Expiry (DTE) tracking
✅ Fully customizable alert system
✅ Clean, emoji-labelled dashboard UI
✅ Built for Indian NSE options only
✅ Requires 1-second chart for correct data
________________________________________
📌 Option Symbol Inputs (LTP Tracking)
✅ Long Leg Symbol (Buy): Lower strike CE (Bull Call) or higher strike PE (Bear Put)
✅ Short Leg Symbol (Sell): Higher strike CE (Bull Call) or lower strike PE (Bear Put)
✅ Symbol Tips: Use TradingView's dropdown to select NSE option symbols like NSE:RELIANCE25JUL3000CE
⚠️ Providing valid option symbols is crucial — it powers all live tracking and calculations.
________________________________________
📌 Trade Setup Parameters
Spot Price at Entry
Long & Short Strike Prices
Buy Price (Long Leg)
Sell Price (Short Leg)
Lot Size & Number of Lots
Loss Bearable Amount (₹) → Used by Smart Exit logic to issue early warnings
________________________________________
📌 Expiry Date Input
Expiry Year, Month, and Day
🎯 Used to calculate Days to Expiry (DTE) and enable:
⏱️ Expiry alerts like “Less than 2 Days”, “Theta Risk”, and more
📉 Smart Exit logic adjusts based on time decay
________________________________________
📌 Greeks (Optional)
🔹 Default Mode: Don’t Enter Greeks
🔹 Optional Mode: Enter Greeks for both legs (Delta, Gamma, Theta, IV%)
🔍 Enabling Greeks unlocks:
Net Delta, Gamma, Theta, IV
Greek-based warnings (e.g. Gamma Risk, Theta Risk)
A dashboard Greek Verdict:
🟢 Conservative 🟡 Moderate Risk 🔴 Aggressive Risk
________________________________________
📌 Dashboard Display
🎯 Strategy Type (Bull or Bear Spread)
📈 Entry Premiums & Live LTPs
💹 Breakeven, Max Profit/Loss, Net Premium
📊 ROI % & Risk:Reward (with verdict)
📉 Real-time PnL using tick-by-tick data
🚦 Smart Exit verdict: Hold, Exit Soon, or Book Profit
🔁 Reversal Exit Price (spread invalidation logic)
📆 Days to Expiry (DTE)
📐 Greek Data (if enabled) with Net & Average values
⚠️ Greek Risk Verdict for managing directional risk
________________________________________
📌 Alert System (Built-in Alerts)
🎯 Target Profit Hit
❌ Max Loss Reached
🛑 Loss Bearable Limit Breached
📍 Hold Signal
📉 Book Loss / Exit Soon
⏳ Expiry Nearing
⚠️ Spread Invalidation Alert (via Reversal Price breach)
💥 High Gamma Risk (if Gamma > ±0.05)
📉 High IV Alert (if IV > 35%)
🚨 Combined Master Alert – fires if any key condition is triggered
________________________________________
📌 Smart Exit System
⚙️ Context-aware, dynamic trade assistant
✅ Analyses real-time market, PnL, expiry risk, reversal risk
✅ Gives exit suggestions based on:
Time decay
Price invalidation
Breach of defined loss/profit thresholds
✅ Keeps you objective — no emotional exits
________________________________________
📌 Reversal Exit Logic
🔁 Detects directional failure in spread structure
Bull Call Spread: Invalidation = Spot falls 25% of net premium below long strike
Bear Put Spread: Invalidation = Spot rises 25% of net premium above short strike
📉 Alerts you to exit even before loss appears
🎯 Designed for directional traders using spread logic
💡 Acts as a breakdown or breakout filter
________________________________________
⚠️ Important Notes
✅ Built for NSE Options – not for global exchanges
✅ Only for Bull Call & Bear Put spreads
✅ Use on 1-second chart only
❌ Will not work properly on higher timeframes
✅ Manual tool only – doesn’t place trades
✅ For educational and research use only
________________________________________
💬 How to Use This Dashboard
Choose Your Strategy
Bull Call or Bear Put
Input Symbols & Strikes
Use Tradingview dropdown to select accurate NSE option symbols
Enter Buy/Sell Prices
Add premiums, lot size, no. of lots
(Optional) Enable Greeks
Add Delta, Gamma, Theta, IV for both legs
Set Expiry Date
Year, Month, Day — activates DTE & expiry alerts
Monitor Dashboard
Live PnL, Max P/L, ROI, R:R, Smart Exit, Reversal Levels
(Optional) Enable Alerts
Get notified for PnL events, expiry risk, Greek risk, spread failure
________________________________________
🤝 Final Note
This tool was built with patience and care by @simpletradewithpatience to help fellow options traders trade more objectively, systematically, and confidently.
Feel free to share feedback on Tradingview.
Happy Trading! 📈
Stay disciplined. Stay smart.
________________________________________
🔠 Glossary
PnL – Profit & Loss
LTP – Last Traded Price
IV – Implied Volatility
DTE – Days to Expiry
ROI – Return on Investment
R:R – Risk to Reward Ratio
CE / PE – Call / Put Option
SEBI – Securities and Exchange Board of India
________________________________________
⚠️ Disclaimer
This script is for educational and research purposes only.
I am not a SEBI-registered advisor.
No buy or sell recommendations are made.
Trading options involves significant risk.
Use proper risk management and always consult a licensed advisor if in doubt.
The author is not responsible for any financial losses incurred.
By using this tool, you agree to these terms.
________________________________________
Simulated OI Proxy with Trend Table1. In Simple Terms
This script mimics open interest analysis using price and volume changes.
It visually marks possible bullish and bearish setups directly on your price chart.
It’s especially useful for markets where real OI data is not available (like Indian stocks)
=======================================================================
2. Calculating Price and Volume Changes
close - close: Calculates the change in closing price from the previous bar to the current bar.
volume - volume: Calculates the change in trading volume from the previous bar to the current bar.
Purpose:
These calculations help determine if price and volume are increasing or decreasing, which is used as a proxy for open interest (OI) since real OI data may not be available.
===================================================================
3. Proxy Logic for OI Signals
long_buildup: Both price and volume are rising. This suggests new buying interest (bullish signal).
short_buildup: Price is falling but volume is rising. This suggests new short positions are being opened (bearish signal).
short_covering: Price is rising but volume is falling. This suggests shorts are closing their positions, causing a price rise (cautiously bullish).
long_unwinding: Both price and volume are falling. This suggests long positions are being closed (cautiously bearish).
====================================================================
4. Plotting the Signals
plotshape(condition, ...): Draws a shape on the chart when the condition is true.
Long Buildup: Green triangle below the bar (bullish).
Short Buildup: Red triangle above the bar (bearish).
Short Covering: Blue circle below the bar (cautiously bullish).
Long Unwinding: Orange circle above the bar (cautiously bearish).
======================================================================
5. Signal Detection:
The script checks price and volume changes to determine which signal is active.
Trend Assignment:
It assigns a text label and color for the detected trend.
Table Display:
A table appears at the top-right of your chart, showing the current trend based on the latest bar.

Options Volatility Strategy Analyzer [TradeDots]The Options Volatility Strategy Analyzer is a specialized tool designed to help traders assess market conditions through a detailed examination of historical volatility, market benchmarks, and percentile-based thresholds. By integrating multiple volatility metrics (including VIX and VIX9D) with color-coded regime detection, the script provides users with clear, actionable insights for selecting appropriate options strategies.
📝 HOW IT WORKS
1. Historical Volatility & Percentile Calculations
Annualized Historical Volatility (HV): The script automatically computes the asset’s historical volatility using log returns over a user-defined period. It then annualizes these values based on the chart’s timeframe, helping you understand the asset’s typical volatility profile.
Dynamic Percentile Ranks: To gauge where the current volatility level stands relative to past behavior, historical volatility values are compared against short, medium, and long lookback periods. Tracking these percentile ranks allows you to quickly see if volatility is high or low compared to historical norms.
2. Multi-Market Benchmark Comparison
VIX and VIX9D Integration: The script tracks market volatility through the VIX and VIX9D indices, comparing them to the asset’s historical volatility. This reveals whether the asset’s volatility is outpacing, lagging, or remaining in sync with broader market volatility conditions.
Market Context Analysis: A built-in term-structure check can detect market stress or relative calm by measuring how VIX compares to shorter-dated volatility (VIX9D). This helps you decide if the present environment is risk-prone or relatively stable.
3. Volatility Regime Detection
Color-Coded Background: The analyzer assigns a volatility regime (e.g., “High Asset Vol,” “Low Asset Vol,” “Outpacing Market,” etc.) based on current historical volatility percentile levels and asset vs. market ratios. A color-coded background highlights the regime, enabling traders to quickly interpret the market’s mood.
Alerts on Regime Changes & Spikes: Automated alerts warn you about any significant expansions or contractions in volatility, allowing you to react swiftly in changing conditions.
4. Strategy Forecast Table
Real-Time Strategy Suggestions: At the close of each bar, an on-chart table generates suggested options strategies (e.g., selling premium in high volatility or buying premium in low volatility). These suggestions provide a quick summary of potential tactics suited to the current regime.
Contextual Market Data: The table also displays key statistics, such as VIX levels, asset historical volatility percentile, or ratio comparisons, helping you confirm whether volatility conditions warrant more conservative or more aggressive strategies.
🛠️ HOW TO USE
1. Select Your Timeframe: The script supports multiple timeframes. For short-term trading, intraday charts often reveal faster shifts in volatility. For swing or position trading, daily or weekly charts may be more stable and produce fewer false signals.
2. Check the Volatility Regime: Observe the background color and on-chart labels to identify the current regime (e.g., “HIGH ASSET VOL,” “LOW VOL + LAGGING,” etc.).
3. Review the Forecast Table: The table suggests strategy ideas (e.g., iron condors, long straddles, ratio spreads) depending on whether volatility is elevated, subdued, or spiking. Use these as a starting point for designing trades that match your risk tolerance.
4. Combine with Additional Analysis: For optimal results, confirm signals with your broader trading plan, technical tools (moving averages, price action), and fundamental research. This script is most effective when viewed as one component in a comprehensive decision-making process.
❗️LIMITATIONS
Directional Neutrality: This indicator analyzes volatility environments but does not predict price direction (up/down). Traders must combine with directional analysis for complete strategy selection.
Late or Missed Signals: Since all calculations require a bar to close, sharp intrabar volatility moves may not appear in real-time.
False Positives in Choppy Markets: Rapid changes in percentile ranks or VIX movements can generate conflicting or premature regime shifts.
Data Sensitivity: Accuracy depends on the availability and stability of volatility data. Significant gaps or unusual market conditions may skew results.
Market Correlation Assumptions: The system assumes assets generally correlate with S&P 500 volatility patterns. May be less effective for:
Small-cap stocks with unique volatility drivers
International stocks with different market dynamics
Sector-specific events disconnected from broad market
Cryptocurrency-related assets with independent volatility patterns
RISK DISCLAIMER
Options trading involves substantial risk and is not suitable for all investors. Options strategies can result in significant losses, including the total loss of premium paid. The complexity of options strategies requires thorough understanding of the risks involved.
This indicator provides volatility analysis for educational and informational purposes only and should not be considered as investment advice. Past volatility patterns do not guarantee future performance. Market conditions can change rapidly, and volatility regimes may shift without warning.
No trading system can guarantee profits, and all trading involves the risk of loss. The indicator's regime classifications and strategy suggestions should be used as part of a comprehensive trading plan that includes proper risk management, directional analysis, and consideration of broader market conditions.

5EMA_BB_ScalpingWhat?
In this forum we have earlier published a public scanner called 5EMA BollingerBand Nifty Stock Scanner , which is getting appreciated by the community. That works on top-40 stocks of NSE as a scanner.
Whereas this time, we have come up with the similar concept as a stand-alone indicator which can be applied for any chart, for any timeframe to reap the benifit of reversal trading.
How it works?
This is essentially a reversal/divergence trading strategy, based on a widely used strategy of Power-of-Stocks 5EMA.
To know the divergence from 5-EMA we just check if the high of the candle (on closing) is below the 5-EMA. Then we check if the closing is inside the Bollinger Band (BB). That's a Buy signal. SL: low of the candle, T: middle and higher BB.
Just opposite for selling. 5-EMA low should be above 5-EMA and closing should be inside BB (lesser than BB higher level). That's a Sell signal. SL: high of the candle, T: middle and lower BB.
Along with we compare the current bar's volume with the last-20 bar VWMA (volume weighted moving average) to determine if the volume is high or low.
Present bar's volume is compared with the previous bar's volume to know if it's rising or falling.
VWAP is also determined using `ta.vwap` built-in support of TradingView.
The Bolling Band width is also notified, along with whether it is rising or falling (comparing with previous candle).
What's special?
We love this reversal trading, as it offers many benifits over trend following strategies:
Risk to Reward (RR) is superior.
It _Does Hit_ stop losses, but the stop losses are tiny.
Means, althrough the Profit Factor looks Nahh , however due to superior RR, end of day it ended up in green.
When the day is sideways, it's difficult to trade in trending strategies. This sort of volatility, reversal strategies works better.
It's always tempting to go agaist the wind. Whole world is in Put/PE and you went opposite and enter a Call/CE. And turns out profitable! That's an amazing feeling, as a trader :)
How to trade using this?
* Put any chart
* Apply this screener from Indicators (shortcut to launch indicators is just type / in your keyboard).
* It will show you the Green up arrow when buy alert comes or red down arrow when sell comes. * Also on the top right it will show the latest signal with entry, SL and target.
Disclaimer
* This piece of software does not come up with any warrantee or any rights of not changing it over the future course of time.
* We are not responsible for any trading/investment decision you are taking out of the outcome of this indicator.

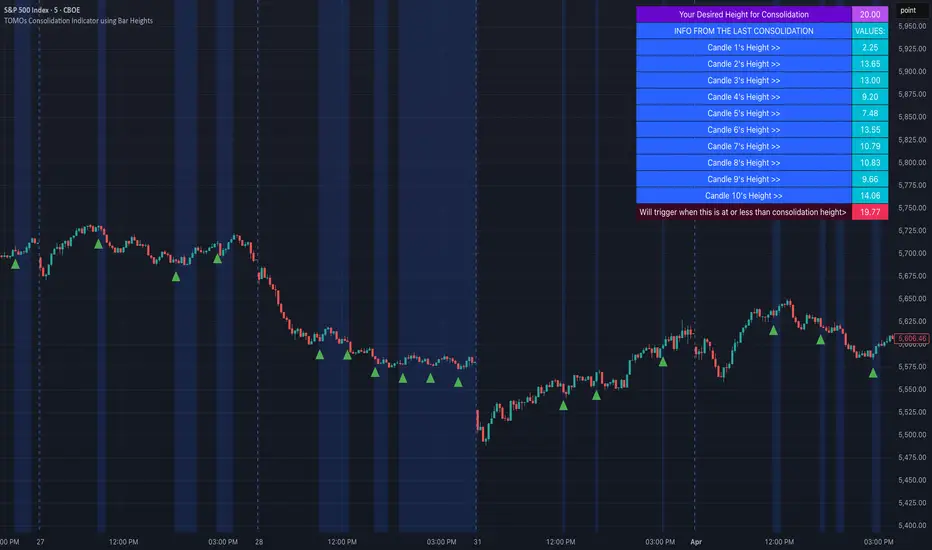
TOMOs Consolidation Indicator using Bar Heightswhat this is: This indicator creates an alert (see green arrow) when there are periods of consolidation in the chart. YOU define what consolidation means. It looks at BOTH candle heights (wicks included by default) AND checks the lowest and highest of those candles.
> Number of candles to check: you define how many candles you want to use to calculate consolidation. For instance, if you select 3 candles and you're on a 5-min chart, that's 15 mins of consolidation.
> Max Candle Height: You define what consolidation height or range is considered consolidation to you. So if you put in a value of 15. That means the last X number of candles are examined for whether OR NOT they are at or below that height. If they are, then it checks to see if the lowest and highest point among those candles are within that height as well. IF they are, then you see a green arrow. That is consolidation in this indicator. And you can use it for an alarm.
> the blue shade just means consolidation is continuing BEYOND the green-arrow when it was indicated. It's just a visual indicator. that's it.
> Include Wicks in Candle Height? Maybe you just want the body of the candle and not it's wicks. Your call.
Trigger Starts and stops: hour/min. This is ALL Eastern time (NYSE's time) and NOT your own timezone. You can simply tell the script you ONLY want the trigger alert to happen between the the start and end time. So if you're using it to trigger a trade, maybe you don't want to trigger it too early or late in the day.
Inputs in Status Line: This is tradingview default. I can't remove it.
Option Value/Time Value DifferenceThis indicator calculates and visualizes the difference between two option contracts (either their time value or option value) based on a user-selected underlying instrument (e.g., NIFTY 50). It fetches real-time data for the underlying and the two specified options, computes their intrinsic and time values, and plots either the time value or option value (ask price) along with their difference. A customizable table displays key details, including strike prices, option types (Call/Put), and the selected values, with a dark mode option for better visibility.
Key Features:
Flexible Plotting: Choose to plot and display either the Time Value (option price minus intrinsic value) or the Option Value (ask price) for two option strikes.
Difference Calculation: Plots the difference between the two options’ selected values (time value or option value) as a distinct line.
Dynamic Table: Shows strike prices, option types (CE/PE), and the selected values (time value or option value) for both options, plus their difference.
Dark Mode Support: Toggle between light and dark themes for the table display.
Real-Time Data: Uses TradingView’s request.security to fetch live prices for the underlying and options.
Use Case:
This script is ideal for options traders who want to compare two strikes (e.g., a Call and a Put, or two Calls/Puts at different strikes) and analyze their time value or option value differences in real-time. It’s particularly useful for strategies like spreads, straddles, or strangles.
How to Use
Add to Chart:
Open TradingView, go to the Pine Editor, paste this script, and click “Add to Chart.”
Configure Inputs:
Underlying Instrument: Enter the symbol of the underlying asset (e.g., NSE:NIFTY for NIFTY 50).
Option Instrument 1: Enter the symbol of the first option (e.g., NSE:NIFTY250327C24000 for a Call expiring March 27, 2025, at strike 24000).
Option Instrument 2: Enter the symbol of the second option (e.g., NSE:NIFTY250327C24500 for a Call at strike 24500).
Plot Type: Select either Time Value (default) or Option Value to determine what is plotted and displayed.
Dark Mode: Check this box to switch the table to a dark theme (default is light).
Interpret Outputs:
Chart Lines:
Blue Line: Value of the first option (time value or option value, based on selection).
Red Line: Value of the second option.
Purple Line: Difference between the two options’ values.
Table (Middle-Left Position):
Row 1: Strike price and type (CE/PE) of the first option.
Row 2: Strike price and type of the second option.
Row 3: Selected value (time value or option value) of the first option.
Row 4: Selected value of the second option.
Row 5: Difference between the two options’ values.
Adjust Settings:
Modify the input symbols or plot type via the indicator’s settings to suit your analysis needs.
Inputs
Underlying Instrument (Symbol, Default: NSE:NIFTY):
The ticker symbol of the underlying asset (e.g., NIFTY 50 index).
Option Instrument 1 (Symbol, Default: NSE:NIFTY250327C24000):
The ticker symbol of the first option contract. Must follow a format like NSE:NIFTY (e.g., Call at 24000).
Option Instrument 2 (Symbol, Default: NSE:NIFTY250327C24500):
The ticker symbol of the second option contract (e.g., Call at 24500).
Plot Type (String, Options: Time Value, Option Value, Default: Time Value):
Choose whether to plot and display the Time Value (option price minus intrinsic value) or the Option Value (ask price).
Dark Mode (Boolean, Default: false):
Enable for a dark-themed table; disable for a light theme.
Outputs
Plotted Lines:
Value 1 (Blue): Time value or option value of the first option, depending on the Plot Type.
Value 2 (Red): Time value or option value of the second option.
Difference (Purple): The difference between Value 1 and Value 2 (e.g., Time Value 1 - Time Value 2).
Table Display:
Strike prices and option types (Call/Put) for both options.
Selected values (time value or option value) for each option.
The difference between the two options’ selected values.

Option Time ValueThis TradingView script calculates and visualizes the time value of an option (Call or Put) based on its market price and intrinsic value. The time value represents the premium paid for the option above its intrinsic value, and it is a key metric for analyzing the cost of holding an option.
This script is suitable for traders analyzing options on indices or stocks, such as the NIFTY 50, and supports both Call and Put options. By dynamically extracting the strike price and option type from the input symbol, it adapts seamlessly to the selected instrument.
Key Features:
Dynamic Instrument Selection:
Users can input the underlying asset (e.g., NSE:NIFTY) and the specific option instrument (e.g., NSE:NIFTY250327C24000 for a Call or NSE:NIFTY250327P24000 for a Put).
Automatic Option Type Detection:
The script detects whether the option is a Call or a Put by parsing the input symbol for the characters "C" (Call) or "P" (Put).
Dynamic Strike Price Extraction:
The strike price is dynamically extracted from the input option symbol, eliminating the need for hardcoding and reducing user errors.
Key Metrics Plotted:
Time Value: The premium paid above the intrinsic value, plotted in blue.
Intrinsic Value: The calculated intrinsic value of the option, plotted in green.
Seamless Integration:
Designed for ease of use and integration into existing TradingView setups.
Automatically adjusts to the timeframe and pricing data of the selected instruments.

Options Cumulative Chart AnalysysThis Pine Script is a comprehensive tool designed for traders analyzing options data on TradingView. It aggregates multiple symbols to calculate and visualize cumulative performance, providing essential insights for decision-making.
Key Features:
Symbol and Strike Price Configuration:
Supports up to four configurable symbols (e.g., NIFTY options).
Allows defining buy/sell actions, quantities, and entry premiums for each symbol.
Customizable Chart Display:
Plot candlesticks and line charts for cumulative data.
Configurable Exponential Moving Averages (EMAs) for technical analysis.
Entry and price lines with customizable colors.
Timeframe Management:
Supports higher timeframe (HTF) candles.
Ensures compatibility with the current chart timeframe to maintain accuracy.
Dynamic Coloring and Visualization:
Red, green, and gray color schemes for body and wicks of candlesticks based on price movements.
Customizable positive and negative color schemes.
Table for Data Representation:
Displays an info table showing symbols, quantities, entry prices, and latest traded prices (LTP).
Adjustable table position, overlay, and styling.
Premium and Profit/Loss Calculations:
Calculates cumulative open, high, low, and close prices considering premiums and quantities.
Tracks the profit and loss dynamically based on cumulative premiums and market prices.
Alerts and Notifications:
Alerts triggered on specific conditions, such as when the profit/loss turns negative.
Modular Functions:
Functions for calculating high/low/open/close values, combining premiums, and drawing candlesticks.
Utilities for symbol management and security requests.
Custom Settings:
Includes a wide range of input options for customization:
Timeframes, EMA lengths, colors, table configurations, and more.
Error Handling:
Validates timeframe inputs to ensure compatibility and prevent runtime errors.
This script is designed for advanced traders looking for a customizable tool to analyze cumulative options data efficiently. By leveraging its modular design and visual elements, users can make informed trading decisions with a holistic view of market movements.
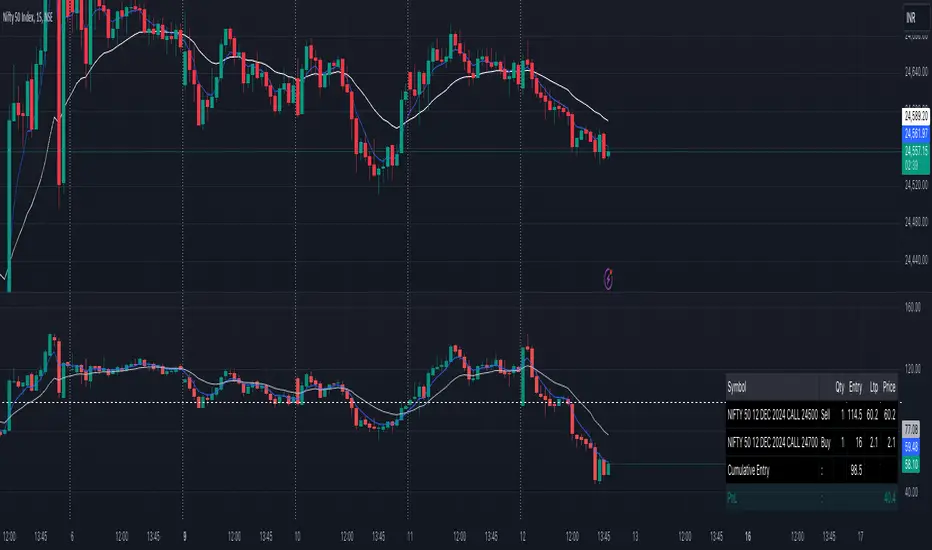
Rolling Straddle PremiumScript is Basically intended to provide insight's on the Rolling Straddle premium for the selected index based on the input settings.
Important thing to consider for the script to work seamlessly:
Specify the LTP in the input field (need not be very accurate)
Specify the Expiry Date for the Option Strike.
Ensure Profile matches to the chart script (Index Script)
Note: Zones marked in Blue, is the max level that indicator can track the option prices. beyond which it may fail to track, during such time consider reloading the indicator with Latest LTP .
Labels on the chart indicate that If i had shorted the Straddle, what would be my current position of that Straddle. however the rational behind shorting is only the pivot high points (not sure if this is right or wrong! )
Note On Labels: Labels are delayed basis the pivot point candles specified in the indicator settings.
EN: Entry Price (Straddle Premium) of the Strike Specified.
Cur: Current Price ( Current Straddle Premium ) of the Strike Specified.
SH: Max Straddle Premium ( Increase in Premium ) since position is active.
SL: Min Straddle Premium ( Premium Erosion ) since position is active.
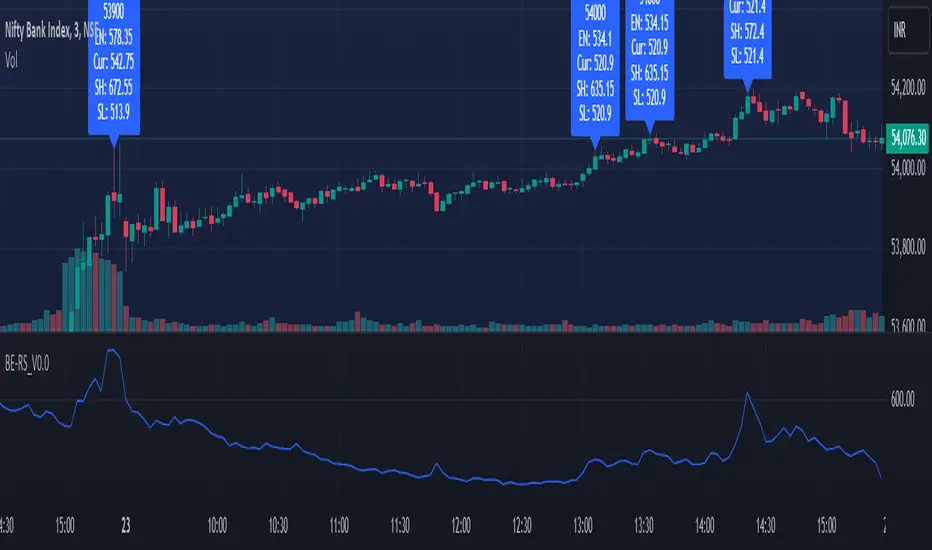
Theta Shield | Flux Charts💎 GENERAL OVERVIEW
Introducing our new Theta Shield indicator! Theta is the options risk factor concerning how fast there is a decline in the value of an option over time. This indicator aims to help the trader avoid sideways market phases in the current ticker, to minimize the risk of theta decay. For more information, please check the "How Does It Work" section.
Features of the new Theta Shield Indicator :
Foresight Of Accumulation Zones
Decrease Risk Of Theta Decay
Clear "Valid" & "Non-Valid" Signals
Validness Trail
Alerts
📌 HOW DOES IT WORK ?
In options trading, theta is defined as the rate of decline in the value of an option due to the passage of time. Traders want to avoid this kind of decay in the value of an option. One of the best ways to avoid it is not holding an option contract when the market is going sideways. This indicator uses a stochastic oscillator to try to get a foresight of sideways markets, warning the trader to not hold an option contract while the price is in a range.
The indicator starts by calculating the stochastic value using close, high & low prices of the candlesticks. Then a stoch threshold & a theta length are determined depending on the option contract type defined by the user in the settings of the indicator. Each candlestick that falls above or below the stoch threshold value is counted, and a "theta valid strength" is calculated using the counted candlesticks, which has a value between -100 & 100. Here is the formula of the "theta valid strength" value :
f_lin_interpolate(float x0, float x1, float y0, float y1, float x) =>
y0 + (x - x0) * (y1 - y0) / (x1 - x0)
thetaValid = Total Candlesticks That Fall Above & Below The Threshold In Last "Theta Length" bars.
thetaValidStrength = f_lin_interpolate(0, thetaLength, -100, 100, thetaValid)
Then a trail is rendered, and "Valid" & "Non-Valid" signals are given using this freshly calculated strength value. Valid means that the indicator currently thinks that no accumulation will happen in the near future, so the option positions in the current ticker are protected from the theta decay. Non-Valid means that the indicator thinks the ticker has entered the accumulation phase, so holding any option position is not recommended, as they may be affected by the theta decay.
🚩 UNIQUENESS
This indicator offers a unique way to avoid theta decay in options trading. It uses a stochastic oscillator and thresholds to calculate a "theta strength" value, which is used for rendering validness signals and a trail. Traders can follow the valid & non-valid signals when deciding to hold their options position or not. The indicator also has an alerts feature, so you can get notified when a ticker is about to enter a range, or when it's about to get out of it.
⚙️ SETTINGS
1. General Configuration
Contract Type -> You can set the option contract type here. The indicator will adjust itself to get a better foresight depending on the contract length.
2. Style
Fill Validness -> Will render a trail based on "theta strength" value.