Market Structure Break & OB Probability Toolkit [LuxAlgo]The Market Structure Break & OB Probability Toolkit indicator provides an institutional framework for identifying high-probability liquidity zones and significant market structure transitions using momentum-based filters and volume analysis.
🔶 USAGE
The indicator aims to provide a systematic approach to structural analysis, allowing traders to identify clear institutional footprints. By integrating statistical filters, the tool helps isolate high-conviction signals from market noise.
🔹 Market Structure Breaks (MSB)
Unlike standard fractal-based breaks, the MSB logic in this toolkit utilizes a Momentum Z-Score filter . This ensures that structural shifts are only highlighted when price breaks a pivot with significant conviction.
Pivot Lookback: Custom sensitivity for identifying swing highs and lows.
Volatility Filtering: Only breaks exceeding the statistical threshold are labeled, helping traders avoid low-momentum fakeouts.
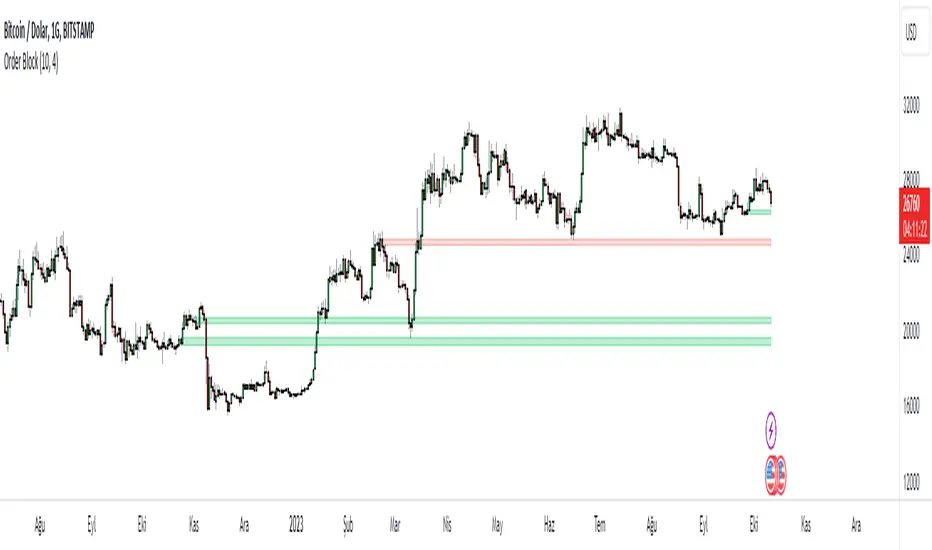
🔹 Institutional Order Blocks (OB)
The script automatically detects and manages Order Blocks based on the candle preceding an MSB. Every zone includes a Point of Control (POC) line for precise entry or target consideration.
Standard OBs: Formed during structural transitions, representing potential institutional interest.
High-Probability OBs (HP-OB): Zones identified with exceptionally high impulse and volume signatures (score > 80%). These are visually distinct to highlight their increased significance.
🔹 Session Range Integration
Traders can track the ranges of the London, New York, Tokyo, and Sydney sessions. This allows for the identification of structural breaks occurring at session extremes or during high-liquidity windows.
🔹 Strategy Application
Trend Direction: Identify the prevailing bias through MSB signals. A bullish MSB followed by a retracement into a Bullish OB provides a classic institutional entry scenario.
Zone Confluence: Look for High-Probability OBs that align with Session Highs/Lows for increased trade conviction.
Re-test Analysis: Enable "Extend Broken OBs" to see how price interacts with flipped liquidity zones.
🔶 DETAILS
The toolkit utilizes several advanced logic components to maintain chart clarity and analytical depth:
Intelligent Mitigation Logic: Active zones are managed in real-time. Traders can choose between "Historical" (shows all past zones) or "Present" (shows only active zones) display modes.
Mitigated Extension: A specialized feature to extend recently broken zones, allowing for re-test analysis of formerly active liquidity.
Overlap Filter: Option to hide overlapping Order Blocks to maintain a clean, actionable chart.
🔹 Analytics Dashboard
The built-in dashboard provides a real-time performance suite:
OB Reliability: A percentage-based efficiency metric tracking how many detected zones have been successfully mitigated by price.
High-Prob Zone Count: A live counter of active HP-OBs currently remaining on the chart.
🔶 SETTINGS
🔹 Market Structure
Pivot Lookback: Defines the sensitivity of the market structure detection by adjusting the lookback period for pivots.
MSB Momentum Z-Score: Sets the statistical threshold for a price move to be considered a valid structural break.
🔹 Visuals
Display Mode: Toggles between showing historical mitigated zones or only currently active ones.
🔹 Order Blocks
Max Active OBs: Controls the maximum number of blocks stored and displayed on the chart.
Extend Broken OBs: If enabled, recently mitigated blocks will remain visible to observe potential re-tests.
Hide Overlapping OBs: Removes redundant zones that occupy the same price area as existing ones.
🔹 Sessions
Show Session Ranges: Global toggle for session visualizations.
Session Toggles: Individual controls to enable London, New York, Tokyo, or Sydney ranges with custom time and color inputs.
Institutional trading concepts and Smart Money Concept (SMC) indicators involve significant risk. This tool is designed for educational and analytical purposes. Past performance is not indicative of future results.
Pine Script® indicator