Hazel nut BB Strategy, volume base- lite versionHazel nut BB Strategy, volume base — lite version
Having knowledge and information in financial markets is only useful when a trader operates with a well-defined trading strategy. Trading strategies assist in capital management, profit-taking, and reducing potential losses.
This strategy is built upon the core principle of supply and demand dynamics. Alongside this foundation, one of the widely used technical tools — the Bollinger Bands — is employed to structure a framework for profit management and risk control.
In this strategy, the interaction of these tools is explained in detail. A key point to note is that for calculating buy and sell volumes, a lower timeframe function is used. When applied with a tick-level resolution, this provides the most precise measurement of buyer/seller flows. However, this comes with a limitation of reduced historical depth. Users should be aware of this trade-off: if precise tick-level data is required, shorter timeframes should be considered to extend historical coverage .
The strategy offers multiple configuration options. Nevertheless, it should be treated strictly as a supportive tool rather than a standalone trading system. Decisions must integrate personal analysis and other instruments. For example, in highly volatile assets with narrow ranges, it is recommended to adjust profit-taking and stop-loss percentages to smaller values.
◉ Volume Settings
• Buyer and seller volume (up/down volume) are requested from a lower timeframe, with an option to override the automatic resolution.
• A global lookback period is applied to calculate moving averages and cumulative sums of buy/sell/delta volumes.
• Ratios of buyers/sellers to total volume are derived both on the current bar and across the lookback window.
◉ Bollinger Band
• Bands are computed using configurable moving averages (SMA, EMA, RMA, WMA, VWMA).
• Inputs allow control of length, standard deviation multiplier, and offset.
• The basis, upper, and lower bands are plotted, with a shaded background between them.
◉ Progress & Proximity
• Relative position of the price to the Bollinger basis is expressed as percentages (qPlus/qMinus).
• “Near band” conditions are triggered when price progress toward the upper or lower band exceeds a user-defined threshold (%).
• A signed score (sScore) represents how far the close has moved above or below the basis relative to band width.
◉ Info Table
• Optional compact table summarizing:
• - Upper/lower band margins
• - Buyer/seller volumes with moving averages
• - Delta and cumulative delta
• - Buyer/seller ratios per bar and across the window
• - Money flow values (buy/sell/delta × price) for bar-level and summed periods
• The table is neutral-colored and resizable for different chart layouts.
◉ Zone Event Gate
• Tracks entry into and exit from “near band” zones.
• Arming logic: a side is armed when price enters a band proximity zone.
• Trigger logic: on exit, a trade event is generated if cumulative buyer or seller volume dominates over a configurable window.
◉ Trading Logic
• Orders are placed only on zone-exit events, conditional on volume dominance.
• Position sizing is defined as a fixed percentage of strategy equity.
• Long entries occur when leaving the lower zone with buyer dominance; short entries occur when leaving the upper zone with seller dominance.
◉ Exit Rules
• Open positions are managed by a strict priority sequence:
• 1. Stop-loss (% of entry price)
• 2. Take-profit (% of entry price)
• 3. Opposite-side event (zone exit with dominance in the other direction)
• Stop-loss and take-profit levels are configurable
◉ Notes
• This lite version is intended to demonstrate the interaction of Bollinger Bands and volume-based dominance logic.
• It provides a framework to observe how price reacts at band boundaries under varying buy/sell pressure, and how zone exits can be systematically converted into entry/exit signals.
When configuring this strategy, it is essential to carefully review the settings within the Strategy Tester. Ensure that the chosen parameters and historical data options are correctly aligned with the intended use. Accurate back testing depends on applying proper configurations for historical reference. The figure below illustrates sample result and configuration type.
Orderflow

Yuri Garcia Smart Money Strategy FULL (COMPLIANT)Yuri Garcia Smart Money Strategy FULL (Slope Divergence)
This script is not a mashup of random indicators. It is an original, coherent strategy that blends multiple institutional-grade tools to form a unified Smart Money trading system. Each component contributes to precise trade filtering, context, and confirmation — no element is decorative or redundant.
🔍 Strategy Logic: How It Works
This strategy integrates the following tools, each with a clearly defined role:
1. Volume Cluster Zones (Orange bands)
Identifies strong buy/sell areas using the highest volume nodes over a rolling window. These act as dynamic points of control where Smart Money is likely active.
2. HTF Zones (4H) (Purple band)
Defines institutional zones by using the 20-bar high/low on the 4-hour chart. These set the outer bounds for valid entries, ensuring alignment with larger market structure.
3. Wick Pullback Filter (Orange circle 🔶)
Detects exhaustion or absorption near zones. Used to confirm genuine rejection after liquidity sweeps or traps.
4. Cumulative Delta Confirmation (Red square 🟥)
Analyzes whether buyers or sellers are dominant using delta volume. Trades only trigger when volume confirms the intended direction.
5. Slope-Based Delta Divergence (Optional)
Detects hidden reversals between price and delta. This prevents late entries and provides early insight into potential trap reversals.
6. Liquidity Grab Detection (Blue diamond 🔷)
Marks smart money stop hunts — temporary price breaks beyond highs/lows, followed by reversal. Used as a confluence tool.
7. ATR-Based Dynamic Risk Control
The strategy uses ATR to calculate SL/TP dynamically. This allows position sizing to adjust to volatility, reducing overexposure in high-momentum conditions.
🎯 Entry Criteria
All the following conditions must be met:
✅ Price is inside a Volume Cluster Zone
✅ Price is within the HTF Institutional Zone
✅ Wick Pullback confirms reaction
✅ Delta confirms strength of buyers/sellers
✅ (Optional) Slope-based divergence signals hidden shift
✅ (Optional) Liquidity grab occurs
Only then will the strategy trigger an entry.
📈 Visual Legend (Symbols on Chart)
Symbol Description
🟣 Purple Zone HTF Support/Resistance zone (4H context)
🟠 Orange Zone Volume cluster from top 3 volume nodes
🔶 Orange Circle Wick Pullback confirmation
🟥 Red Square Delta Confirmation
🔷 Blue Diamond Liquidity Grab indicator
🔵 Blue X Price is inside HTF Zone
🔻 Red Triangle SHORT entry signal
🔺 Green Triangle LONG entry signal
These visuals make it easier to read the chart intuitively while understanding each condition’s role.
⚙️ Strategy Settings Justification
Default Qty: 2% of equity (sustainable risk)
RRR: 2.0 (adaptive to volatility)
ATR Multiplier: 2.0 for SL/TP
Commission: 0.1% used
Slippage: 2 points for realism
Minimum Trades for Testing: Designed to generate over 100 trades under normal backtest conditions
Dataset: Supports BTC, GOLD, Forex, Indices with realistic volatility and volume
These settings reflect a realistic use case for average retail traders and avoid overfitting or unrealistic returns.
📌 How to Use
Apply on 15-minute or 1-hour timeframe.
Wait for full alignment of all entry conditions.
Confirm visually or use included alerts for manual or bot execution.
SL and TP are automatically handled.
🚫 Important Notes
This script is original, not a remix or mashup of unrelated indicators.
Each component was designed to work in harmony, enhancing trade quality and confidence.
No external scripts are required to function.
Alert messages are pre-formatted for both manual and webhook use.

🧪 Yuri Garcia Smart Money Strategy FULL (Slope Divergence))📣 Yuri Garcia – Smart Money Strategy FULL
This is my private Smart Money Concept strategy, designed for my family and community to learn, trade, and grow sustainably.
🔑 How it works:
✅ Volume Cluster Zones: Automatically detects areas where strong buyers or sellers concentrate, acting as dynamic S/R levels.
✅ HTF Institutional Zones (4H): Higher timeframe trend filter ensures you’re always trading in the direction of major flows.
✅ Wick Pullback Filter: Confirms price rejects the zone, catching smart money traps and reversals.
✅ Cumulative Delta (CVD): Confirms whether buyers or sellers are truly in control.
✅ Slope-Based Divergence: Optional hidden divergence between price & CVD to spot reversals others miss.
✅ ATR Dynamic SL/TP: Adapts stop loss and take profit to live volatility with adjustable risk/reward.
🧩 Visual Markers Explained:
🟦 Blue X: Price inside HTF zone
🟨 Yellow X: Price inside Volume Cluster zone
🟧 Orange Circle: Wick pullback detected
🟥 Red Square: CVD confirms order flow strength
🔼 Aqua Triangle Up: Bullish slope divergence
🔽 Purple Triangle Down: Bearish slope divergence
🟢 Green Triangle Up: Final Long Entry confirmed
🔴 Red Triangle Down: Final Short Entry confirmed
⚡ Who is this for?
This strategy is best suited for traders who understand smart money concepts, order flow, and want an adaptive framework to trade major assets like BTC, Gold, SP500, NASDAQ, or FX pairs.
🔒 Important
Use responsibly, backtest extensively, and combine with solid risk management. This is for educational purposes only.
✨ Credits
Built with ❤️ by Yuri Garcia – dedicated to my family & community.
✅ How to use it
1️⃣ Add to chart
2️⃣ Adjust inputs for your asset & timeframe
3️⃣ Enable/disable slope divergence filter to match your style
4️⃣ Set your alerts with built-in conditions

Order Flow Analysis - MultiThis version of Order Flow Analysis tracks delta for six symbols.
The first ticker is the same symbol as the chart. Other tickers, the number of delta bars, location, font sizes and colors can be configured in settings. This also identifies top tick volume and lists in each bar.
Please do not refresh the browser or else values may be reset. Also, ignore the first delta bar values.

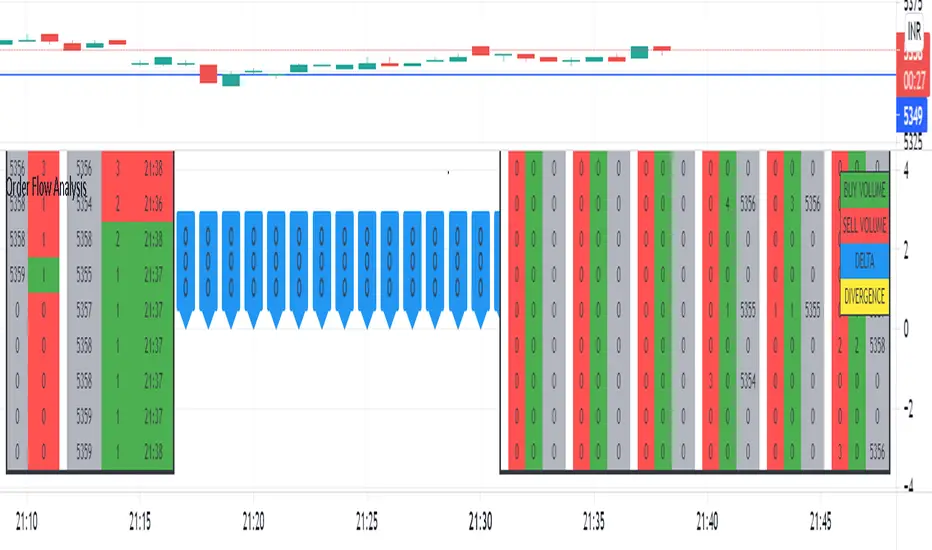
Order Flow AnalysisThe script plots the order flow clusters for the last six candles in the middle right.
The cluster contains buy volume, sell volume and the price range of the volume.
It calculates uptick volume as buy volume and down tick volume as sell volume and calculates the delta(shown in labels). Recent ATR is considered to determine each cell price range in the cluster.
At the left side, the top volume ticks and the live ticks are displayed.
Please note this works only during market trading hours.
Do not refresh the browser tab and do not change the timeframe, which will cause a reset of numbers.