ARDO - Adaptive Regression Deviation Oscillator (v2.4.6)ARDO – Adaptive Regression Deviation Oscillator (v2.4.6)
ARDO (Adaptive Regression Deviation Oscillator) quantifies deviation of price structure from a regression-based equilibrium baseline using adaptive moving-average spreads. It combines percentile-normalized distance, linear-regression slope, and dynamic gradient scaling to reveal trend extension, exhaustion, and regime shifts—offering a structural view of trend integrity and mean-reversion timing beyond traditional momentum oscillators. It is designed to help you answer two questions:
Where are we in the regime? (extended, neutral, or reversal-prone)
Is this a “trade” environment or a “stand aside” environment? (Gate PASS vs Gate BLOCK / drift)
ARDO is best used as a context + timing framework , not a standalone entry/exit system.
What you see in the ARDO pane
1) Spread A (% vs baseline)
Primary “timing” spread (default: stepline). Spread A is colored by a 4-state maColor model:
GREEN : above baseline and strengthening
ORANGE : above baseline but weakening
RED : below baseline and weakening
GRAY : below baseline but improving
2) Spread B (% vs baseline)
Secondary “context” spread (default: columns). Same 4-state color model as above, often used to confirm or filter Spread A behavior.
3) LinReg (slope-gradient)
A LinReg line fit to a selected source (Spread A / Spread B / Spread A+B). ARDO applies a slope-magnitude gradient (opacity/intensity) to visualize regime:
Stronger slope magnitude = stronger directional regime
Fading / low slope magnitude = drift / dead-zone (lower edge, choppy conditions, or end-of-move)
4) Tier zones (Q0–Q2, H2–H4)
ARDO classifies LinReg values into percentile tiers (extremes and mid-tiers). These tiers can be rendered as:
Background regions, or
Zero-line marker circles (“MK …” plots)
Important: Background colors do not export . The “MK Q0 … MK H4” series are emitted so you can reconstruct tier membership in CSV/backtests.
5) Gate PASS / Gate BLOCK
A compact “permission layer” that can require:
Spread A > LinReg
EMA Fast > EMA Slow
Minimum Spread A threshold
Minimum absolute LinReg slope
Use Gate PASS to focus on higher-quality conditions; use Gate BLOCK as a “do nothing / reduce size” warning.
Key settings (what they change)
Tier Mode
Standard: symmetric cut structure (general purpose)
Asymmetric: separate tuning for highs vs lows (often better when upside and downside behavior are not symmetric)
Tier Population
All Bars (LinReg): tiers represent the full LinReg distribution
Pivots Only: tiers are computed from pivot events only (can tighten “extreme” definition and change how frequently zones appear)
Render Mode
Background: easiest to read visually
Zero-line Markers: best for export/backtesting workflows (MK series)
Gating options
Turn on/off each rule independently; adjust thresholds to match symbol volatility and timeframe.
Color overrides
Optional per-state color customization for Spread A, Spread B, and LinReg (4-state).
Alerts included (v2.4.6)
ARDO exposes named alerts you can use for automation or review, including:
Gradient / regime alerts (HIGH vs LOW slope-magnitude regimes; regime shift transitions)
Color-state changes (Spread B → GREEN/ORANGE/RED/GRAY; LinReg state changes)
Tier entry alert s (LinReg entering key tiers such as Q0/Q1/H3/H4)
Structural primitives (Bullish A > B, Bearish A < B, Gate PASS/BLOCK, crosses of 0, etc.)
How to use (practical workflow)
Anchor timeframe (65m or Daily): identify regime (tiers + gradient) and whether you should be aggressive or defensive.
Execution timeframe (5m/1m): time entries using Spread A/B structure and Gate PASS, aligned with the anchor regime.
Avoid forcing trades in drift: fading gradient + mid/low-edge tiers often marks “dead-zone” conditions.
Notes / limitations
ARDO is a context engine: it describes regime and location, not guaranteed direction.
Tier thresholds are distribution-based and will vary by window/timeframe.
Always apply your own risk management; this script is not financial advice.
Oscillator-overbought

智能趋势-多周期动态信号 Smart Trend Oscillator MTF V1🚀 智能趋势-多周期动态信号 Smart Trend Oscillator MTF V1
—— 让交易像红绿灯一样简单直观 | Making Trading as Simple as Traffic Lights
告别复杂的参数设置,把市场噪音变成明确的信号。 Say goodbye to complex parameters. Turn market noise into clear signals.
🌟 它是做什么的? / What Does It Do?
“智能趋势管家” 就像您的私人交易副驾驶。它内置了一套先进的智能平滑算法,能够自动过滤掉市场中那些骗人的假动作,只把最核心的**“市场真实韵律”通过一条平滑的波浪线展示给您。它不只是一根线,它是一套会思考的系统**。
"Smart Trend Oscillator " is like your personal trading co-pilot. It features a built-in advanced smoothing algorithm that automatically filters out deceptive market "fake-outs," revealing the "true rhythm" of the market through a single, smooth wave. It’s not just a line; it’s a thinking system.
🔥 核心功能 / Core Features
1. 🌊 智能波浪引擎 / Smart Wave Engine
不要被K线的上蹿下跳迷惑。我们的引擎能识别市场内部的真实能量。 Don't be confused by erratic candlesticks. Our engine identifies the true internal energy of the market.
过滤噪音 (Filter Noise):自动忽略短暂的随机波动。
捕捉趋势 (Capture Trends):波浪上升代表买方主导,波浪下降代表卖方主导。
2. 🛡️ 自适应波动通道 / Adaptive Channels
市场有时候像乌龟(波动小),有时候像兔子(波动大)。指标拥有一个“弹性通道”,它会根据市场活跃度自动变宽或变窄,精准判断价格是否“过热”或“超卖”。 The market moves between low and high volatility. The indicator features an "elastic channel" that automatically widens or narrows, accurately judging if the price is "Overheated" or "Oversold."
3. 🌍 全局监控面板 / Global Dashboard
右上角的面板是您的战况指挥室。一眼看懂 6 个不同时间维度的状态。全绿代表多周期共振向上,全红代表多周期共振向下。 The panel in the top-right corner is your Command Center. Understand the status of 6 different time dimensions at a glance. All Green means upward resonance; All Red means downward resonance.
⚙️ 极致的个性化定制 / Ultimate Customization
v16 版本为您提供了前所未有的控制权,让指标完全适应您的交易风格。 Version 16 gives you unprecedented control to tailor the indicator to your trading style.
🕒 1. 时间周期,由你定义 (Customizable Timeframes)
不再局限于系统默认设置。您可以在设置面板中自由输入 6 个您最关心的周期(例如:5分钟、1小时、甚至 3天)。
短线手:设置为 1分/3分/5分/15分...
波段手:设置为 1小时/4小时/日线/周线...
Benefit: You can freely input the 6 timeframes that matter most to you in the settings panel, whether you are a scalper or a swing trader.
🎯 2. 灵敏度调节 (Adjustable Sensitivity)
想要更多交易机会?还是想要更稳健的信号?
高灵敏度:调高 Zone Sensitivity,捕捉每一次微小的回调(适合激进风格)。
低灵敏度:调低数值,过滤掉小波动,只抓大趋势(适合稳健风格)。
Benefit: Dial up the sensitivity to catch every minor pullback (Aggressive), or dial it down to filter noise and catch only big trends (Conservative).
📊 3. 两种平滑模式 (SMA vs. VWMA)
您可以选择通道的计算核心:
Standard (SMA):经典模式,适合大多数市场。
Volume Weighted (VWMA):成交量加权模式。在加密货币或股票市场,它能帮您过滤掉“无量空涨”或“无量空跌”的假信号。
Benefit: Choose Standard (SMA) for general markets, or Volume Weighted (VWMA) to filter out fake moves on low volume (great for Crypto/Stocks).
🚦 信号含义 / Signals Guide
我们把复杂的逻辑浓缩成了最简单的视觉标签: We have condensed complex logic into the simplest visual labels:
🟢 绿色 BUY 标签:市场“便宜”且能量向上。 (Market is "Cheap" & Energy is Up.)
🔴 红色 SELL 标签:市场“过热”且能量向下。 (Market is "Overheated" & Energy is Down.)
🔵 蓝色 HOLD 标签:趋势延续中,建议持仓。 (Trend is continuing, suggest holding position.)
📥 快速上手 / Quick Start
加载指标 (Load):添加到您的图表。
设置周期 (Set Timeframes):在输入选项里填入您习惯查看的 6 个时间周期。
选择模式 (Choose Mode):如果是成交量重要的资产,建议开启 VWMA 模式。
等信号 (Wait):等待带方框的 BUY 或 SELL 标签出现。
把复杂留给算法,把简单留给您。 Leave the complexity to the algorithms, and keep the simplicity for yourself.

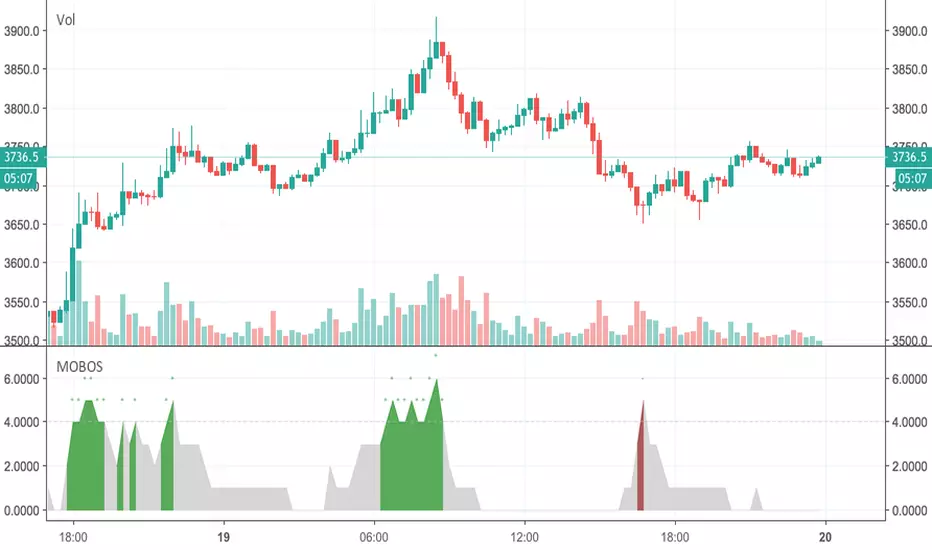
AMV Volume AssistantThe AMV Volume Assistant is a custom tool that visualizes volume delta strength using percentile-based scoring. It helps identify potential overbought and oversold conditions by measuring how strong recent buying or selling pressure is compared to historical volume behavior.
What it does:
Tracks delta accumulation using lower timeframe data split into buying and selling volume based on candle direction.
Converts this accumulation into a percentile score to show relative strength or weakness.
Colors the background green or red when the smoothed score crosses key thresholds (+3 or -3), highlighting moments of possible volume exhaustion or continuation.
Use case:
This tool is useful for intraday traders who want a simple way to spot strong buying or selling pressure and assess when the move may be overextended. It works best as a supporting indicator alongside your main strategy or trend framework.
This tool works best on futures such as CME_MINI:NQ1! due to the accuracy of volume data provided.
IMPORTANT: On lower tf's such as the 1 minute timeframes, 5s data is needed so a premium subscription is required for the use of this indicator.

Quad Rotation StochasticQuad Rotation Stochastic
The Quad Rotation Stochastic is a powerful and unique momentum oscillator that combines four different stochastic setups into one tool, providing an incredibly detailed view of market conditions. This multi-timeframe stochastic approach helps traders better anticipate trend continuations, reversals, and momentum shifts with greater precision than traditional single stochastic indicators.
Why this indicator is useful:
Multi-layered Momentum Analysis: Instead of relying on one stochastic, this script tracks four independent stochastic readings, smoothing out noise and confirming stronger signals.
Advanced Divergence Detection: It automatically identifies bullish and bearish divergences for each stochastic, helping traders spot potential reversals early.
Background Color Alerts: When a configurable number (e.g., 3 or 4) of the stochastics agree in direction and position (overbought/oversold), the background colors green (bullish) or red (bearish) to give instant visual cues.
ABCD Pattern Recognition: The script recognizes "shield" patterns when Stochastic 4 remains stuck at extreme levels (above 90 or below 10) for a set time, warning of potential trend continuation setups.
Super Signal Alerts: If all four stochastics align in extreme conditions and slope in the same direction, the indicator plots a special "Super Signal," offering high-confidence entry opportunities.
Why this indicator is unique:
Quad Confirmation Logic: Combining four different stochastics makes this tool much less prone to false signals compared to using a single stochastic.
Customizable Divergence Coloring: Traders can choose to have divergence lines automatically match the stochastic color for clear visual association.
Adaptive ABCD Shields: Innovative use of bar counting while a stochastic remains extreme acts as a "shield," offering a unique way to filter out minor fake-outs.
Flexible Configuration: Each stochastic's sensitivity, divergence settings, and visual styling can be fully customized, allowing traders to adapt it to their own strategy and asset.
Example Usage: Trading Bitcoin with Quad Rotation Stochastic
When trading Bitcoin (BTCUSD), you might set the minimum count (minCount) to 3, meaning three out of four stochastics must be in agreement to trigger a background color.
If the background turns green, and you notice an ABCD Bullish Shield (Green X), you might look for bullish candlestick patterns or moving average crossovers to enter a long trade.
Conversely, if the background turns red and a Super Down Signal appears, it suggests high probability for further downside, giving you strong confirmation to either short BTC or avoid entering new longs.
By combining divergence signals with background colors and the ABCD shields, the Quad Rotation Stochastic provides a layered confirmation system that gives traders greater confidence in their entries and exits — particularly in fast-moving, volatile markets like Bitcoin.

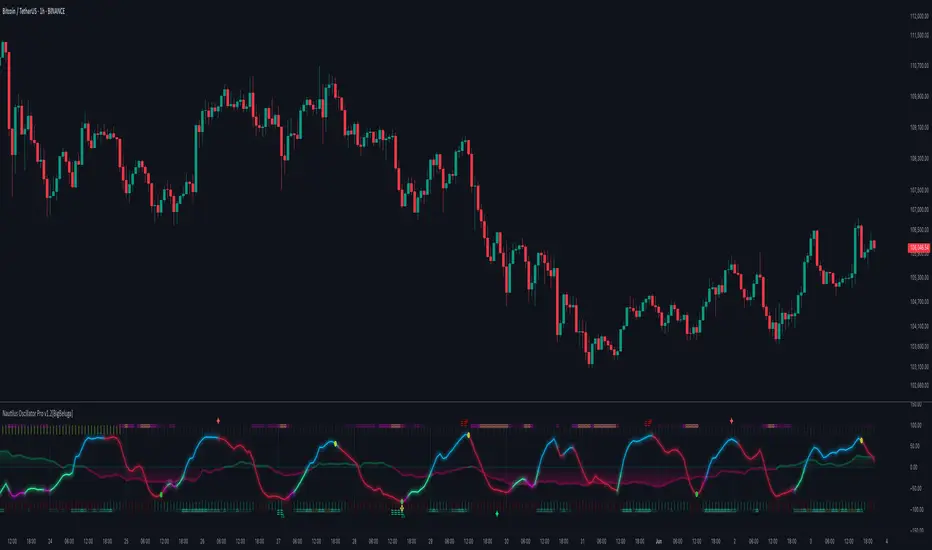
Nautilus Oscillator [BigBeluga]NAUTILUS OSCILLATOR
The Nautilus Oscillator by BigBeluga is an advanced technical analysis tool designed to help traders identify trend direction, strength, and potential reversal points in the market. This versatile indicator combines multiple analytical elements to provide a comprehensive view of market conditions.
Why It’s Unique:
The Nautilus Oscillator is unique too, its blend of multiple technical analysis tools into a single, coherent indicator.
By smoothing with a unique and highly valued in signal processing filter, and incorporating dynamic thresholds, this oscillator offers a more refined and adaptable approach to identifying trading signals.
The filter is designed to have as flat a frequency response as possible in the passband. This means that within the range of frequencies it allows through, minimizes distortion and maintains the true shape of the signal more accurately than many other types of filters.
The addition of a trend filter and divergence detection further enhances its capability, making it a versatile tool for both trend-following and reversal strategies. The built-in dashboard and clean chart management features provide traders with a streamlined, informative, and visually appealing trading experience. This makes the Nautilus Oscillator not just a tool for analysis but a comprehensive trading system in itself.
🔵 KEY FEATURES
● Main Oscillator Line
Smoothly transitions between bullish (green) and bearish (purple) colors
Helps visualize mean-reversion, market trend, and momentum
● Histogram
Displayed below the main oscillator line
Represents the rate of change of the main oscillator
Acts as a leading indicator, often showing changes faster than the main oscillator line
Can be viewed as a predictive element, potentially indicating future movements of the main oscillator
Histogram crossover signals (small dots) can indicate short-term momentum shifts
Useful for early detection of potential trend changes or momentum shifts
● Confluence Arrows
Arrows displayed above and below the oscillator
Provide additional confluence signals that work in conjunction with the histogram
Act as supplementary indicators to confirm the main oscillator signals
Help in identifying stronger, more reliable trading opportunities when aligned with other indicator elements
● Trend Filter
Displayed as horizontal lines above and below the oscillator
Upper lines (above the oscillator): Indicate an uptrend
Lower lines (below the oscillator): Indicate a downtrend
Three lines appear when a strong trend is present
Only one line is displayed when there's no trend
Color-coded for easy identification (typically green for up, purple for down)
Color intensity indicates the strength of the trend. More intensive color indicates stronger trend
Provides a clear visual representation of the overall market trend
Helps traders align their strategies with the broader market direction
● Overbought/Oversold Thresholds
Can be set to static levels or dynamically adjust based on market volatility
Helps identify potential reversal points in the market
● Signals
Strong signals: Displayed as circles on both the oscillator and main chart (optional)
Simple signals: Shown as X marks on both the oscillator and main chart (optional)
Histogram crossover signals: Small dots on the histogram
● Stop Levels
Optional feature that plots potential stop-loss levels for strong signals
Based on the Market volatility for adaptability to different market conditions
● Divergences
Identifies and displays bullish and bearish divergences between price and the oscillator
Helps spot potential trend reversals
● Dashboard
Provides at-a-glance information about current market conditions
Displays trend direction, last signal, histogram direction, threshold mode, and divergence status
🔵 HOW TO USE
● Trend Identification
Use the main oscillator line color and position, along with the trend filter lines, to determine the overall market trend
● Entry Signals
Strong signals (circles) suggest potential entry points in the direction of the trend
Simple signals (X marks) can be used for more frequent, but potentially less reliable, entry opportunities
Histogram crossover signals (dots) can indicate changes faster than the main oscillator line
Look for alignment with confluence arrows for stronger entry signals
● Exit Signals
Use the overbought/oversold thresholds as potential enter and exit points
Stop levels (if enabled) provide dynamic exit points for risk management
● Reversal Identification
Watch for divergences between price and the oscillator for potential trend reversals
Pay attention to the histogram direction for early signs of momentum shifts
Notice changes in the trend filter lines (from three lines to one, or vice versa)
● Confirmation
Use the dashboard to quickly confirm the current market state and indicator readings
Combine signals from different elements (main line, histogram, trend filter, confluence arrows) for stronger confirmation
🔵 CUSTOMIZATION
The Nautilus Oscillator offers several customization options to suit different trading styles:
Adjust the main oscillator length
Set static or dynamic overbought/oversold thresholds
Enable/disable and customize stop levels
Toggle divergence display and adjust its parameters
Show/hide the information dashboard
Display simple signals on the main chart
By fine-tuning these settings, traders can adapt the Nautilus Oscillator to various market conditions and personal trading strategies.
The Nautilus Oscillator provides a multi-faceted approach to market analysis, combining trend identification, momentum assessment, and reversal detection in one comprehensive tool. Its visual cues and customizable features make it suitable for both novice and experienced traders across various timeframes and markets. The integration of multiple analytical elements – including the predictive histogram, confluence arrows, and adaptive trend filter – offers traders a rich set of data points to inform their trading decisions.
Paid script
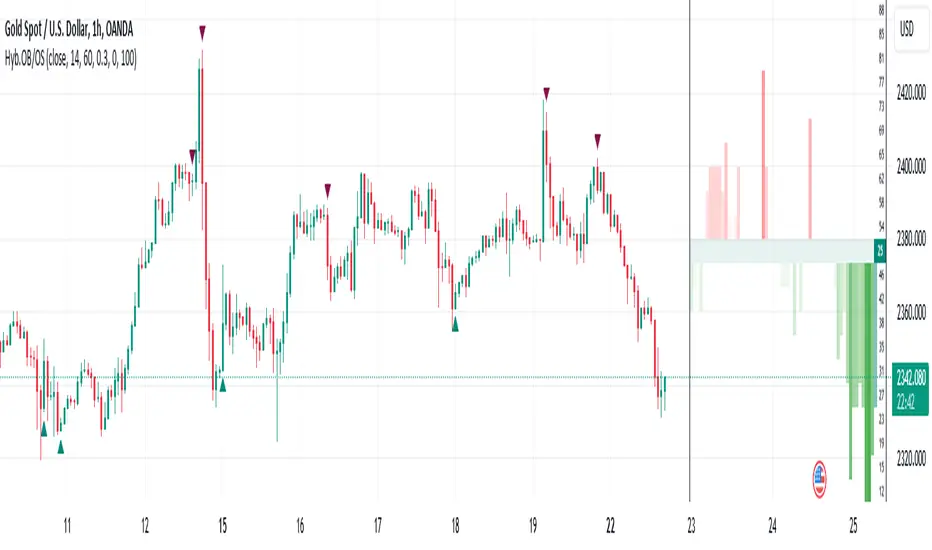
Hybrid Overbought/Oversold OverlayIntroduction
This is a new representation of my well-known oscillator Hybrid Overbought/Oversold Detector overlaid on the chart. The script utilizes the following 12 different oscillators to bring forth a new indicator which I call it Hybrid OB/OS .
Utilized Oscillators
The utilized oscillators here are:
Bollinger Bands %B
Chaikin Money Flow (CMF)
Chande Momentum Oscillator (CMO)
Commodity Channel Index (CCI)
Disparity Index (DIX)
Keltner Channel %K
Money Flow Index (MFI)
Rate Of Change (ROC)
Relative Strength Index (RSI)
Relative Vigor Index (RVI/RVGI)
Stochastic
Twiggs Money Flow (TMF)
The challenging part of utilizing mentioned oscillators was that some of their formulas range are not similar and some of them does not have a mathematical range at all. So I used a normalization function to normalize all their output values to (0, 100) interval.
Overbought/Oversold Levels Calculation
I noticed that the levels which considered as OB/OS level by various traders for each of the utilized oscillators are so different, e.g., many traders consider 30 as OS level and 70 as OB level for RSI and some others take 20 and 80 as the levels, or some traders consider 20 and 80 as OS/OB levels for Stochastic oscillator. Also these levels could be different on different assets, e.g., OB/OS levels for CCI on EURUSD chart might be 80 and 20 while the levels on BTCUSDT chart might be 75 and 25, and so on.
So I decided to make a routine to automate the calculation of these levels using historical data. By this feature, my indicator would calculate the corresponding levels for the oscillators on current chart and then decide about the overbought/oversold situation of each one, which leads to a more accurate Hybrid OB/OS indication.
As the result, if all 12 individual oscillators say it's overbought/oversold, the Hybrid OB/OS shows 100% overbought/oversold, vice versa, if none of them say it's overbought/oversold, the Hybrid OB/OS shows 0, and so on.
The Overlaying Oscillator Problem!
A programming-related challenge here was that Pine Script assigns two separate spaces to the oscillators and the overlaid indicators, and the programmers are limited to use just one of them in each of their codes.
Knowing this, I was forced to simulate the oscillator space on the chart and display my oscillator as a diagram somehow. Of course it won't be as nice as the oscillator itself, because the relation between the main chart bars and the oscillator bars could not be obtained, but it's better than nothing!
Settings and Usage
The indicator settings contain some options about the calculations, the diagram display and the signals appearance. By default they are fine, but you could change them as you prefer.
This indicator is better to be used alongside other indicators as a confirmation (specially in counter-trend strategies I believe). Also it generates an external signal which you could use it in your own designed indicators as well.
Feel free to test it and also the former form of the Hybrid OB/OS . Good Luck!
Stochastic Vix Fix SVIX (Tartigradia)The Stochastic Vix or Stochastic VixFix (SVIX), just like the Williams VixFix, is a realized volatility indicator, and can help in finding market bottoms as well as tops without requiring bollinger bands or any other construct, as the SVIX is bounded between 0-100 which allows for an objective thresholding regardless of the past.
Mathematically, SVIX is the complement of the original Stochastic Oscillator, with such a simple transform reproducing Williams' VixFix and the VIX index signals of high volatility and hence of market bottoms quite accurately but within a bounded 0-100 range. Having a predefined range allows to find markets bottoms without needing to compare to past prices using a bollinger band (Chris Moody on TradingView) nor a moving average (Hesta 2015), as a simple threshold condition (by default above 80) is sufficient to reliably signal interesting entry points at bottoming prices.
Having a predefined range allows to find markets bottoms without needing to compare to past prices using a bollinger band (Chris Moody on TradingView) nor a moving average (Hesta 2015), as a simple threshold condition (by default above 80) is sufficient to reliably signal interesting entry points at bottoming prices.
Indeed, as Williams describes in his paper, markets tend to find the lowest prices during times of highest volatility, which usually accompany times of highest fear.
Although the VixFix originally only indicates market bottoms, the Stochastic VixFix can also indicate good times to exit, when SVIX is at a low value (default: below 20), but just like the original VixFix and VIX index, exit signals are as usual much less reliable than long entries signals, because: 1) mature markets such as SP500 tend to increase over the long term, 2) when market fall, retail traders panic and hence volatility skyrockets and bottom is more reliably signalled, but at market tops, no one is panicking, price action only loses momentum because of liquidity drying up.
Compared to Hesta 2015 strategy of using a moving average over Williams' VixFix to generate entry signals, SVIX generates much fewer false positives during ranging markets, which drastically reduce Hesta 2015 strategy profitability as this incurs quite a lot of losses.
This indicator goes further than the original SVIX, by restoring the smoothed D and second-level smoothed D2 oscillators from the original Stochastic Oscillator, and use a 14-period ZLMA instead of the original 20-period SMA, to generate smoother yet responsive signals compared to using just the raw SVIX (by default, this is disabled, as the original raw SVIX is used to produce more entry signals).
Usage:
Set the timescale to daily or weekly preferably, to reduce false positives.
When the background is highlighted in green or when the highlight disappears, it is usually a good time to enter a long position.
Red background highlighting can be enabled to signal good exit zones, but these generate a lot of false positives.
To further reduce false positives, the SVIX_MA can be used to generate signals instead of the raw SVIX.
For more information on Williams' Vix Fix, which is a strategy published under public domain:
The VIX Fix, Larry Williams, Active Trader magazine, December 2007, web.archive.org
Fixing the VIX: An Indicator to Beat Fear, Amber Hestla-Barnhart, Journal of Technical Analysis, March 13, 2015, ssrn.com
For more information on the Stochastic Vix Fix (SVIX), published under Creative Commons:
Replicating the CBOE VIX using a synthetic volatility index trading algorithm, Dayne Cary and Gary van Vuuren, Cogent Economics & Finance, Volume 7, 2019, Issue 1, doi.org
Note: strangely, in the paper, the authors failed to mention that the SVIX is the complement of the original Stochastic Oscillator, instead reproducing just the original equation. The correct equation for the SVIX was retroengineered by comparing charts they published in the paper with charts generated by this pinescript indicator.
For a more complete indicator, see:

TEDong Velocity/Acceleration: Physics Newton LawHi Folg,
In physics, equations of motion are equations that describe the behavior of a physical system in terms of its motion as a function of time.
Kinematics motion is simpler as it concerns only variables derived from the positions of objects, and time. In circumstances of constant acceleration, these simpler equations of motion are usually referred to as the SUVAT equations, arising from the definitions of kinematic quantities: displacement (s), initial velocity (u), final velocity (v), acceleration (a), and time (t).
A differential equation of motion, usually identified as some physical law and applying definitions of physical quantities, is used to set up an equation for the problem. Solving the differential equation will lead to a general solution with arbitrary constants, the arbitrariness corresponding to a family of solutions. A particular solution can be obtained by setting the initial values, which fixes the values of the constants. To state this formally, in general an equation of motion M is a function of the position r of the object, its velocity (the first time derivative of r, v = dr/dt
), and its acceleration (the second derivative of r, a = d2r/dt2), and time t.
The following indikator is called TEDong Velocity/Acceleration, with alert LONG/BUY and SHORT/Sell.
DONATE/TIP
BTC: 13nhMN2H4LoRi4VMcPcyR96jitxrH3uivB

NIBIRU STOCHASTICThe Nibiru Stochastic oscillator is a tweaked version of one of the most popular trading tools - Stochastic Oscillator. It features:
K/D cross signals
Automatically adjusting overbought and oversold zones based on current trend situation
Color change based on trend
Price source selection
Use the link below or PM me to gain access to the indicator.

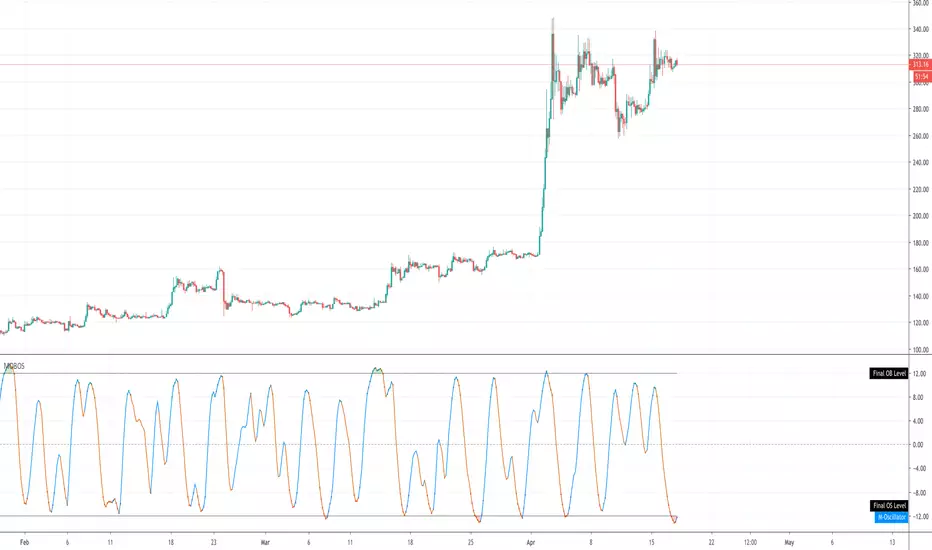
MOBOSThis indicator combines a bunch of overbought / oversold indicators to determine overbought / oversold levels. It is best used like a Stoch RSI and works on all instruments.
Overbought/Oversold IndicatorAggregates 4 indicators with inputs you can specify for overbought / oversold levels. Adds up the signals and you can specify a minimum threshold to signal overbought or oversold. Works for stocks and crypto.