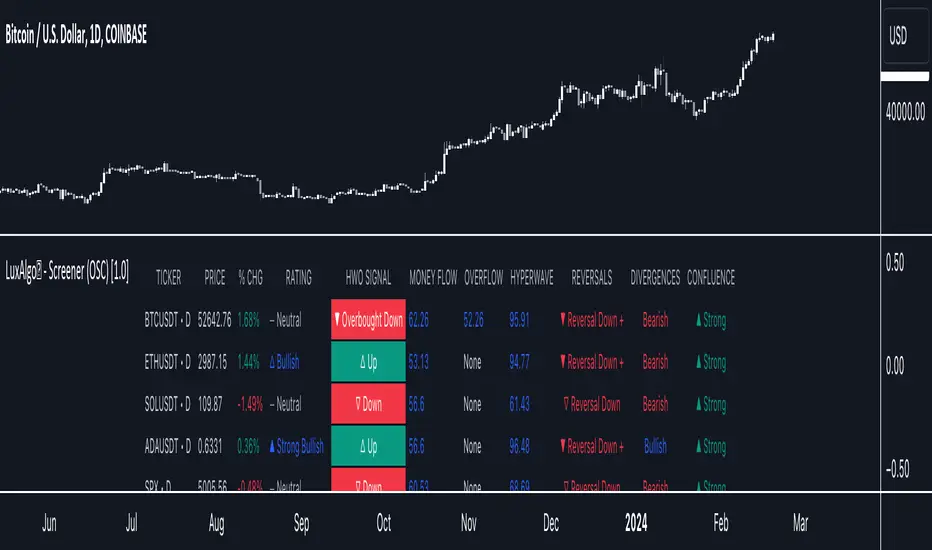
LuxAlgo® - Screener (OSC)The LuxAlgo® - Screener (OSC) is a complete tool allowing users to check returned information from the Oscillator Matrix™ toolkit's features for various user selected tickers and timeframes.
Users can customize the returned information by the screener, as well as filtering out displayed tickers based on custom user set rules.
🔶 FEATURES
Users can place the location of the screener everywhere they want, multiple locations are supported, you can even have it on your chart by drag and dropping the screener to your chart, allowing you to analyze them alongside your favorite indicators.
Keeping track of various tickers is crucial to have a deeper understanding of the overall market activity.
Our screener let you quickly access your preferred information in a convenient way thanks to the described features below:
Screening of the main Oscillator Matrix™ features on up to 10 user selected tickers and timeframes.
Ticker filtering based on custom user set rules.
Ticker sorting based on ascending/descending user selected data returned by the screener.
The LuxAlgo® - Screener (OSC) returns the following information:
Current price
Current volume
Current price percent change (% CHG)
Current price change (CHG)
Current rating
Most recent HyperWave signal
Current Money Flow value
Current Overflow value
Current HyperWave value
Most recent reversal signal
Most recent divergence
Current Confluence status
🔹 Rating
Users can quickly check the overall sentiment based on the screeners returned information by looking at the Rating column. Tickers can be rated as follows:
▲ Strong Bullish (more than 80% of the returned information is bullish)
△ Bullish (60% to 80% of the returned information is bullish)
― Neutral (40% to 60% of the returned information is bullish)
▽ Bearish (20% to 60% of the returned information is bullish)
▼ Strong Bearish (less than 20% of the returned information is bullish)
This can be a quick way to asses the confluence between all the returned information on the screener for a specific ticker.
🔹 Filtering
Thanks to the integrated filtering capabilities of the LuxAlgo® - Screener (OSC) you will be able to keep track of the information from tickers that return specific information you want to see.
For example do you want to only see the information from tickers with bullish money flow?
Nothing easier, all you need is to select the "Above" option in the Money Flow dropdown menu and set the value 50 in the input to the right.
However, you don't have to stop at 1 filtering condition, create more complex ones that fits your trading style for the tickers you truly want to look at!
🔹 Sorting
As traders we want to quickly spot the tickers with most volume, most volatility, with the strongest uptrend or downtrend.
The LuxAlgo® - Screener (OSC) lets you do that by sorting supported information in an ascending or descending order, letting you access the most relevant information faster.
Oscillatormatrix
LuxAlgo - Backtester (OSC)The OSC Backtester is an innovative strategy script that allows users to create a wide variety of strategies using various unique oscillators.
By utilizing our 'Step' and 'Match' algorithms, users can create custom and complex strategy entries from each of the supported oscillators and included conditions, as well as any external sources, allowing users to create entries from a sequence of conditions and/or multiple matching conditions.
We included a complete alert system that will send a notification for each action taken by the strategy and we also allow users to set custom messages for each action taken by a strategy.
🔶 Features
🔹 Step & Match Algorithm
More complex entry rules can be created by using multiple conditions together, this is done thanks to the Step dropdown setting on the right of each condition.
The Step setting is directly related to the Step & Match algorithm and works in two ways:
When two or more conditions have the same step number, both conditions are evaluated. Used to test matching conditions.
When two or more conditions have different step numbers, each conditions will be evaluated in order, testing for the first step and switching to the next step once the previous one is true. When the final step is true the strategy will open a market order. Used to create sequence of conditions.
This operation is complementary, as you can create a sequence of conditions with one step consisting of two or more matching conditions as long as they have the same step number.
🔹 Fully Customizable Entries From Various Oscillators And Conditions
We allow the users to set entries using our unique HyperWave, Smart Money Flow, and their derived conditions as entries.
The Hyper Wave is a normalized adaptive oscillator aiming to reflect price trends without returning a high amount of noise.
The Smart Money Flow aims to detect trends based on market activity, by doing a comparative analysis between current volume and historical volume. A Smart Money Flow above 50 suggest market participants are bullish, else bearish. Derived from this oscillator we have Overflow indications, this indicator detects when market is overbought or oversold based on participants activity.
Other entries include proprietary reversal signals, real-time divergence detection, oscillator confluence (indicating how aligned each oscillator is), as well as entries using external sources.
🔹 Complete Alert System
Users can get alerted for any action executed by a strategy, from opening positions to closing them.
The message field in the Alert Messages setting section allows for the strategy to send a custom alert message depending on the action taken by the strategy, if no messages are set the strategy will send default messages.
🔶 Usage
Users can create a wide variety of strategies from this script, whether they are trend-following or contrarian traders.
Let's see a contrarian (revesal-based) strategy example using the following entry conditions:
Long: Hyperwave bullish divergence and oversold Hyperwave (lower than 20).
Short: Hyperwave bearish divergence and overbought Hyperwave (greater than 20).
We can also introduce take-profit and stop-loss exit conditions based on external indicators, allowing more control over exits in our strategy. For example:
Long: Hyperwave crossing over 50 while money flow is bearish.
Short: Hyperwave crossing under 50 while money flow is bullish.
Exit Long on a profit (long exit tp): Hyperwave crossing 80.
Exit Short on a profit (short exit tp): Hyperwave crossing 20.
While this strategy script can be used as a standalone, we recommend using other indicators creatively to assist with entries and exits as well as TP/SLs.
Our Step & Match algorithm can magnify interoperability, allowing for way more complete strategies through complex conditions, let's demonstrate this using the following entries:
Long: Any bullish reversal occurring after the price crosses over the lowest upper reversal zone of the Signals & Overlays™.
Short: Any bearish reversal occurring after the price crosses under the highest lower reversal zone of the Signals & Overlays™.
Long TP/SL: 5 ATR's away from the entry price.
Short TP/SL: 5 ATR's away from the entry price.
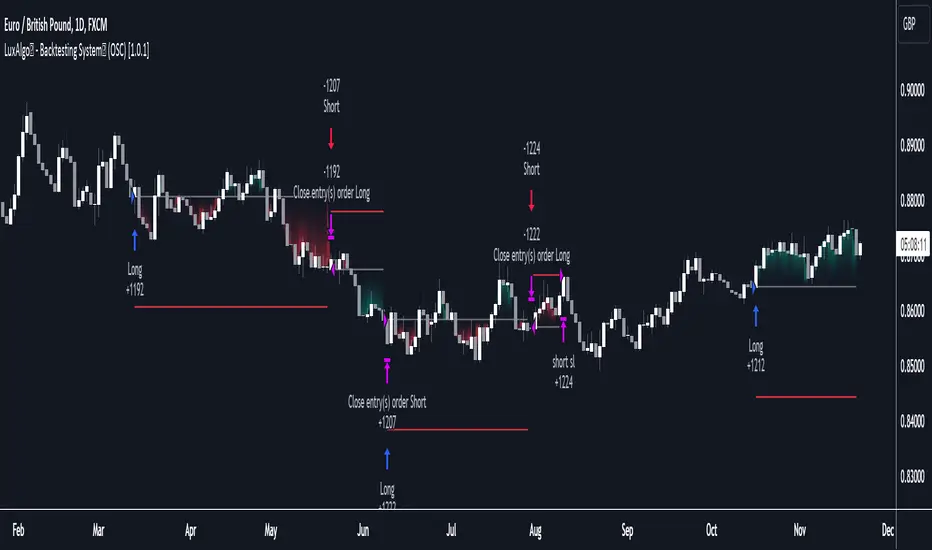
🔶 Strategy Properties (Important)
This script backtest is done on daily EURGBP, using the following backtesting properties:
Balance (default): 10 000 (default base currency)
Order Size: 10% of the equity
Comission: 3.4 pips (average spread for EURGBP)
Slippage: 3 tick
Stop Loss: 0.02 points away from entry price
We use these properties to ensure a realistic preview of the backtesting system, do note that default properties can be different for various reasons described below:
Order Size: 1 contract by default, this is to allow the strategy to run properly on most instruments such as futures.
Comission: Comission can vary depending on the market and instrument, there is no default value that might return realistic results.
We strongly recommend all users to ensure they adjust the Properties within the script settings to be in line with their accounts & trading platforms of choice to ensure results from the strategies built are realistic.
🔶 How To Access
You can see the Author's Instructions below to learn how to get access.
Lune Oscillator Premium⬛️ Overview
Lune Oscillator is an advanced and innovative TradingView indicator designed to enhance your market analysis. Rather than merely improving visuals or merging traditional indicators, it introduces a series of unique features, each with its unique value proposition. This script stands out due to its originality, and the significant utility it brings to traders.
🟦 Features
Oscillator features an assortment of sophisticated tools aimed at refining your trading strategies:
🔹 Trend Oscillator: This feature integrates market trend and momentum analysis into one dynamic oscillator. It's designed to facilitate market trend and momentum analysis, and is invaluable to traders as it combines both trend and momentum analysis into one tool. For instance, if a ticker shows signs of slowing momentum after a recent rally, the Trend Oscillator could predict a potential trend reversal. The Trend Oscillator’s sensitivity and velocity settings can be tailored to suit your trading style and strategy. It is developed using a custom formula similar to WaveTrend but optimized for better detection of trend and momentum shifts.
🔹 Market Peak: Market Peak identifies potential market peaks and troughs using a percentile-based system. It's aimed at detecting overextensions in the Trend Oscillator, indicating potential market reversals. Compact and user-friendly, this feature signals potential trade exit points in case of an impending market reversal. Its sensitivity can be adjusted to react to either short-term or long-term market changes. By analyzing the market's average move, it detects overbought or oversold conditions when the percentage gets too extreme.
🔹 Money Pulse: The Money Pulse feature serves as a radar for money inflow or outflow, helping users detect nascent trends and reversals. It enables traders to spot early opportunities and reversals and align their strategies with institutional and large players. For example, a bullish Money Pulse during market consolidation could signal money influx and the beginning of an accumulation phase. The sensitivity of the Market Pulse can be adapted to short-term or long-term changes. This feature employs an improved version of the Money Flow concept.
🔹 Liquidity Pulse: Liquidity Pulse provides a unique perspective of asset liquidity by tracking market inflow and outflow volumes. It assists traders in understanding the market's liquidity sentiment, which is particularly useful for long-term trades and confluence. For instance, a bullish Liquidity Pulse could signal abundant liquidity, potentially driving up the price. The sensitivity setting can be adjusted for short-term or long-term liquidity changes. This feature utilizes an enhanced version of the On-Balance Volume concept.
🔹 Institutional Wave: This feature tracks the cumulative inflow and outflow for a specific ticker, helping traders monitor institutional money flows. It enables the analysis of a ticker's accumulation and distribution, assisting in detecting early trade entries and avoiding dumps. For example, a decrease in volume during consolidation after a price rally could indicate sell-off and potential price drop. The Institutional Wave's sensitivity can be adapted to either short-term or long-term changes. It operates on the Accumulation and Distribution concept.
🔹 Power Wave: The Power Wave evaluates market strength and momentum, indicating market power shifts. It helps traders understand the true power behind a market move. For instance, a decreasing Power Wave during a bullish move could indicate a weakening trend, suggesting a bearish strategy instead. The sensitivity of the Power Wave can be set for short-term or long-term market changes. The Power Wave calculates market strength by evaluating price change volatility.
🔹 Market Pressure: This feature detects shifts in buy and sell pressure, signaling potential turning points. It helps traders understand the power balance in the market. For example, a bullish Market Pressure shift during a short trade could suggest a momentum gain by bulls, indicating a trade exit. The Market Pressure's sensitivity can be adjusted for short-term or long-term changes. This feature uses volume data and moving averages to detect market pressure shifts, filtering out false and volatile signals.
🔹 Oscillator Copilot: Incorporating Smart Bias and Reversal Radar, the Oscillator Copilot helps identify market trends and potential reversals. It searches for confluence within multiple Oscillator features, providing a straightforward assistive tool. For example, a bullish Smart Bias signal during a long trade could suggest staying in the trade longer, while a bearish Reversal Radar signal could indicate the need to exit the trade.
🔹 Divergence Detection: This feature offers a sophisticated detection system for both regular and hidden market divergences, providing additional confluence and highlighting hard-to-detect divergences. For instance, a bullish Regular Divergence could signal a potential trade entry or exit depending on your overall market sentiment and bias. This feature uses fractals to effectively detect divergences in the market based on the Trend Oscillator.
🔹 Color Themes: Personalize your charting experience with various color themes. This feature enhances the visual appeal of your chart, offering easy setup and use. For example, use the “Ice” theme for a unique and colorful experience or the “Dark” theme for a more subdued look. Themes available include Default, Light, Dark, and Ice. This feature modifies the colors of your candles and features based on the selected theme.
These features and tools collectively offer a comprehensive solution for traders to understand and navigate the financial markets. It's important to remember that they are designed to assist in making informed trading decisions and should be used as part of a balanced trading strategy.
🟧 Usage
Lune Oscillator's features are designed to be both standalone tools and components of a larger, integrated trading strategy. It is important to understand each feature and experiment with different configurations to best suit your unique trading needs.
🔸 Example #1: The following demonstrates how the Oscillator Copilot can be an excellent trade assistant.
The Oscillator Copilot leverages multiple Lune Oscillator features, allowing traders to quickly assess overall market sentiment. It uses Smart Bias and Reversal Radar tools to deliver these insights. For instance, at point 1, a bullish Smart Bias (denoted by a green circle) represents a collective bullish sentiment from multiple components of Lune Oscillator, often leading to a price increase. Conversely, at point 2, we identify two bearish reversal signals from the Reversal Radar (highlighted by red triangles). This convergence of bearish signals from multiple components hints at a potential market reversal, often followed by a gradual price decline.
🔸 Example #2: This example shows how the Market Peak feature can aid in detecting potential market tops and bottoms.
Market Peak calculates how overbought or oversold a ticker is using a percentile system, offering insights into potential reversals. At points 1 and 2, we observe bearish Market Peaks suggesting overbought conditions and indicating a possible shift in trend. Subsequent to these peaks, we witness a price drop, mirroring the overbought market conditions. In contrast, at point 3, a bullish Market Peak suggests an oversold market, indicating a potential trend reversal and subsequent price increase.
🔸 Example #3: This is an example of how combining various features such as the Money Pulse, Liquidity Pulse, Institutional Wave, and Market Peak, can help make more informed trades.
Money Pulse and Liquidity Pulse provide insights into the money and liquidity flow in the market, respectively, while the Institutional Wave monitors the cumulative volume shifts and changes. Together with Market Peak, they offer a comprehensive view of the market's state.
At point 1, the positive Liquidity Wave (crossing above 0) suggests a bullish market volume. At point 2, a bullish Market Pressure indicates an increase in buying pressure, reinforcing the bullish sentiment. At point 3, a negative Liquidity Wave (crossing below 0) indicates a bearish sentiment, suggesting that market participants are exiting their positions. The concurrent Market Pressure hints at an increase in selling activity. Taking all these factors into account provides a strong indicator that the market sentiment has turned bearish.
🟥 Conclusion
Lune Oscillator aims to provide a suite of tools that bring unique value to traders. Each feature is designed to offer different, yet complementary, perspectives on the market, allowing users to piece together a more comprehensive understanding of their trading environment.
🔻 Access
You can see the Author's instructions below to get instant access to this indicator & our Premium Suite.
🔻 Disclaimer
Lune Oscillator is a tool for aiding in market analysis and is not a guarantee of future market performance or individual trading success. We strongly recommend that users combine our tool with their trading strategies and do their due diligence before making any trading decisions.
Remember, past performance is not indicative of future results. Please trade responsibly.
