• Products
  • Community
  • Markets
  • Brokers
  • More
Get started
  • Indicators and strategies
  • /PACE

PACE

Tape SpeedChoose a long term averaging period (minutes) and a short term averaging period (seconds) The indicator will begin loading ticks for the duration of the specified longer term averaging period. ex: If the indicator is set to have a long term average of 10min, you must run the indicator for 10min first for it to begin its averaging process. When the required duration of ticks have loaded, it will display the average time elapsed between each tick during that time. It will also continue to read incoming ticks and calculate new averages once the initial load is finished. 
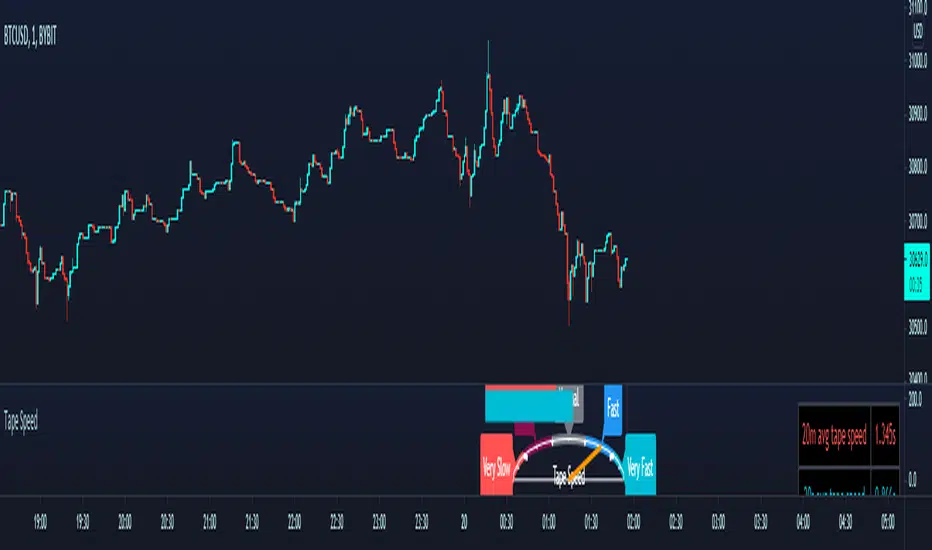
The longer term average is displayed as a static red horizontal bar, the entire speedomter gauge, and the value is also explicitly stated in the top right corner with the table. The blue bar, the needle, and the bottom row of the table are all representations of the shorter term period's average time between ticks. The shorter term average is compared against the longer term average to determine whether the short term incoming orders are coming in more aggressively/less aggressively or normally compared to the longer period's average. ___________________________________________________________ Thanks to user rumpypumpydumpy for giving me permission to use his semicircle logic from his "Speedometer Toolbox" to display my own data.
Pine Script® indicator
by Chonky_
Updated
3838

Select market data provided by ICE Data Services. Select reference data provided by FactSet. Copyright © 2025 FactSet Research Systems Inc.Copyright © 2025, American Bankers Association. CUSIP Database provided by FactSet Research Systems Inc. All rights reserved. SEC fillings and other documents provided by Quartr.© 2025 TradingView, Inc.

More than a product
  • Supercharts
Screeners
  • Stocks
  • ETFs
  • Bonds
  • Crypto coins
  • CEX pairs
  • DEX pairs
  • Pine
Heatmaps
  • Stocks
  • ETFs
  • Crypto
Calendars
  • Economic
  • Earnings
  • Dividends
More products
  • Yield Curves
  • Options
  • News Flow
  • Pine Script®
Apps
  • Mobile
  • Desktop
Community
  • Social network
  • Wall of Love
  • Refer a friend
  • House Rules
  • Moderators
  • Space recap 2025
Ideas
  • Trading
  • Education
  • Editors' picks
Pine Script
  • Indicators & strategies
  • Wizards
  • Freelancers
Tools & subscriptions
  • Features
  • Pricing
  • Market data
  • Gift plans
Trading
  • Overview
  • Brokers
Special offers
  • CME Group futures
  • Eurex futures
  • US stocks bundle
About company
  • Who we are
  • Space mission
  • Blog
  • Careers
  • Media kit
Merch
  • TradingView store
  • Tarot cards for traders
  • The C63 TradeTime
Policies & security
  • Terms of Use
  • Disclaimer
  • Privacy Policy
  • Cookies Policy
  • Accessibility Statement
  • Security tips
  • Bug Bounty program
  • Status page
Business solutions
  • Widgets
  • Charting libraries
  • Lightweight Charts™
  • Advanced Charts
  • Trading Platform
Growth opportunities
  • Advertising
  • Brokerage integration
  • Partner program
  • Education program
Community
  • Social network
  • Wall of Love
  • Refer a friend
  • House Rules
  • Moderators
  • Space recap 2025
Ideas
  • Trading
  • Education
  • Editors' picks
Pine Script
  • Indicators & strategies
  • Wizards
  • Freelancers
Business solutions
  • Widgets
  • Charting libraries
  • Lightweight Charts™
  • Advanced Charts
  • Trading Platform
Growth opportunities
  • Advertising
  • Brokerage integration
  • Partner program
  • Education program
Look FirstLook First