Indicators and strategies
Volume Orderblock Breakout — Naaganeunja Lite v3.6Upgrade for stable signals when candle is finished it stay forever, no signal same side
you can not be confused about signal so we can play with trading
FUCKING fantastic trading

Tamil | Trend Signal Dashboard for trading“Tamil | Trend Signal in Dashboard” is a multi-confirmation trend and signal tool that combines Supertrend, RSI/ADX trend strength, and dual QQE into one clean dashboard on the chart. It only prints STRONG BUY / STRONG SELL when all components align, and it also gives clear, rule-based exit signals.
⸻
What it uses
• RSI + ADX + ATR trend block
• ADX (with custom length & threshold) to measure trend strength
• +DI / –DI to define bullish or bearish direction
• Optional session filter so signals only appear in your trading window
• Custom Supertrend
• ATR-based bands with adjustable period & multiplier
• Plots trend line on chart and shows Buy/Sell flip labels when Supertrend reverses
• Dual QQE MOD engine
• Two QQE/RSI streams (primary & secondary)
• Bollinger bands around QQE line to confirm true momentum breakouts
• Defines QQE Bullish / Bearish states
• Secondary RSI Histogram logic
• Tracks RSI distance from the 50 line
• Detects “peak & decline” on the histogram for momentum-based exits
⸻
Signals & Exits
• Entry
• Strong Buy: Supertrend bullish + strong ADX + DI bullish + QQE bullish
• Strong Sell: Supertrend bearish + strong ADX + DI bearish + QQE bearish
• Background is softly colored green/red while alignment is active
• Exit (configurable)
• Alignment lost (trend components no longer agree), and/or
• First peak-and-decline in the secondary RSI histogram
• Shows Exit Buy / Exit Sell markers and fires dedicated alerts
⸻
Dashboard & Alerts
A compact table in the top-right shows live status of:
• Supertrend
• ADX value & strength check
• Direction from DI
• QQE state
• Secondary RSI histogram slope
• Overall Alignment and current Signal (Hold / Strong Buy / Strong Sell / Exit)

SMC N-Gram Probability Matrix [PhenLabs]📊 SMC N-Gram Probability Matrix
Version: PineScript™ v6
📌 Description
The SMC N-Gram Probability Matrix applies computational linguistics methodology to Smart Money Concepts trading. By treating SMC patterns as a discrete “alphabet” and analyzing their sequential relationships through N-gram modeling, this indicator calculates the statistical probability of which pattern will appear next based on historical transitions.
Traditional SMC analysis is reactive—traders identify patterns after they form and then anticipate the next move. This indicator inverts that approach by building a transition probability matrix from up to 5,000 bars of pattern history, enabling traders to see which SMC formations most frequently follow their current market sequence.
The indicator detects and classifies 11 distinct SMC patterns including Fair Value Gaps, Order Blocks, Liquidity Sweeps, Break of Structure, and Change of Character in both bullish and bearish variants, then tracks how these patterns transition from one to another over time.
🚀 Points of Innovation
First indicator to apply N-gram sequence modeling from computational linguistics to SMC pattern analysis
Dynamic transition matrix rebuilds every 50 bars for adaptive probability calculations
Supports bigram (2), trigram (3), and quadgram (4) sequence lengths for varying analysis depth
Priority-based pattern classification ensures higher-significance patterns (CHoCH, BOS) take precedence
Configurable minimum occurrence threshold filters out statistically insignificant predictions
Real-time probability visualization with graphical confidence bars
🔧 Core Components
Pattern Alphabet System: 11 discrete SMC patterns encoded as integers for efficient matrix indexing and transition tracking
Swing Point Detection: Uses ta.pivothigh/pivotlow with configurable sensitivity for non-repainting structure identification
Transition Count Matrix: Flattened array storing occurrence counts for all possible pattern sequence transitions
Context Encoder: Converts N-gram pattern sequences into unique integer IDs for matrix lookup
Probability Calculator: Transforms raw transition counts into percentage probabilities for each possible next pattern
🔥 Key Features
Multi-Pattern SMC Detection: Simultaneously identifies FVGs, Order Blocks, Liquidity Sweeps, BOS, and CHoCH formations
Adjustable N-Gram Length: Choose between 2-4 pattern sequences to balance specificity against sample size
Flexible Lookback Range: Analyze anywhere from 100 to 5,000 historical bars for matrix construction
Pattern Toggle Controls: Enable or disable individual SMC pattern types to customize analysis focus
Probability Threshold Filtering: Set minimum occurrence requirements to ensure prediction reliability
Alert Integration: Built-in alert conditions trigger when high-probability predictions emerge
🎨 Visualization
Probability Table: Displays current pattern, recent sequence, sample count, and top N predicted patterns with percentage probabilities
Graphical Probability Bars: Visual bar representation (█░) showing relative probability strength at a glance
Chart Pattern Markers: Color-coded labels placed directly on price bars identifying detected SMC formations
Pattern Short Codes: Compact notation (F+, F-, O+, O-, L↑, L↓, B+, B-, C+, C-) for quick pattern identification
Customizable Table Position: Place probability display in any corner of your chart
📖 Usage Guidelines
N-Gram Configuration
N-Gram Length: Default 2, Range 2-4. Lower values provide more samples but less specificity. Higher values capture complex sequences but require more historical data.
Matrix Lookback Bars: Default 500, Range 100-5000. More bars increase statistical significance but may include outdated market behavior.
Min Occurrences for Prediction: Default 2, Range 1-10. Higher values filter noise but may reduce prediction availability.
SMC Detection Settings
Swing Detection Length: Default 5, Range 2-20. Controls pivot sensitivity for structure analysis.
FVG Minimum Size: Default 0.1%, Range 0.01-2.0%. Filters insignificant gaps.
Order Block Lookback: Default 10, Range 3-30. Bars to search for OB formations.
Liquidity Sweep Threshold: Default 0.3%, Range 0.05-1.0%. Minimum wick extension beyond swing points.
Display Settings
Show Probability Table: Toggle the probability matrix display on/off.
Show Top N Probabilities: Default 5, Range 3-10. Number of predicted patterns to display.
Show SMC Markers: Toggle on-chart pattern labels.
✅ Best Use Cases
Anticipating continuation or reversal patterns after liquidity sweeps
Identifying high-probability BOS/CHoCH sequences for trend trading
Filtering FVG and Order Block signals based on historical follow-through rates
Building confluence by comparing predicted patterns with other technical analysis
Studying how SMC patterns typically sequence on specific instruments or timeframes
⚠️ Limitations
Predictions are based solely on historical pattern frequency and do not account for fundamental factors
Low sample counts produce unreliable probabilities—always check the Samples display
Market regime changes can invalidate historical transition patterns
The indicator requires sufficient historical data to build meaningful probability matrices
Pattern detection uses standardized parameters that may not capture all institutional activity
💡 What Makes This Unique
Linguistic Modeling Applied to Markets: Treats SMC patterns like words in a language, analyzing how they “flow” together
Quantified Pattern Relationships: Transforms subjective SMC analysis into objective probability percentages
Adaptive Learning: Matrix rebuilds periodically to incorporate recent pattern behavior
Comprehensive SMC Coverage: Tracks all major Smart Money Concepts in a unified probability framework
🔬 How It Works
1. Pattern Detection Phase
Each bar is analyzed for SMC formations using configurable detection parameters
A priority hierarchy assigns the most significant pattern when multiple detections occur
2. Sequence Encoding Phase
Detected patterns are stored in a rolling history buffer of recent classifications
The current N-gram context is encoded into a unique integer identifier
3. Matrix Construction Phase
Historical pattern sequences are iterated to count transition occurrences
Each context-to-next-pattern transition increments the appropriate matrix cell
4. Probability Calculation Phase
Current context ID retrieves corresponding transition counts from the matrix
Raw counts are converted to percentages based on total context occurrences
5. Visualization Phase
Probabilities are sorted and the top N predictions are displayed in the table
Chart markers identify the current detected pattern for visual reference
💡 Note:
This indicator performs best when used as a confluence tool alongside traditional SMC analysis. The probability predictions highlight statistically common pattern sequences but should not be used as standalone trading signals. Always verify predictions against price action context, higher timeframe structure, and your overall trading plan. Monitor the sample count to ensure predictions are based on adequate historical data.

Advanced Breakout System v2.0Advanced Breakout System v2.0
Developed by: Mohammed Bedaiwi
This script hunts for high-probability breakouts by combining price consolidation zones, volume spikes vs. average volume, smart money flow (OBV), and a Momentum Override for explosive moves that skip consolidation. Additionally, it automatically identifies and plots Support and Resistance levels with price labels to help you visualize market structure.
The system follows a "Watch & Confirm" logic: it first prints a WATCH setup, then a BUY only if price confirms strength.
💡 JUSTIFICATION OF CONCEPTS (MASHUP & ORIGINALITY)
This script is an original mashup combining several analytical concepts to address common breakout failures:
Volatility Compression Engine: Uses built-in functions like ta.highest() and ta.lowest() to mathematically define the setup phase where price volatility is compressed below a user-defined threshold.
Volume Spike Confirmation: The breakout must be confirmed by a volume increase greater than a moving average of volume, signaling strong market interest.
Smart Volume Filter (OBV): This is the key component. By checking if ta.obv is above its own Moving Average, we confirm that accumulation has been occurring during the consolidation period, suggesting institutional positioning before the price break.
Multi-Exit Risk System: Employs dynamic exits (EMA cross, volume dump, bearish pattern) instead of static stop-losses to manage risk adaptively based on real-time market action.
Market Structure Visualization: The script also includes a Support & Resistance engine to plot key swing pivots and price labels for visual context.
✅ STRATEGY RESULTS & POLICY COMPLIANCE
To ensure non-misleading and transparent backtesting results, this strategy is published with the following fully compliant properties:
Dataset Compliance: The backtest is performed on the CMTL Daily (1D) chart across a long history, generating 201 total trades. This significantly exceeds the minimum requirement of 100 trades, providing a robust test dataset.
Risk Control: The strategy uses a conservative order size set to 2% of equity (default_qty_value=2), strictly adhering to the sustainable risk recommendation of 5-10% of equity per trade.
Transaction Costs: Realistic trading conditions are modeled using 0.07% commission and 3 ticks slippage to prevent the overestimation of profitability.
⚙️ VISUAL GUIDE & SIGNAL LOGIC
Key Color Legend (Visual Guide):
WATCH – Setup (Yellow Arrow Down): Potential breakout setup detected.
BUY – Confirmation (Green Arrow Up): Confirmed breakout, triggered when price trades above the high of the WATCH candle.
SELL – Break (Orange Arrow): Short-term trend weakness, triggered when price closes below the Fast EMA (9).
SELL – Dump (Dark Red Arrow): Distribution / volume dump, triggered by a bearish candle with abnormally high volume.
SELL – Pattern (Purple Arrow): Bearish price-action pattern (such as a bearish engulfing).
Support & Resistance Lines (Red/Green): Small horizontal lines plotted at key swing points with exact price labels.
⌨️ INPUTS (DEFAULT SETTINGS)
Entry settings: Consolidation Lookback (default 20) = bars used to detect consolidation. Consolidation Range % (default 12%) = max allowed range size. Volume Spike Multiplier (default 1.2) = factor above average volume to count as a spike. Force Signal on Big Moves (default ON) = forces a WATCH signal on high-momentum moves.
Exit settings: Enable Fast Exit (EMA 9) toggles the SELL – Break signal. Dump Volume Multiplier defines what counts as “dump” volume.
Support & Resistance: Adjustable Pivot Left/Right bars control the sensitivity of the support and resistance lines.
⚠️ Disclaimer Trading involves significant risk of loss. This script is for educational and informational purposes only and is not financial advice or a recommendation to buy or sell any asset. BUY and SELL signals are rule-based and derived from historical behavior and do not guarantee future performance. Always use your own analysis and risk management. This is an open-source strategy; users are encouraged to test it across different symbols and timeframes.

ueuito Trend Strength LSMA-BasedAnother experience.... still improving
Indicator Description (English)
Name: Trend Strength LSMA-Based
Overview:
This indicator is designed to measure the strength and exhaustion of a trend based on the Least Squares Moving Average (LSMA). It combines price, trend slope, volume, and volatility to calculate a trend exhaustion score, which is then smoothed and visualized as a colored area on the chart. The indicator also plots discrete points to signal potential reversals or decreases in trend intensity.
Key Features:
LSMA-Based Trend Strength:
Calculates a Least Squares Moving Average (LSMA) of the selected timeframe.
Measures the slope of the LSMA to capture trend direction and momentum.
Trend Exhaustion Score:
Combines multiple factors:
Distance between price and LSMA
LSMA slope (trend strength)
Volume relative to its moving average
ATR-based volatility
Each factor is weighted according to user-defined inputs.
The combined score is multiplied to produce a scaled trend exhaustion value.
Smoothed Area Plot:
The trend exhaustion score is smoothed using an EMA to reduce noise.
Displayed as a colored area that changes based on trend strength:
Strong bullish exhaustion → dark green
Weak bullish exhaustion → light green
Strong bearish exhaustion → dark red
Weak bearish exhaustion → light red
Neutral → gray
Dynamic Visual Cues:
Points for reversals: small green/red circles appear when the trend changes direction.
Points for intensity decrease: small green/red circles appear when the trend weakens but has not yet reversed.
The area’s color intensity dynamically reflects the strength of the trend exhaustion, making it visually intuitive.
Multi-Timeframe Support:
The indicator can calculate the trend exhaustion based on a different timeframe from the chart, allowing for higher timeframe trend analysis on lower timeframe charts.
Customizable Settings:
LSMA period, smoothing length, volume period, ATR period
Weighting for each factor in the score calculation
Thresholds for weak/strong exhaustion
Timeframe selection
Usage:
Identify when a trend is losing strength or approaching a potential reversal.
Helps visualize the current momentum and exhaustion of bullish or bearish trends.
Can be used in conjunction with other technical tools for confirming entries or exits.
Important Note:
Depending on the asset, market volatility, and timeframe, it may be necessary to adjust the indicator settings to optimize its responsiveness and accuracy. The default parameters provide a general starting point but fine-tuning is recommended for best results.


market condition by moving averagewhen the 10ma and 20ma of S&P is sloping up, the indicator will show a green background, which means breakout trade has a higher chance of working out.

EMA Divergence Color CandlesThis indicator colors candles based on their position relative to the EMA and the strength of the divergence.
Above EMA → Blue (bullish zone)
Below EMA → Red (bearish zone)
Divergence strength is shown in 3 color levels:
Weak (close to EMA)
Medium
Strong (far from EMA)
The indicator draws its own candles, so no TradingView settings need to be changed.
The EMA line is also shown on top of the custom candles.

ALT Risk Metric StrategyHere's a professional write-up for your ALT Risk Strategy script:
ALT/BTC Risk Strategy - Multi-Crypto DCA with Bitcoin Correlation Analysis
Overview
This strategy uses Bitcoin correlation as a risk indicator to time entries and exits for altcoins. By analyzing how your chosen altcoin performs relative to Bitcoin, the strategy identifies optimal accumulation periods (when alt/BTC is oversold) and profit-taking opportunities (when alt/BTC is overbought). Perfect for traders who want to outperform Bitcoin by strategically timing altcoin positions.
Key Innovation: Why Alt/BTC Matters
Most traders focus solely on USD price, but Alt/BTC ratios reveal true altcoin strength:
When Alt/BTC is low → Altcoin is undervalued relative to Bitcoin (buy opportunity)
When Alt/BTC is high → Altcoin has outperformed Bitcoin (take profits)
This approach captures the rotation between BTC and alts that drives crypto cycles
Key Features
📊 Advanced Technical Analysis
RSI (60% weight): Primary momentum indicator on weekly timeframe
Long-term MA Deviation (35% weight): Measures distance from 150-period baseline
MACD (5% weight): Minor confirmation signal
EMA Smoothing: Filters noise while maintaining responsiveness
All calculations performed on Alt/BTC pairs for superior market timing
💰 3-Tier DCA System
Level 1 (Risk ≤ 70): Conservative entry, base allocation
Level 2 (Risk ≤ 50): Increased allocation, strong opportunity
Level 3 (Risk ≤ 30): Maximum allocation, extreme undervaluation
Continuous buying: Executes every bar while below threshold for true DCA behavior
Cumulative sizing: L3 triggers = L1 + L2 + L3 amounts combined
📈 Smart Profit Management
Sequential selling: Must complete L1 before L2, L2 before L3
Percentage-based exits: Sell portions of position, not fixed amounts
Auto-reset on re-entry: New buy signals reset sell progression
Prevents premature full exits during volatile conditions
🤖 3Commas Automation
Pre-configured JSON webhooks for Custom Signal Bots
Multi-exchange support: Binance, Coinbase, Kraken, Bitfinex, Bybit
Flexible quote currency: USD, USDT, or BUSD
Dynamic order sizing: Automatically adjusts to your tier thresholds
Full webhook documentation compliance
🎨 Multi-Asset Support
Pre-configured for popular altcoins:
ETH (Ethereum)
SOL (Solana)
ADA (Cardano)
LINK (Chainlink)
UNI (Uniswap)
XRP (Ripple)
DOGE
RENDER
Custom option for any other crypto
How It Works
Risk Metric Calculation (0-100 scale):
Fetches weekly Alt/BTC price data for stability
Calculates RSI, MACD, and deviation from 150-period MA
Normalizes MACD to 0-100 range using 500-bar lookback
Combines weighted components: (MACD × 0.05) + (RSI × 0.60) + (Deviation × 0.35)
Applies 5-period EMA smoothing for cleaner signals
Color-Coded Risk Zones:
Green (0-30): Extreme buying opportunity - Alt heavily oversold vs BTC
Lime/Yellow (30-70): Accumulation range - favorable risk/reward
Orange (70-85): Caution zone - consider taking initial profits
Red/Maroon (85-100+): Euphoria zone - aggressive profit-taking
Entry Logic:
Buys execute every candle when risk is below threshold
As risk decreases, position sizing automatically scales up
Example: If risk drops from 60→25, you'll be buying at L1 rate until it hits 50, then L2 rate, then L3 rate
Exit Logic:
Sells only trigger when in profit AND risk exceeds thresholds
Sequential execution ensures partial profit-taking
If new buy signal occurs before all sells complete, sell levels reset to L1
Configuration Guide
Choosing Your Altcoin:
Select crypto from dropdown (or use CUSTOM for unlisted coins)
Pick your exchange
Choose quote currency (USD, USDT, BUSD)
Risk Metric Tuning:
Long Term MA (default 150): Higher = more extreme signals, Lower = more frequent
RSI Length (default 10): Lower = more volatile, Higher = smoother
Smoothing (default 5): Increase for less noise, decrease for faster reaction
Buy Settings (Aggressive DCA Example):
L1 Threshold: 70 | Amount: $5
L2 Threshold: 50 | Amount: $6
L3 Threshold: 30 | Amount: $7
Total L3 buy = $18 per candle when deeply oversold
Sell Settings (Balanced Exit Example):
L1: 70 threshold, 25% position
L2: 85 threshold, 35% position
L3: 100 threshold, 40% position (final exit)
3Commas Setup
Bot Configuration:
Create Custom Signal Bot in 3Commas
Set trading pair to your altcoin/USD (e.g., ETH/USD, SOL/USDT)
Order size: Select "Send in webhook, quote" to use strategy's dollar amounts
Copy Bot UUID and Secret Token
Script Configuration:
Paste credentials into 3Commas section inputs
Check "Enable 3Commas Alerts"
Save and apply to chart
TradingView Alert:
Create Alert → Condition: "alert() function calls only"
Webhook URL: api.3commas.io
Enable "Webhook URL" checkbox
Expiration: Open-ended
Strategy Advantages
✅ Outperform Bitcoin: Designed specifically to beat BTC by timing alt rotations
✅ Capture Alt Seasons: Automatically accumulates when alts lag, sells when they pump
✅ Risk-Adjusted Sizing: Buys more when cheaper (better risk/reward)
✅ Emotional Discipline: Systematic approach removes fear and FOMO
✅ Multi-Asset: Run same strategy across multiple altcoins simultaneously
✅ Proven Indicators: Combines RSI, MACD, and MA deviation - battle-tested tools
Backtesting Insights
Optimal Timeframes:
Daily chart: Best for backtesting and signal generation
Weekly data is fetched internally regardless of display timeframe
Historical Performance Characteristics:
Accumulates heavily during bear markets and BTC dominance periods
Captures explosive altcoin rallies when BTC stagnates
Sequential selling preserves capital during extended downtrends
Works best on established altcoins with multi-year history
Risk Considerations:
Requires capital reserves for extended accumulation periods
Some altcoins may never recover if fundamentals deteriorate
Past correlation patterns may not predict future performance
Always size positions according to personal risk tolerance
Visual Interface
Indicator Panel Displays:
Dynamic color line: Green→Lime→Yellow→Orange→Red as risk increases
Horizontal threshold lines: Dashed lines mark your buy/sell levels
Entry/Exit labels: Green labels for buys, Orange/Red/Maroon for sells
Real-time risk value: Numerical display on price scale
Customization:
All threshold lines are adjustable via inputs
Color scheme clearly differentiates buy zones (green spectrum) from sell zones (red spectrum)
Line weights emphasize most extreme thresholds (L3 buy and L3 sell)
Strategy Philosophy
This strategy is built on the principle that altcoins move in cycles relative to Bitcoin. During Bitcoin rallies, alts often bleed against BTC (high sell, accumulate). When Bitcoin consolidates, alts pump (take profits). By measuring risk on the Alt/BTC chart instead of USD price, we time these rotations with precision.
The 3-tier system ensures you're always averaging in at better prices and scaling out at better prices, maximizing your Bitcoin-denominated returns.
Advanced Tips
Multi-Bot Strategy:
Run this on 5-10 different altcoins simultaneously to:
Diversify correlation risk
Capture whichever alt is pumping
Smooth equity curve through rotation
Pairing with BTC Strategy:
Use alongside the BTC DCA Risk Strategy for complete portfolio coverage:
BTC strategy for core holdings
ALT strategies for alpha generation
Rebalance between them based on BTC dominance
Threshold Calibration:
Check 2-3 years of historical data for your chosen alt
Note where risk metric sat during major bottoms (set buy thresholds)
Note where it peaked during euphoria (set sell thresholds)
Adjust for your risk tolerance and holding period
Credits
Strategy Development & 3Commas Integration: Claude AI (Anthropic)
Technical Analysis Framework: RSI, MACD, Moving Average theory
Implementation: pommesUNDwurst
Disclaimer
This strategy is for educational purposes only. Cryptocurrency trading involves substantial risk of loss. Altcoins are especially volatile and many fail completely. The strategy assumes liquid markets and reliable Alt/BTC price data. Always do your own research, understand the fundamentals of any asset you trade, and never risk more than you can afford to lose. Past performance does not guarantee future results. The authors are not financial advisors and assume no liability for trading decisions.
Additional Warning: Using leverage or trading illiquid altcoins amplifies risk significantly. This strategy is designed for spot trading of established cryptocurrencies with deep liquidity.
Tags: Altcoin, Alt/BTC, DCA, Risk Metric, Dollar Cost Averaging, 3Commas, ETH, SOL, Crypto Rotation, Bitcoin Correlation, Automated Trading, Alt Season
Feel free to modify any sections to better match your style or add specific backtesting results you've observed! 🚀Claude is AI and can make mistakes. Please double-check responses. Sonnet 4.5

OHLC HistoryOHLC History is a Pine Script v6 overlay that snapshots up to 32 historical OHLC-derived levels from a selectable higher (or different) timeframe and projects them onto the active chart. It uses request.security to fetch the chosen source (Close/High/Low/Open), rounds each value to the instrument’s minimum tick, and stores them in an array. A “Max Number Lookback” input limits how many of those levels are rendered. For each retained level the script draws a horizontal line extended both ways, coloring it dynamically based on whether the level is above (customizable “above” color) or below (customizable “below” color) the current price, and places compact labels (01–32) with optional price text offset by a user-defined label distance. Prior bar artifacts (lines and labels) are explicitly deleted each update to keep the chart clean, while small white plot markers ensure the levels appear in the price scale and data window for quick reference.

Volume Orderblock Breakout — Naaganeunja Lite v3.6Upgrade for stable signals when candle is finished it stay forever
you can not be confused about signal so we can play with trading
FUCKING fantastic trading

MACD Momentum Pro MACD Momentum Pro is an enhanced version of the classic MACD designed to help traders identify momentum strength with far greater clarity.
In addition to the traditional MACD line, Signal line, and histogram, this tool introduces two new momentum-intensity alerts:
• Strong Green – bullish momentum accelerating above the zero line
• Strong Red – bearish momentum accelerating below the zero line
These conditions allow traders to quickly spot when market pressure is truly strengthening, reducing noise and improving decision-making in trending environments.
The indicator also includes real-time alerts for:
• MACD/Signal crosses (bullish & bearish)
• MACD zero-line crosses
• Shifts between rising/falling histogram states
All moving averages (EMA or SMA) are fully customizable, and the visual histogram automatically adapts color to reflect momentum transitions.
Whether you are trading breakouts, trend reversals, or momentum continuation setups, this upgraded MACD version provides a clearer, more actionable view of market strength—while keeping the original MACD logic intact.

ORB (Opening Range Bound) / VP (Volume Profile)This script is designed for intraday traders who rely on session momentum and volume context to make decisions. It combines two robust market concepts—the Opening Range Breakout (ORB) and Volume Profile (VP)—into a single, highly customizable toolkit. By overlaying price momentum (ORB) with volume consensus (VP), traders can identify high-probability breakout targets and key support/resistance levels simultaneously.
1. Opening Range Breakout (ORB)
The Opening Range Breakout is a momentum strategy that uses the first period of a trading session (e.g., the first 15 or 30 minutes) to define the day's likely trend and volatility.
How it works:
Session Definition: The script allows you to define a specific "Market Session" (default 09:30–16:00) and an "Opening Range Timeframe" (default 15 minutes).
The Range: Once the opening timeframe concludes, the script automatically draws the High and Low of that period. The space between these lines is often considered a "chop zone" or "no-trade zone."
Breakout Targets (Extensions): The script projects "Extension Levels" above and below the range. These are calculated as percentages of the opening range size (50%, 100%, 150%, 200%). Example: If the opening range is 10 points wide, the 100% extension will be 10 points above the high. These extensions serve as dynamic Take Profit targets or resistance levels during a trend day.
2. Volume Profile & Point of Control (POC)
While the ORB tracks price action, the Volume Profile tracks auction theory—specifically, where volume has been transacted most heavily over the recent price history.
How it works:
Lookback Period: Unlike fixed-session profiles, this script uses a rolling lookback period (defined by "Number of Bars", default 200). This allows you to see the immediate volume context for the current price action regardless of the time of day.
Point of Control (POC): The script highlights the price level with the highest traded volume in bright red (customizable). The POC acts as a "magnet" for price; price often reverts to the POC in ranging markets or bounces off it in trending markets.
Value Area: The profile highlights the "Value Area" (default 70%), which represents the price range where 70% of the trading activity occurred. Breakouts from the Value Area often signal a shift in market sentiment.
Up/Down Volume Split: The profile bars are split into two colors to visualize buying pressure vs. selling pressure at each price node.
How to Use This Script:
This indicator is most effective when the two concepts are used in tandem:
Context: Use the Volume Profile to see if price is currently "accepted" (inside the Value Area) or "rejected" (outside).
Trigger: Wait for the Opening Range to complete. A break above the ORB High suggests bullish momentum.
Confluence: Check if an ORB Extension level aligns with a Volume Profile node.
- Bullish Case: If price breaks the ORB High and the Volume Profile shows thin volume above (low resistance), the move is likely to run toward the extension targets.
- Reversal Case: If price hits an ORB Extension (e.g., 200%) and that level coincides with a high-volume node or POC from the previous day's lookback, it may act as strong resistance.
Settings Overview
ORB Settings: Fully adjustable session times, timeframes, and line styles. You can toggle up to 4 extension levels with custom percentages.
VP Settings: Adjust the "Number of Bars" to change how far back the profile looks. Adjust "Row Size" for higher definition profiles.
Visuals: Every color, line width, and fill opacity is customizable to fit dark or light themes.

Adaptive Volatility Stop by Pedro Paulo de MeloStop ATR is a clean and reliable volatility-based trailing stop system, built to adapt dynamically to market conditions using the Average True Range (ATR).
It identifies trend direction, adjusts the stop level using stair-step logic, and automatically flips the stop when price reversals occur.
How it works
Uses ATR × Multiplier to calculate an adaptive volatility buffer
Tracks trend direction internally
Recomputes and repositions the stop when a trend flip is detected
Plots separate lines for bullish and bearish stop states
Works on any market and timeframe (crypto, forex, commodities, indices, stocks)
Why it’s useful
This Stop ATR implementation is extremely stable and visually clean.
It is particularly effective for:
Trend following
Position management
Swing and position trading
Systematic stop placement
Unlike many ATR-based stop versions, this script uses a corrected flip-handling method that prevents stop misalignment and ensures consistent trend state tracking.
Inputs
Period — ATR length
Multiplier — ATR factor that defines stop distance
Author
Developed by Pedro Paulo de Melo, open-source version.

FRPC - Fractal Reversal Permission ComponentThis tool identifies high-probability reversal points using a three-stage confirmation model:
1️⃣ Liquidity Sweep (LS)
Price must take out a previous fractal high/low, indicating stop-hunt liquidity removal.
2️⃣ Reclaim (RC)
After sweeping liquidity, price must close back inside the previous swing, showing absorption and rejection.
3️⃣ Break of Structure (BOS)
A structural break confirms a true shift in market direction and avoids false reversal signals.
FRPC only triggers BUY or SELL signals when all three layers align, creating actionable reversal conditions rather than random fractal noise.
This approach helps avoid chasing breakouts, filters low-quality sweeps, and identifies areas where reversals are statistically more likely.
------------------------------------
What FRRC Helps You Identify
------------------------------------
True reversals after stop-hunts
Liquidity grabs followed by displacement
Avoiding fake breakouts
Swing points with strong reaction potential
High-probability turning points with real structure support
----------
Sidenote
----------
The accuracy of the signals range from 56% to 72% and is mainly designed to be a structural filter to be paired with a strong exhaustion system. This is just a bare bones version and I plan to work on a more advanced version yo pair with the current exhaustion systems I'm building out

Fanfans结构+极简合并增强版V2
中文:该指标整合Fanfans结构、高斯GWMA、动态摆动VWAP、MACD及极简交易信号,内置结构/GWMA/VWAP/EMA多维度过滤、成交量确认、动态ATR等优化功能。支持多空信号标注、止损止盈分层设置、信号质量评分,搭配图表信息面板与多级别警报共振机制,适用于1分钟等短周期交易,兼顾信号灵敏度与准确性。
English: This indicator integrates Fanfans structure, Gaussian GWMA, dynamic swing VWAP, MACD, and simple trading signals. It features multi-dimensional filters (structure/GWMA/VWAP/EMA), volume confirmation, dynamic ATR optimization. Supporting long/short signal labeling, layered SL/TP settings, signal quality scoring, it comes with a chart info panel and multi-level alert resonance. Suitable for short-term trading (e.g., 1-minute timeframe), balancing signal sensitivity and accuracy.

3EMA-8EMA Current Candle Scannerintraday scanner can also be used for short term trades, crossing above the ema high and low with volume gives signal

Macro-Sentiment (Macro_Serie 1:7)Part of a 7-indicator macro series. Combines yield curve dynamics, VIX structure, employment data (jobless claims, NFP), ISM manufacturing, US-Japan carry trade flows, and consumer sentiment into a single adaptive stress score. Color-coded regimes guide strategy from "Aggressive" to "Buy the Crash."

Volume Orderblock Breakout — Naaganeunja Lite v3.6Volume orderblocks breakout indicator
you can use it 5minutes (short trading)
or 4 hours(swing trading)
it is best indicator in the world

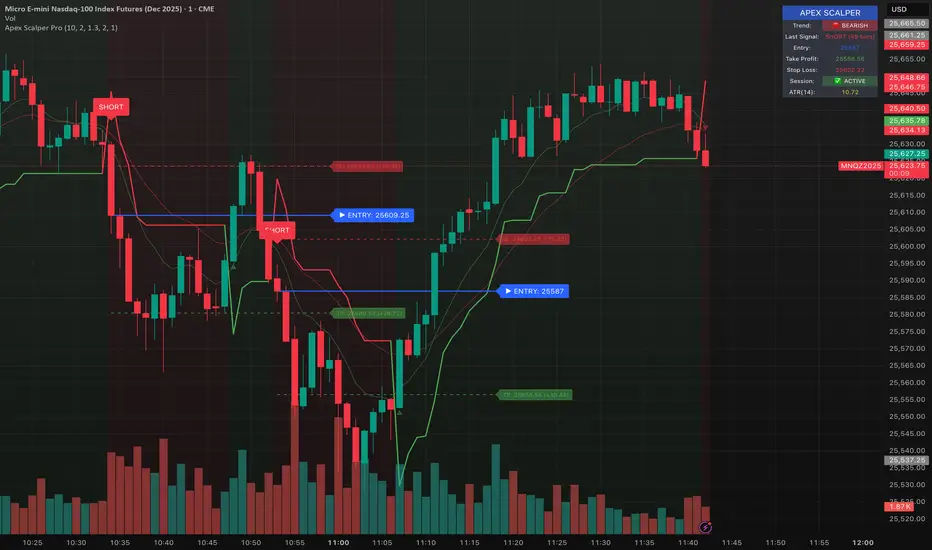
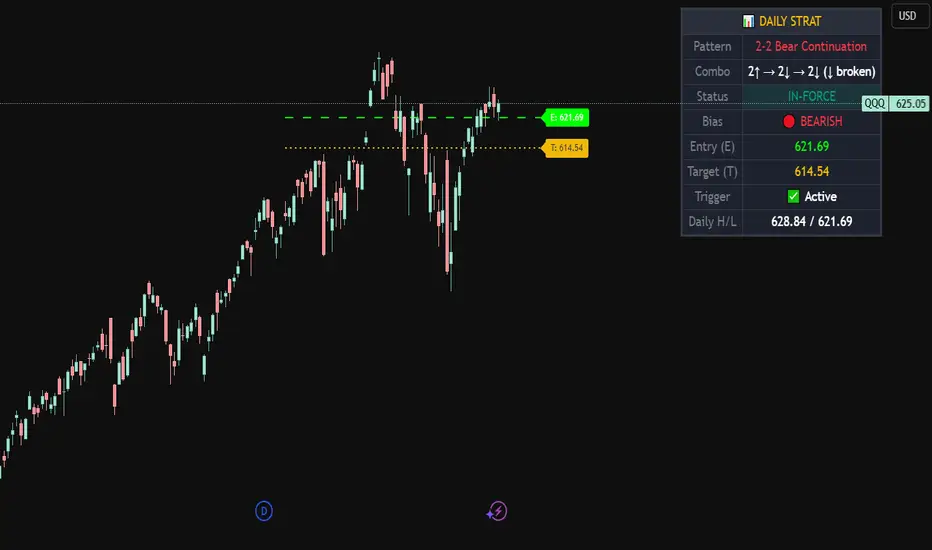
Strat Daily Predictor📊 Strat Daily Predictor
This indicator analyzes Daily timeframe Strat patterns and displays actionable trading setups on any chart timeframe.
🔹 FEATURES:
• Detects all major Strat patterns (2-1-2, 3-1-2, 3-2-2, 1-2-2, 2-2, 1-2, 1-3)
• Shows Entry (E) and Target (T) price levels
• Pattern status: ACTIONABLE, TRIGGERED, or IN-FORCE
• Visual Entry/Target lines on chart
• Entry signals when price breaks trigger levels
• Works on any timeframe using Daily analysis
🔹 PATTERN TYPES:
• Continuation patterns (trend following)
• Reversal patterns (counter-trend)
• Bullish & Bearish setups
🔹 TABLE DISPLAYS:
• Current pattern name
• Bar combo (e.g., 2↑ → 1 → 2↑)
• Bias (BULLISH/BEARISH)
• Entry & Target prices
• Daily High/Low levels
🔹 HOW TO USE:
1. Add to any timeframe chart
2. Check table for Daily pattern setup
3. Wait for ACTIONABLE patterns
4. Enter when price breaks Entry level
5. Target shown on chart
🔹 ALERTS:
• Long Entry
• Short Entry
• Actionable Pattern
• In-Force Pattern
Based on Rob Smith's "The Strat" methodology.
MTF 4h Structure + FVG (CORRECTED)This is a fully customizable Multi-Timeframe (MTF) indicator for SMC traders. It overlays true Higher Timeframe market structure onto your current chart. While it defaults to the 4-Hour (4h) structure, you can easily change this to 1h, Daily, or Weekly in the settings to suit your strategy.
Key Features:
1. Dynamic MTF Overlay: Select any Higher Timeframe (HTF) in the settings. The script calculates true pivots on that timeframe and projects them onto your chart without repainting issues.
2. Active Dealing Range: Automatically displays the Swing High and Swing Low of the selected HTF.
3. Equilibrium (EQ): Marks the 50% level of the range to help you identify Premium (Sell) vs. Discount (Buy) zones.
4. HTF Fair Value Gaps (FVG): Detects and draws unmitigated FVGs from your selected timeframe, acting as high-probability POIs.
Visuals & Logic:
- Green/Red: Signals CHoCH (Trend Reversals).
- Gray: Signals BOS (Trend Continuation) - keeping the chart clean.
- Smart Calculation: Calculates structure explicitly on the HTF data to prevent false signals on lower timeframes.
How to use:
1. Add to your chart (e.g., 5m or 15m).
2. Open Settings -> Select your desired "Higher Timeframe" (Default is 4h).
3. Trade in the direction of the HTF Trend (Labels) and look for entries within HTF FVGs in the correct Discount/Premium zone.

Swing Trading IndicatorThis script is a swing‑trading dashboard designed for BTC, ETH, S&P 500 (for now). It combines weekly RSI, USDT.D, VIX, moving averages and Fisher Transform into a single visual tool, with background highlights, an on‑chart info table and ready‑made alerts to help you time high‑probability swing entries and manage risk.
1. Overview
The indicator is intended to work on daily timeframe.
Signals are context‑aware: BTC and ETH get USDT.D conditions, SPX gets VIX and EMA‑100 logic, and all non‑ETH symbols can also use Fisher Transform as a mean‑reversion filter.
2. Conditions and background highlights
Each component sets a boolean condition and, when active, paints a background layer:
Weekly RSI condition
True when weekly RSI is below its symbol‑specific threshold.
USDT.D conditions
BTC: triggered when USDT.D is above the user threshold and the chart symbol is BTC.
ETH: same logic for ETH, but tracked separately..
VIX condition (SPX only)
True when VIX high is at or above the VIX threshold while the chart is SPX.
EMA condition (BTC & SPX)
BTC: daily close below EMA‑200.
SPX: daily close below EMA‑100.
Fisher Transform condition (non‑ETH)
Fisher Transform on the chart timeframe, using the configured period.
True when Fisher value is below the Fisher threshold.
3. Intended use and notes
This indicator is designed as a confluence tool for swing traders, not a standalone buy/sell system. It works best on assets that are in a clear uptrend, where the main idea is to accumulate during corrections within that broader bullish structure.
During larger market shocks, deep corrections, or black‑swan events, trend‑based and mean‑reversion filters can produce false signals, because volatility and correlations often behave abnormally in those periods. For that reason, this script should always be combined with independent risk management, higher‑timeframe trend analysis, and your own discretion.
