LibPvotLibrary "LibPvot"
This is a library for advanced technical analysis, specializing
in two core areas: the detection of price-oscillator
divergences and the analysis of market structure. It provides
a back-end engine for signal detection and a toolkit for
indicator plotting.
Key Features:
1. **Complete Divergence Suite (Class A, B, C):** The engine detects
all three major types of divergences, providing a full spectrum of
analytical signals:
- **Regular (A):** For potential trend reversals.
- **Hidden (B):** For potential trend continuations.
- **Exaggerated (C):** For identifying weakness at double tops/bottoms.
2. **Advanced Signal Filtering:** The detection logic uses a
percentage-based price tolerance (`prcTol`). This feature
enables the practical detection of Exaggerated divergences
(which rarely occur at the exact same price) and creates a
"dead zone" to filter insignificant noise from triggering
Regular divergences.
3. **Pivot Synchronization:** A bar tolerance (`barTol`) is used
to reliably match price and oscillator pivots that do not
align perfectly on the same bar, preventing missed signals.
4. **Signal Invalidation Logic:** Features two built-in invalidation
rules:
- An optional `invalidate` parameter automatically terminates
active divergences if the price or the oscillator breaks
the level of the confirming pivot.
- The engine also discards 'half-pivots' (e.g., a price pivot)
if a corresponding oscillator pivot does not appear within
the `barTol` window.
5. **Stateful Plotting Helpers:** Provides helper functions
(`bullDivPos` and `bearDivPos`) that abstract away the
state management issues of visualizing persistent signals.
They generate gap-free, accurately anchored data series
ready to be used in `plotshape` functions, simplifying
indicator-side code.
6. **Rich Data Output:** The core detection functions (`bullDiv`, `bearDiv`)
return a comprehensive 9-field data tuple. This includes the
boolean flags for each divergence type and the precise
coordinates (price, oscillator value, bar index) of both the
starting and the confirming pivots.
7. **Market Structure & Trend Analysis:** Includes a
`marketStructure` function to automatically identify pivot
highs/lows, classify their relationship (HH, LH, LL, HL),
detect structure breaks, and determine the current trend
state (Up, Down, Neutral) based on pivot sequences.
---
**DISCLAIMER**
This library is provided "AS IS" and for informational and
educational purposes only. It does not constitute financial,
investment, or trading advice.
The author assumes no liability for any errors, inaccuracies,
or omissions in the code. Using this library to build
trading indicators or strategies is entirely at your own risk.
As a developer using this library, you are solely responsible
for the rigorous testing, validation, and performance of any
scripts you create based on these functions. The author shall
not be held liable for any financial losses incurred directly
or indirectly from the use of this library or any scripts
derived from it.
bullDiv(priceSrc, oscSrc, leftLen, rightLen, depth, barTol, prcTol, persist, invalidate)
Detects bullish divergences (Regular, Hidden, Exaggerated) based on pivot lows.
Parameters:
priceSrc (float) : series float Price series to check for pivots (e.g., `low`).
oscSrc (float) : series float Oscillator series to check for pivots.
leftLen (int) : series int Number of bars to the left of a pivot (default 5).
rightLen (int) : series int Number of bars to the right of a pivot (default 5).
depth (int) : series int Maximum number of stored pivot pairs to check against (default 2).
barTol (int) : series int Maximum bar distance allowed between the price pivot and the oscillator pivot (default 3).
prcTol (float) : series float The percentage tolerance for comparing pivot prices. Used to detect Exaggerated
divergences and filter out market noise (default 0.05%).
persist (bool) : series bool If `true` (default), the divergence flag stays active for the entire duration of the signal.
If `false`, it returns a single-bar pulse on detection.
invalidate (bool) : series bool If `true` (default), terminates an active divergence if price or oscillator break
below the confirming pivot low.
Returns: A tuple containing comprehensive data for a detected bullish divergence.
regBull series bool `true` if a Regular bullish divergence (Class A) is active.
hidBull series bool `true` if a Hidden bullish divergence (Class B) is active.
exgBull series bool `true` if an Exaggerated bullish divergence (Class C) is active.
initPivotPrc series float Price value of the initial (older) pivot low.
initPivotOsz series float Oscillator value of the initial pivot low.
initPivotBar series int Bar index of the initial pivot low.
lastPivotPrc series float Price value of the last (confirming) pivot low.
lastPivotOsz series float Oscillator value of the last pivot low.
lastPivotBar series int Bar index of the last pivot low.
bearDiv(priceSrc, oscSrc, leftLen, rightLen, depth, barTol, prcTol, persist, invalidate)
Detects bearish divergences (Regular, Hidden, Exaggerated) based on pivot highs.
Parameters:
priceSrc (float) : series float Price series to check for pivots (e.g., `high`).
oscSrc (float) : series float Oscillator series to check for pivots.
leftLen (int) : series int Number of bars to the left of a pivot (default 5).
rightLen (int) : series int Number of bars to the right of a pivot (default 5).
depth (int) : series int Maximum number of stored pivot pairs to check against (default 2).
barTol (int) : series int Maximum bar distance allowed between the price pivot and the oscillator pivot (default 3).
prcTol (float) : series float The percentage tolerance for comparing pivot prices. Used to detect Exaggerated
divergences and filter out market noise (default 0.05%).
persist (bool) : series bool If `true` (default), the divergence flag stays active for the entire duration of the signal.
If `false`, it returns a single-bar pulse on detection.
invalidate (bool) : series bool If `true` (default), terminates an active divergence if price or oscillator break
above the confirming pivot high.
Returns: A tuple containing comprehensive data for a detected bearish divergence.
regBear series bool `true` if a Regular bearish divergence (Class A) is active.
hidBear series bool `true` if a Hidden bearish divergence (Class B) is active.
exgBear series bool `true` if an Exaggerated bearish divergence (Class C) is active.
initPivotPrc series float Price value of the initial (older) pivot high.
initPivotOsz series float Oscillator value of the initial pivot high.
initPivotBar series int Bar index of the initial pivot high.
lastPivotPrc series float Price value of the last (confirming) pivot high.
lastPivotOsz series float Oscillator value of the last pivot high.
lastPivotBar series int Bar index of the last pivot high.
bullDivPos(regBull, hidBull, exgBull, rightLen, yPos)
Calculates the plottable data series for bullish divergences. It manages
the complex state of a persistent signal's plotting window to ensure
gap-free and accurately anchored visualization.
Parameters:
regBull (bool) : series bool The regular bullish divergence flag from `bullDiv`.
hidBull (bool) : series bool The hidden bullish divergence flag from `bullDiv`.
exgBull (bool) : series bool The exaggerated bullish divergence flag from `bullDiv`.
rightLen (int) : series int The same `rightLen` value used in `bullDiv` for correct timing.
yPos (float) : series float The series providing the base Y-coordinate for the shapes (e.g., `low`).
Returns: A tuple of three `series float` for plotting bullish divergences.
regBullPosY series float Contains the static anchor Y-value for Regular divergences where a shape should be plotted; `na` otherwise.
hidBullPosY series float Contains the static anchor Y-value for Hidden divergences where a shape should be plotted; `na` otherwise.
exgBullPosY series float Contains the static anchor Y-value for Exaggerated divergences where a shape should be plotted; `na` otherwise.
bearDivPos(regBear, hidBear, exgBear, rightLen, yPos)
Calculates the plottable data series for bearish divergences. It manages
the complex state of a persistent signal's plotting window to ensure
gap-free and accurately anchored visualization.
Parameters:
regBear (bool) : series bool The regular bearish divergence flag from `bearDiv`.
hidBear (bool) : series bool The hidden bearish divergence flag from `bearDiv`.
exgBear (bool) : series bool The exaggerated bearish divergence flag from `bearDiv`.
rightLen (int) : series int The same `rightLen` value used in `bearDiv` for correct timing.
yPos (float) : series float The series providing the base Y-coordinate for the shapes (e.g., `high`).
Returns: A tuple of three `series float` for plotting bearish divergences.
regBearPosY series float Contains the static anchor Y-value for Regular divergences where a shape should be plotted; `na` otherwise.
hidBearPosY series float Contains the static anchor Y-value for Hidden divergences where a shape should be plotted; `na` otherwise.
exgBearPosY series float Contains the static anchor Y-value for Exaggerated divergences where a shape should be plotted; `na` otherwise.
marketStructure(highSrc, lowSrc, leftLen, rightLen, srcTol)
Analyzes the market structure by identifying pivot points, classifying
their sequence (e.g., Higher Highs, Lower Lows), and determining the
prevailing trend state.
Parameters:
highSrc (float) : series float Price series for pivot high detection (e.g., `high`).
lowSrc (float) : series float Price series for pivot low detection (e.g., `low`).
leftLen (int) : series int Number of bars to the left of a pivot (default 5).
rightLen (int) : series int Number of bars to the right of a pivot (default 5).
srcTol (float) : series float Percentage tolerance to consider two pivots as 'equal' (default 0.05%).
Returns: A tuple containing detailed market structure information.
pivType series PivType The type of the most recently formed pivot (e.g., `hh`, `ll`).
lastPivHi series float The price level of the last confirmed pivot high.
lastPivLo series float The price level of the last confirmed pivot low.
lastPiv series float The price level of the last confirmed pivot (either high or low).
pivHiBroken series bool `true` if the price has broken above the last pivot high.
pivLoBroken series bool `true` if the price has broken below the last pivot low.
trendState series TrendState The current trend state (`up`, `down`, or `neutral`).
Indicators and strategies

LibTmFrLibrary "LibTmFr"
This is a utility library for handling timeframes and
multi-timeframe (MTF) analysis in Pine Script. It provides a
collection of functions designed to handle common tasks related
to period detection, session alignment, timeframe construction,
and time calculations, forming a foundation for
MTF indicators.
Key Capabilities:
1. **MTF Period Engine:** The library includes functions for
managing higher-timeframe (HTF) periods.
- **Period Detection (`isNewPeriod`):** Detects the first bar
of a given timeframe. It includes custom logic to handle
multi-month and multi-year intervals where
`timeframe.change()` may not be sufficient.
- **Bar Counting (`sinceNewPeriod`):** Counts the number of
bars that have passed in the current HTF period or
returns the final count for a completed historical period.
2. **Automatic Timeframe Selection:** Offers functions for building
a top-down analysis framework:
- **Automatic HTF (`autoHTF`):** Suggests a higher timeframe
(HTF) for broader context based on the current timeframe.
- **Automatic LTF (`autoLTF`):** Suggests an appropriate lower
timeframe (LTF) for granular intra-bar analysis.
3. **Timeframe Manipulation and Comparison:** Includes tools for
working with timeframe strings:
- **Build & Split (`buildTF`, `splitTF`):** Functions to
programmatically construct valid Pine Script timeframe
strings (e.g., "4H") and parse them back into their
numeric and unit components.
- **Comparison (`isHigherTF`, `isActiveTF`, `isLowerTF`):**
A set of functions to check if a given timeframe is
higher, lower, or the same as the script's active timeframe.
- **Multiple Validation (`isMultipleTF`):** Checks if a
higher timeframe is a practical multiple of the current
timeframe. This is based on the assumption that checking
if recent, completed HTF periods contained more than one
bar is a valid proxy for preventing data gaps.
4. **Timestamp Interpolation:** Contains an `interpTimestamp()`
function that calculates an absolute timestamp by
interpolating at a given percentage across a specified
range of bars (e.g., 50% of the way through the last
20 bars), enabling time calculations at a resolution
finer than the chart's native bars.
---
**DISCLAIMER**
This library is provided "AS IS" and for informational and
educational purposes only. It does not constitute financial,
investment, or trading advice.
The author assumes no liability for any errors, inaccuracies,
or omissions in the code. Using this library to build
trading indicators or strategies is entirely at your own risk.
As a developer using this library, you are solely responsible
for the rigorous testing, validation, and performance of any
scripts you create based on these functions. The author shall
not be held liable for any financial losses incurred directly
or indirectly from the use of this library or any scripts
derived from it.
buildTF(quantity, unit)
Builds a Pine Script timeframe string from a numeric quantity and a unit enum.
The resulting string can be used with `request.security()` or `input.timeframe`.
Parameters:
quantity (int) : series int Number to specifie how many `unit` the timeframe spans.
unit (series TFUnit) : series TFUnit The size category for the bars.
Returns: series string A Pine-style timeframe identifier, e.g.
"5S" → 5-seconds bars
"30" → 30-minute bars
"120" → 2-hour bars
"1D" → daily bars
"3M" → 3-month bars
"24M" → 2-year bars
splitTF(tf)
Splits a Pine‑timeframe identifier into numeric quantity and unit (TFUnit).
Parameters:
tf (string) : series string Timeframe string, e.g.
"5S", "30", "120", "1D", "3M", "24M".
Returns:
quantity series int The numeric value of the timeframe (e.g., 15 for "15", 3 for "3M").
unit series TFUnit The unit of the timeframe (e.g., TFUnit.minutes, TFUnit.months).
Notes on strings without a suffix:
• Pure digits are minutes; if divisible by 60, they are treated as hours.
• An "M" suffix is months; if divisible by 12, it is converted to years.
autoHTF(tf)
Picks an appropriate **higher timeframe (HTF)** relative to the selected timeframe.
It steps up along a coarse ladder to produce sensible jumps for top‑down analysis.
Mapping → chosen HTF:
≤ 1 min → 60 (1h) ≈ ×60
≤ 3 min → 180 (3h) ≈ ×60
≤ 5 min → 240 (4h) ≈ ×48
≤ 15 min → D (1 day) ≈ ×26–×32 (regular session 6.5–8 h)
> 15 min → W (1 week) ≈ ×64–×80 for 30m; varies with input
≤ 1 h → W (1 week) ≈ ×32–×40
≤ 4 h → M (1 month) ≈ ×36–×44 (~22 trading days / month)
> 4 h → 3M (3 months) ≈ ×36–×66 (e.g., 12h→×36–×44; 8h→×53–×66)
≤ 1 day → 3M (3 months) ≈ ×60–×66 (~20–22 trading days / month)
> 1 day → 12M (1 year) ≈ ×(252–264)/quantity
≤ 1 week → 12M (1 year) ≈ ×52
> 1 week → 48M (4 years) ≈ ×(208)/quantity
= 1 M → 48M (4 years) ≈ ×48
> 1 M → error ("HTF too big")
any → error ("HTF too big")
Notes:
• Inputs in months or years are restricted: only 1M is allowed; larger months/any years throw.
• Returns a Pine timeframe string usable in `request.security()` and `input.timeframe`.
Parameters:
tf (string) : series string Selected timeframe (e.g., "D", "240", or `timeframe.period`).
Returns: series string Suggested higher timeframe.
autoLTF(tf)
Selects an appropriate **lower timeframe LTF)** for intra‑bar evaluation
based on the selected timeframe. The goal is to keep intra‑bar
loops performant while providing enough granularity.
Mapping → chosen LTF:
≤ 1 min → 1S ≈ ×60
≤ 5 min → 5S ≈ ×60
≤ 15 min → 15S ≈ ×60
≤ 30 min → 30S ≈ ×60
> 30 min → 60S (1m) ≈ ×31–×59 (for 31–59 minute charts)
≤ 1 h → 1 (1m) ≈ ×60
≤ 2 h → 2 (2m) ≈ ×60
≤ 4 h → 5 (5m) ≈ ×48
> 4 h → 15 (15m) ≈ ×24–×48 (e.g., 6h→×24, 8h→×32, 12h→×48)
≤ 1 day → 15 (15m) ≈ ×26–×32 (regular sessions ~6.5–8h)
> 1 day → 60 (60m) ≈ ×(26–32) per day × quantity
≤ 1 week → 60 (60m) ≈ ×32–×40 (≈5 sessions of ~6.5–8h)
> 1 week → 240 (4h) ≈ ×(8–10) per week × quantity
≤ 1 M → 240 (4h) ≈ ×33–×44 (~20–22 sessions × 6.5–8h / 4h)
≤ 3 M → D (1d) ≈ ×(20–22) per month × quantity
> 3 M → W (1w) ≈ ×(4–5) per month × quantity
≤ 1 Y → W (1w) ≈ ×52
> 1 Y → M (1M) ≈ ×12 per year × quantity
Notes:
• Ratios for D/W/M are given as ranges because they depend on
**regular session length** (typically ~6.5–8h, not 24h).
• Returned strings can be used with `request.security()` and `input.timeframe`.
Parameters:
tf (string) : series string Selected timeframe (e.g., "D", "240", or timeframe.period).
Returns: series string Suggested lower TF to use for intra‑bar work.
isNewPeriod(tf, offset)
Returns `true` when a new session-aligned period begins, or on the Nth bar of that period.
Parameters:
tf (string) : series string Target higher timeframe (e.g., "D", "W", "M").
offset (simple int) : simple int 0 → checks for the first bar of the new period.
1+ → checks for the N-th bar of the period.
Returns: series bool `true` if the condition is met.
sinceNewPeriod(tf, offset)
Counts how many bars have passed within a higher timeframe (HTF) period.
For daily, weekly, and monthly resolutions, the period is aligned with the trading session.
Parameters:
tf (string) : series string Target parent timeframe (e.g., "60", "D").
offset (simple int) : simple int 0 → Running count for the current period.
1+ → Finalized count for the Nth most recent *completed* period.
Returns: series int Number of bars.
isHigherTF(tf, main)
Returns `true` when the selected timeframe represents a
higher resolution than the active timeframe.
Parameters:
tf (string) : series string Selected timeframe.
main (bool) : series bool When `true`, the comparison is made against the chart's main timeframe
instead of the script's active timeframe. Optional. Defaults to `false`.
Returns: series bool `true` if `tf` > active TF; otherwise `false`.
isActiveTF(tf, main)
Returns `true` when the selected timeframe represents the
exact resolution of the active timeframe.
Parameters:
tf (string) : series string Selected timeframe.
main (bool) : series bool When `true`, the comparison is made against the chart's main timeframe
instead of the script's active timeframe. Optional. Defaults to `false`.
Returns: series bool `true` if `tf` == active TF; otherwise `false`.
isLowerTF(tf, main)
Returns `true` when the selected timeframe represents a
lower resolution than the active timeframe.
Parameters:
tf (string) : series string Selected timeframe.
main (bool) : series bool When `true`, the comparison is made against the chart's main timeframe
instead of the script's active timeframe. Optional. Defaults to `false`.
Returns: series bool `true` if `tf` < active TF; otherwise `false`.
isMultipleTF(tf)
Returns `true` if the selected timeframe (`tf`) is a practical multiple
of the active skript's timeframe. It verifies this by checking if `tf` is a higher timeframe
that has consistently contained more than one bar of the skript's timeframe in recent periods.
The period detection is session-aware.
Parameters:
tf (string) : series string The higher timeframe to check.
Returns: series bool `true` if `tf` is a practical multiple; otherwise `false`.
interpTimestamp(offStart, offEnd, pct)
Calculates a precise absolute timestamp by interpolating within a bar range based on a percentage.
This version works with RELATIVE bar offsets from the current bar.
Parameters:
offStart (int) : series int The relative offset of the starting bar (e.g., 10 for 10 bars ago).
offEnd (int) : series int The relative offset of the ending bar (e.g., 1 for 1 bar ago). Must be <= offStart.
pct (float) : series float The percentage of the bar range to measure (e.g., 50.5 for 50.5%).
Values are clamped to the range.
Returns: series int The calculated, interpolated absolute Unix timestamp in milliseconds.

LibVolmLibrary "LibVolm"
This library provides a collection of core functions for volume and
money flow analysis. It offers implementations of several classic
volume-based indicators, with a focus on flexibility
for applications like multi-timeframe and session-based analysis.
Key Features:
1. **Suite of Classic Volume Indicators:** Includes standard
implementations of several foundational indicators:
- **On Balance Volume (`obv`):** A momentum indicator that
accumulates volume based on price direction.
- **Accumulation/Distribution Line (`adLine`):** Measures cumulative
money flow using the close's position within the bar's range.
- **Chaikin Money Flow (`cmf`):** An oscillator version of the ADL
that measures money flow over a specified lookback period.
2. **Anchored/Resettable Indicators:** The library includes flexible,
resettable indicators ideal for cyclical analysis:
- **Anchored VWAP (`vwap`):** Calculates a Volume Weighted Average
Price that can be reset on any user-defined `reset` condition.
It returns both the VWAP and the number of bars (`prdBars`) in
the current period.
- **Resettable CVD (`cvd`):** Computes a Cumulative Volume Delta
that can be reset on a custom `reset` anchor. The function
also tracks and returns the highest (`hi`) and lowest (`lo`)
delta values reached within the current period.
(Note: The delta sign is determined by a specific logic:
it first checks close vs. open, then close vs. prior
close, and persists the last non-zero sign).
3. **Volume Sanitization:** All functions that use the built-in
`volume` variable automatically sanitize it via an internal
function. This process replaces `na` values with 0 and ensures
no negative volume values are used, providing stable calculations.
---
**DISCLAIMER**
This library is provided "AS IS" and for informational and
educational purposes only. It does not constitute financial,
investment, or trading advice.
The author assumes no liability for any errors, inaccuracies,
or omissions in the code. Using this library to build
trading indicators or strategies is entirely at your own risk.
As a developer using this library, you are solely responsible
for the rigorous testing, validation, and performance of any
scripts you create based on these functions. The author shall
not be held liable for any financial losses incurred directly
or indirectly from the use of this library or any scripts
derived from it.
obv(price)
Calculates the On Balance Volume (OBV) cumulative indicator.
Parameters:
price (float) : series float Source price series, typically the close.
Returns: series float Cumulative OBV value.
adLine()
Computes the Accumulation/Distribution Line (AD Line).
Returns: series float Cumulative AD Line value.
cmf(length)
Computes Chaikin Money Flow (CMF).
Parameters:
length (int) : series int Lookback length for the CMF calculation.
Returns: series float CMF value.
vwap(price, reset)
Calculates an anchored Volume Weighted Average Price (VWAP).
Parameters:
price (float) : series float Source price series (usually *close*).
reset (bool) : series bool A signal that is *true* on the bar where the
accumulation should be reset.
Returns:
vwap series float The calculated Volume Weighted Average Price for the current period.
prdBars series int The number of bars that have passed since the last reset.
cvd(reset)
Calculates a resettable, cumulative Volume Delta (CVD).
It accumulates volume delta and tracks its high/low range. The
accumulation is reset to zero whenever the `reset` condition is true.
This is useful for session-based analysis, intra-bar calculations,
or any other custom-anchored accumulation.
Parameters:
reset (bool) : series bool A signal that is *true* on the bar where the
accumulation should be reset.
Returns:
cum series float The current cumulative volume delta.
hi series float The highest peak the cumulative delta has reached in the current period.
lo series float The lowest trough the cumulative delta has reached in the current period.

LibMvAvLibrary "LibMvAv"
This library provides a unified interface for calculating a
wide variety of moving averages. It is designed to simplify
indicator development by consolidating numerous MA calculations
into a single function and integrating the weighting
capabilities from the `LibWght` library.
Key Features:
1. **All-in-One MA Function:** The core of the library is the
`ma()` function. Users can select the desired calculation
method via the `MAType` enum, which helps create
cleaner and more maintainable code compared to using
many different `ta.*` or custom functions.
2. **Comprehensive Selection of MA Types:** It provides a
selection of 12 different moving averages, covering
common Pine Script built-ins and their weighted counterparts:
- **Standard MAs:** SMA, EMA, WMA, RMA (Wilder's), HMA (Hull), and
LSMA (Least Squares / Linear Regression).
- **Weighted MAs:** Weight-enhanced versions of the above
(WSMA, WEMA, WWMA, WRMA, WHMA, WLSMA).
3. **Integrated Weighting:** The library provides weighted versions
for each of its standard MA types (e.g., `wsma` alongside `sma`).
By acting as a dispatcher, the `ma()` function allows these
weighted calculations to be called using the optional
`weight` parameter, which are then processed by the `LibWght`
library.
4. **Simple API:** The library internally handles the logic of
choosing the correct function based on the selected `MAType`.
The user only needs to provide the source, length, and
optional weight, simplifying the development process.
---
**DISCLAIMER**
This library is provided "AS IS" and for informational and
educational purposes only. It does not constitute financial,
investment, or trading advice.
The author assumes no liability for any errors, inaccuracies,
or omissions in the code. Using this library to build
trading indicators or strategies is entirely at your own risk.
As a developer using this library, you are solely responsible
for the rigorous testing, validation, and performance of any
scripts you create based on these functions. The author shall
not be held liable for any financial losses incurred directly
or indirectly from the use of this library or any scripts
derived from it.
ma(maType, source, length, weight)
Returns the requested moving average.
Parameters:
maType (simple MAType) : simple MAType Desired type (see enum above).
source (float) : series float Data series to smooth.
length (simple int) : simple int Look-back / period length.
weight (float) : series float Weight series (default = na)
Returns: series float Moving-average value.
LibWghtLibrary "LibWght"
This is a library of mathematical and statistical functions
designed for quantitative analysis in Pine Script. Its core
principle is the integration of a custom weighting series
(e.g., volume) into a wide array of standard technical
analysis calculations.
Key Capabilities:
1. **Universal Weighting:** All exported functions accept a `weight`
parameter. This allows standard calculations (like moving
averages, RSI, and standard deviation) to be influenced by an
external data series, such as volume or tick count.
2. **Weighted Averages and Indicators:** Includes a comprehensive
collection of weighted functions:
- **Moving Averages:** `wSma`, `wEma`, `wWma`, `wRma` (Wilder's),
`wHma` (Hull), and `wLSma` (Least Squares / Linear Regression).
- **Oscillators & Ranges:** `wRsi`, `wAtr` (Average True Range),
`wTr` (True Range), and `wR` (High-Low Range).
3. **Volatility Decomposition:** Provides functions to decompose
total variance into distinct components for market analysis.
- **Two-Way Decomposition (`wTotVar`):** Separates variance into
**between-bar** (directional) and **within-bar** (noise)
components.
- **Three-Way Decomposition (`wLRTotVar`):** Decomposes variance
relative to a linear regression into **Trend** (explained by
the LR slope), **Residual** (mean-reversion around the
LR line), and **Within-Bar** (noise) components.
- **Local Volatility (`wLRLocTotStdDev`):** Measures the total
"noise" (within-bar + residual) around the trend line.
4. **Weighted Statistics and Regression:** Provides a robust
function for Weighted Linear Regression (`wLinReg`) and a
full suite of related statistical measures:
- **Between-Bar Stats:** `wBtwVar`, `wBtwStdDev`, `wBtwStdErr`.
- **Residual Stats:** `wResVar`, `wResStdDev`, `wResStdErr`.
5. **Fallback Mechanism:** All functions are designed for reliability.
If the total weight over the lookback period is zero (e.g., in
a no-volume period), the algorithms automatically fall back to
their unweighted, uniform-weight equivalents (e.g., `wSma`
becomes a standard `ta.sma`), preventing errors and ensuring
continuous calculation.
---
**DISCLAIMER**
This library is provided "AS IS" and for informational and
educational purposes only. It does not constitute financial,
investment, or trading advice.
The author assumes no liability for any errors, inaccuracies,
or omissions in the code. Using this library to build
trading indicators or strategies is entirely at your own risk.
As a developer using this library, you are solely responsible
for the rigorous testing, validation, and performance of any
scripts you create based on these functions. The author shall
not be held liable for any financial losses incurred directly
or indirectly from the use of this library or any scripts
derived from it.
wSma(source, weight, length)
Weighted Simple Moving Average (linear kernel).
Parameters:
source (float) : series float Data to average.
weight (float) : series float Weight series.
length (int) : series int Look-back length ≥ 1.
Returns: series float Linear-kernel weighted mean; falls back to
the arithmetic mean if Σweight = 0.
wEma(source, weight, length)
Weighted EMA (exponential kernel).
Parameters:
source (float) : series float Data to average.
weight (float) : series float Weight series.
length (simple int) : simple int Look-back length ≥ 1.
Returns: series float Exponential-kernel weighted mean; falls
back to classic EMA if Σweight = 0.
wWma(source, weight, length)
Weighted WMA (linear kernel).
Parameters:
source (float) : series float Data to average.
weight (float) : series float Weight series.
length (int) : series int Look-back length ≥ 1.
Returns: series float Linear-kernel weighted mean; falls back to
classic WMA if Σweight = 0.
wRma(source, weight, length)
Weighted RMA (Wilder kernel, α = 1/len).
Parameters:
source (float) : series float Data to average.
weight (float) : series float Weight series.
length (simple int) : simple int Look-back length ≥ 1.
Returns: series float Wilder-kernel weighted mean; falls back to
classic RMA if Σweight = 0.
wHma(source, weight, length)
Weighted HMA (linear kernel).
Parameters:
source (float) : series float Data to average.
weight (float) : series float Weight series.
length (int) : series int Look-back length ≥ 1.
Returns: series float Linear-kernel weighted mean; falls back to
classic HMA if Σweight = 0.
wRsi(source, weight, length)
Weighted Relative Strength Index.
Parameters:
source (float) : series float Price series.
weight (float) : series float Weight series.
length (simple int) : simple int Look-back length ≥ 1.
Returns: series float Weighted RSI; uniform if Σw = 0.
wAtr(tr, weight, length)
Weighted ATR (Average True Range).
Implemented as WRMA on *true range*.
Parameters:
tr (float) : series float True Range series.
weight (float) : series float Weight series.
length (simple int) : simple int Look-back length ≥ 1.
Returns: series float Weighted ATR; uniform weights if Σw = 0.
wTr(tr, weight, length)
Weighted True Range over a window.
Parameters:
tr (float) : series float True Range series.
weight (float) : series float Weight series.
length (int) : series int Look-back length ≥ 1.
Returns: series float Weighted mean of TR; uniform if Σw = 0.
wR(r, weight, length)
Weighted High-Low Range over a window.
Parameters:
r (float) : series float High-Low per bar.
weight (float) : series float Weight series.
length (int) : series int Look-back length ≥ 1.
Returns: series float Weighted mean of range; uniform if Σw = 0.
wBtwVar(source, weight, length, biased)
Weighted Between Variance (biased/unbiased).
Parameters:
source (float) : series float Data series.
weight (float) : series float Weight series.
length (int) : series int Look-back length ≥ 2.
biased (bool) : series bool true → population (biased); false → sample.
Returns:
variance series float The calculated between-bar variance (σ²btw), either biased or unbiased.
sumW series float The sum of weights over the lookback period (Σw).
sumW2 series float The sum of squared weights over the lookback period (Σw²).
wBtwStdDev(source, weight, length, biased)
Weighted Between Standard Deviation.
Parameters:
source (float) : series float Data series.
weight (float) : series float Weight series.
length (int) : series int Look-back length ≥ 2.
biased (bool) : series bool true → population (biased); false → sample.
Returns: series float σbtw uniform if Σw = 0.
wBtwStdErr(source, weight, length, biased)
Weighted Between Standard Error.
Parameters:
source (float) : series float Data series.
weight (float) : series float Weight series.
length (int) : series int Look-back length ≥ 2.
biased (bool) : series bool true → population (biased); false → sample.
Returns: series float √(σ²btw / N_eff) uniform if Σw = 0.
wTotVar(mu, sigma, weight, length, biased)
Weighted Total Variance (= between-group + within-group).
Useful when each bar represents an aggregate with its own
mean* and pre-estimated σ (e.g., second-level ranges inside a
1-minute bar). Assumes the *weight* series applies to both the
group means and their σ estimates.
Parameters:
mu (float) : series float Group means (e.g., HL2 of 1-second bars).
sigma (float) : series float Pre-estimated σ of each group (same basis).
weight (float) : series float Weight series (volume, ticks, …).
length (int) : series int Look-back length ≥ 2.
biased (bool) : series bool true → population (biased); false → sample.
Returns:
varBtw series float The between-bar variance component (σ²btw).
varWtn series float The within-bar variance component (σ²wtn).
sumW series float The sum of weights over the lookback period (Σw).
sumW2 series float The sum of squared weights over the lookback period (Σw²).
wTotStdDev(mu, sigma, weight, length, biased)
Weighted Total Standard Deviation.
Parameters:
mu (float) : series float Group means (e.g., HL2 of 1-second bars).
sigma (float) : series float Pre-estimated σ of each group (same basis).
weight (float) : series float Weight series (volume, ticks, …).
length (int) : series int Look-back length ≥ 2.
biased (bool) : series bool true → population (biased); false → sample.
Returns: series float σtot.
wTotStdErr(mu, sigma, weight, length, biased)
Weighted Total Standard Error.
SE = √( total variance / N_eff ) with the same effective sample
size logic as `wster()`.
Parameters:
mu (float) : series float Group means (e.g., HL2 of 1-second bars).
sigma (float) : series float Pre-estimated σ of each group (same basis).
weight (float) : series float Weight series (volume, ticks, …).
length (int) : series int Look-back length ≥ 2.
biased (bool) : series bool true → population (biased); false → sample.
Returns: series float √(σ²tot / N_eff).
wLinReg(source, weight, length)
Weighted Linear Regression.
Parameters:
source (float) : series float Data series.
weight (float) : series float Weight series.
length (int) : series int Look-back length ≥ 2.
Returns:
mid series float The estimated value of the regression line at the most recent bar.
slope series float The slope of the regression line.
intercept series float The intercept of the regression line.
wResVar(source, weight, midLine, slope, length, biased)
Weighted Residual Variance.
linear regression – optionally biased (population) or
unbiased (sample).
Parameters:
source (float) : series float Data series.
weight (float) : series float Weighting series (volume, etc.).
midLine (float) : series float Regression value at the last bar.
slope (float) : series float Slope per bar.
length (int) : series int Look-back length ≥ 2.
biased (bool) : series bool true → population variance (σ²_P), denominator ≈ N_eff.
false → sample variance (σ²_S), denominator ≈ N_eff - 2.
(Adjusts for 2 degrees of freedom lost to the regression).
Returns:
variance series float The calculated residual variance (σ²res), either biased or unbiased.
sumW series float The sum of weights over the lookback period (Σw).
sumW2 series float The sum of squared weights over the lookback period (Σw²).
wResStdDev(source, weight, midLine, slope, length, biased)
Weighted Residual Standard Deviation.
Parameters:
source (float) : series float Data series.
weight (float) : series float Weight series.
midLine (float) : series float Regression value at the last bar.
slope (float) : series float Slope per bar.
length (int) : series int Look-back length ≥ 2.
biased (bool) : series bool true → population (biased); false → sample.
Returns: series float σres; uniform if Σw = 0.
wResStdErr(source, weight, midLine, slope, length, biased)
Weighted Residual Standard Error.
Parameters:
source (float) : series float Data series.
weight (float) : series float Weight series.
midLine (float) : series float Regression value at the last bar.
slope (float) : series float Slope per bar.
length (int) : series int Look-back length ≥ 2.
biased (bool) : series bool true → population (biased); false → sample.
Returns: series float √(σ²res / N_eff); uniform if Σw = 0.
wLRTotVar(mu, sigma, weight, midLine, slope, length, biased)
Weighted Linear-Regression Total Variance **around the
window’s weighted mean μ**.
σ²_tot = E_w ⟶ *within-group variance*
+ Var_w ⟶ *residual variance*
+ Var_w ⟶ *trend variance*
where each bar i in the look-back window contributes
m_i = *mean* (e.g. 1-sec HL2)
σ_i = *sigma* (pre-estimated intrabar σ)
w_i = *weight* (volume, ticks, …)
ŷ_i = b₀ + b₁·x (value of the weighted LR line)
r_i = m_i − ŷ_i (orthogonal residual)
Parameters:
mu (float) : series float Per-bar mean m_i.
sigma (float) : series float Pre-estimated σ_i of each bar.
weight (float) : series float Weight series w_i (≥ 0).
midLine (float) : series float Regression value at the latest bar (ŷₙ₋₁).
slope (float) : series float Slope b₁ of the regression line.
length (int) : series int Look-back length ≥ 2.
biased (bool) : series bool true → population; false → sample.
Returns:
varRes series float The residual variance component (σ²res).
varWtn series float The within-bar variance component (σ²wtn).
varTrd series float The trend variance component (σ²trd), explained by the linear regression.
sumW series float The sum of weights over the lookback period (Σw).
sumW2 series float The sum of squared weights over the lookback period (Σw²).
wLRTotStdDev(mu, sigma, weight, midLine, slope, length, biased)
Weighted Linear-Regression Total Standard Deviation.
Parameters:
mu (float) : series float Per-bar mean m_i.
sigma (float) : series float Pre-estimated σ_i of each bar.
weight (float) : series float Weight series w_i (≥ 0).
midLine (float) : series float Regression value at the latest bar (ŷₙ₋₁).
slope (float) : series float Slope b₁ of the regression line.
length (int) : series int Look-back length ≥ 2.
biased (bool) : series bool true → population; false → sample.
Returns: series float √(σ²tot).
wLRTotStdErr(mu, sigma, weight, midLine, slope, length, biased)
Weighted Linear-Regression Total Standard Error.
SE = √( σ²_tot / N_eff ) with N_eff = Σw² / Σw² (like in wster()).
Parameters:
mu (float) : series float Per-bar mean m_i.
sigma (float) : series float Pre-estimated σ_i of each bar.
weight (float) : series float Weight series w_i (≥ 0).
midLine (float) : series float Regression value at the latest bar (ŷₙ₋₁).
slope (float) : series float Slope b₁ of the regression line.
length (int) : series int Look-back length ≥ 2.
biased (bool) : series bool true → population; false → sample.
Returns: series float √((σ²res, σ²wtn, σ²trd) / N_eff).
wLRLocTotStdDev(mu, sigma, weight, midLine, slope, length, biased)
Weighted Linear-Regression Local Total Standard Deviation.
Measures the total "noise" (within-bar + residual) around the trend.
Parameters:
mu (float) : series float Per-bar mean m_i.
sigma (float) : series float Pre-estimated σ_i of each bar.
weight (float) : series float Weight series w_i (≥ 0).
midLine (float) : series float Regression value at the latest bar (ŷₙ₋₁).
slope (float) : series float Slope b₁ of the regression line.
length (int) : series int Look-back length ≥ 2.
biased (bool) : series bool true → population; false → sample.
Returns: series float √(σ²wtn + σ²res).
wLRLocTotStdErr(mu, sigma, weight, midLine, slope, length, biased)
Weighted Linear-Regression Local Total Standard Error.
Parameters:
mu (float) : series float Per-bar mean m_i.
sigma (float) : series float Pre-estimated σ_i of each bar.
weight (float) : series float Weight series w_i (≥ 0).
midLine (float) : series float Regression value at the latest bar (ŷₙ₋₁).
slope (float) : series float Slope b₁ of the regression line.
length (int) : series int Look-back length ≥ 2.
biased (bool) : series bool true → population; false → sample.
Returns: series float √((σ²wtn + σ²res) / N_eff).
wLSma(source, weight, length)
Weighted Least Square Moving Average.
Parameters:
source (float) : series float Data series.
weight (float) : series float Weight series.
length (int) : series int Look-back length ≥ 2.
Returns: series float Least square weighted mean. Falls back
to unweighted regression if Σw = 0.

mysourcetypesncsLibrary "mysourcetypes"
Libreria personale per sorgenti estese (Close, Open, High, Low, Median, Typical, Weighted, Average, Average Median Body, Trend Biased, Trend Biased Extreme, Volume Body, Momentum Biased, Volatility Adjusted, Body Dominance, Shadow Biased, Gap Aware, Rejection Biased, Range Position, Adaptive Trend, Pressure Balanced, Impulse Wave)
rclose()
Regular Close
Returns: Close price
ropen()
Regular Open
Returns: Open price
rhigh()
Regular High
Returns: High price
rlow()
Regular Low
Returns: Low price
rmedian()
Regular Median (HL2)
Returns: (High + Low) / 2
rtypical()
Regular Typical (HLC3)
Returns: (High + Low + Close) / 3
rweighted()
Regular Weighted (HLCC4)
Returns: (High + Low + Close + Close) / 4
raverage()
Regular Average (OHLC4)
Returns: (Open + High + Low + Close) / 4
ravemedbody()
Average Median Body
Returns: (Open + Close) / 2
rtrendb()
Trend Biased Regular
Returns: Trend-weighted price
rtrendbext()
Trend Biased Extreme
Returns: Extreme trend-weighted price
rvolbody()
Volume Weighted Body
Returns: Body midpoint weighted by volume intensity
rmomentum()
Momentum Biased
Returns: Price biased towards momentum direction
rvolatility()
Volatility Adjusted
Returns: Price adjusted by candle's volatility
rbodydominance()
Body Dominance
Returns: Emphasizes body over wicks
rshadowbias()
Shadow Biased
Returns: Price biased by shadow length
rgapaware()
Gap Aware
Returns: Considers gap between candles
rrejection()
Rejection Biased
Returns: Emphasizes price rejection levels
rrangeposition()
Range Position
Returns: Where close sits within the candle range (0-100%)
radaptivetrend()
Adaptive Trend
Returns: Adapts based on recent trend strength
rpressure()
Pressure Balanced
Returns: Balances buying/selling pressure within candle
rimpulse()
Impulse Wave
Returns: Detects impulsive moves vs corrections

TimezoneDiffLibLibrary "TimezoneDiffLib"
get_tz_diff(tz1, tz2)
Parameters:
tz1 (string)
tz2 (string)

BossExoticMAs
A next-generation moving average and smoothing library by TheStopLossBoss, featuring premium adaptive, exotic, and DSP-inspired filters — optimized for Pine Script® v6 and designed for Traders who demand precision and beauty.
> BossExoticMAs is a complete moving average and signal-processing toolkit built for Pine Script v6.
It combines the essential trend filters (SMA, EMA, WMA, etc.) with advanced, high-performance exotic types used by quants, algo designers, and adaptive systems.
Each function is precision-tuned for stability, speed, and visual clarity — perfect for building custom baselines, volatility filters, dynamic ribbons, or hybrid signal engines.
Includes built-in color gradient theming powered by the exclusive BossGradient —
//Key Features
✅ Full Moving Average Set
SMA, EMA, ZEMA, WMA, HMA, WWMA, SMMA
DEMA, TEMA, T3 (Tillson)
ALMA, KAMA, LSMA
VMA, VAMA, FRAMA
✅ Signal Filters
One-Euro Filter (Crispin/Casiez implementation)
ATR-bounded Range Filter
✅ Color Engine
lerpColor() safe blending using color.from_gradient
Thematic gradient palettes: STOPLOSS, VAPORWAVE, ROYAL FLAME, MATRIX FLOW
Exclusive: BOSS GRADIENT
✅ Helper Functions
Clamping, normalization, slope detection, tick delta
Slope-based dynamic color control via slopeThemeColor()
🧠 Usage Example
//@version=6
indicator("Boss Exotic MA Demo", overlay=true)
import TheStopLossBoss/BossExoticMAs/1 as boss
len = input.int(50, "Length")
atype = input.string("T3", "MA Type", options= )
t3factor = input.float(0.7, "T3 β", step=0.05)
smoothColor = boss.slopeThemeColor(close, "BOSS GRADIENT", 0.001)ma = boss.maSelect(close, len, atype, t3factor, 0.85, 14)
plot(ma, "Boss Exotic MA", color=smoothColor, linewidth=2)
---
🔑 Notes
Built exclusively for Pine Script® v6
Library designed for import use — all exports are prefixed cleanly (boss.functionName())
Some functions maintain internal state (var-based). Warnings are safe to ignore — adaptive design choice.
Each MA output is non-repainting and mathematically stable.
---
📜 Author
TheStopLossBoss
Designer of precision trading systems and custom adaptive algorithms.
Follow for exclusive releases, educational material, and full-stack trend solutions.
movingaverage, trend, adaptive, filter, volatility, smoothing, quant, technicalanalysis, bossgradient, t3, alma, frama, vma
LogNormalLibrary "LogNormal"
A collection of functions used to model skewed distributions as log-normal.
Prices are commonly modeled using log-normal distributions (ie. Black-Scholes) because they exhibit multiplicative changes with long tails; skewed exponential growth and high variance. This approach is particularly useful for understanding price behavior and estimating risk, assuming continuously compounding returns are normally distributed.
Because log space analysis is not as direct as using math.log(price) , this library extends the Error Functions library to make working with log-normally distributed data as simple as possible.
- - -
QUICK START
Import library into your project
Initialize model with a mean and standard deviation
Pass model params between methods to compute various properties
var LogNorm model = LN.init(arr.avg(), arr.stdev()) // Assumes the library is imported as LN
var mode = model.mode()
Outputs from the model can be adjusted to better fit the data.
var Quantile data = arr.quantiles()
var more_accurate_mode = mode.fit(model, data) // Fits value from model to data
Inputs to the model can also be adjusted to better fit the data.
datum = 123.45
model_equivalent_datum = datum.fit(data, model) // Fits value from data to the model
area_from_zero_to_datum = model.cdf(model_equivalent_datum)
- - -
TYPES
There are two requisite UDTs: LogNorm and Quantile . They are used to pass parameters between functions and are set automatically (see Type Management ).
LogNorm
Object for log space parameters and linear space quantiles .
Fields:
mu (float) : Log space mu ( µ ).
sigma (float) : Log space sigma ( σ ).
variance (float) : Log space variance ( σ² ).
quantiles (Quantile) : Linear space quantiles.
Quantile
Object for linear quantiles, most similar to a seven-number summary .
Fields:
Q0 (float) : Smallest Value
LW (float) : Lower Whisker Endpoint
LC (float) : Lower Whisker Crosshatch
Q1 (float) : First Quartile
Q2 (float) : Second Quartile
Q3 (float) : Third Quartile
UC (float) : Upper Whisker Crosshatch
UW (float) : Upper Whisker Endpoint
Q4 (float) : Largest Value
IQR (float) : Interquartile Range
MH (float) : Midhinge
TM (float) : Trimean
MR (float) : Mid-Range
- - -
TYPE MANAGEMENT
These functions reliably initialize and update the UDTs. Because parameterization is interdependent, avoid setting the LogNorm and Quantile fields directly .
init(mean, stdev, variance)
Initializes a LogNorm object.
Parameters:
mean (float) : Linearly measured mean.
stdev (float) : Linearly measured standard deviation.
variance (float) : Linearly measured variance.
Returns: LogNorm Object
set(ln, mean, stdev, variance)
Transforms linear measurements into log space parameters for a LogNorm object.
Parameters:
ln (LogNorm) : Object containing log space parameters.
mean (float) : Linearly measured mean.
stdev (float) : Linearly measured standard deviation.
variance (float) : Linearly measured variance.
Returns: LogNorm Object
quantiles(arr)
Gets empirical quantiles from an array of floats.
Parameters:
arr (array) : Float array object.
Returns: Quantile Object
- - -
DESCRIPTIVE STATISTICS
Using only the initialized LogNorm parameters, these functions compute a model's central tendency and standardized moments.
mean(ln)
Computes the linear mean from log space parameters.
Parameters:
ln (LogNorm) : Object containing log space parameters.
Returns: Between 0 and ∞
median(ln)
Computes the linear median from log space parameters.
Parameters:
ln (LogNorm) : Object containing log space parameters.
Returns: Between 0 and ∞
mode(ln)
Computes the linear mode from log space parameters.
Parameters:
ln (LogNorm) : Object containing log space parameters.
Returns: Between 0 and ∞
variance(ln)
Computes the linear variance from log space parameters.
Parameters:
ln (LogNorm) : Object containing log space parameters.
Returns: Between 0 and ∞
skewness(ln)
Computes the linear skewness from log space parameters.
Parameters:
ln (LogNorm) : Object containing log space parameters.
Returns: Between 0 and ∞
kurtosis(ln, excess)
Computes the linear kurtosis from log space parameters.
Parameters:
ln (LogNorm) : Object containing log space parameters.
excess (bool) : Excess Kurtosis (true) or regular Kurtosis (false).
Returns: Between 0 and ∞
hyper_skewness(ln)
Computes the linear hyper skewness from log space parameters.
Parameters:
ln (LogNorm) : Object containing log space parameters.
Returns: Between 0 and ∞
hyper_kurtosis(ln, excess)
Computes the linear hyper kurtosis from log space parameters.
Parameters:
ln (LogNorm) : Object containing log space parameters.
excess (bool) : Excess Hyper Kurtosis (true) or regular Hyper Kurtosis (false).
Returns: Between 0 and ∞
- - -
DISTRIBUTION FUNCTIONS
These wrap Gaussian functions to make working with model space more direct. Because they are contained within a log-normal library, they describe estimations relative to a log-normal curve, even though they fundamentally measure a Gaussian curve.
pdf(ln, x, empirical_quantiles)
A Probability Density Function estimates the probability density . For clarity, density is not a probability .
Parameters:
ln (LogNorm) : Object of log space parameters.
x (float) : Linear X coordinate for which a density will be estimated.
empirical_quantiles (Quantile) : Quantiles as observed in the data (optional).
Returns: Between 0 and ∞
cdf(ln, x, precise)
A Cumulative Distribution Function estimates the area under a Log-Normal curve between Zero and a linear X coordinate.
Parameters:
ln (LogNorm) : Object of log space parameters.
x (float) : Linear X coordinate .
precise (bool) : Double precision (true) or single precision (false).
Returns: Between 0 and 1
ccdf(ln, x, precise)
A Complementary Cumulative Distribution Function estimates the area under a Log-Normal curve between a linear X coordinate and Infinity.
Parameters:
ln (LogNorm) : Object of log space parameters.
x (float) : Linear X coordinate .
precise (bool) : Double precision (true) or single precision (false).
Returns: Between 0 and 1
cdfinv(ln, a, precise)
An Inverse Cumulative Distribution Function reverses the Log-Normal cdf() by estimating the linear X coordinate from an area.
Parameters:
ln (LogNorm) : Object of log space parameters.
a (float) : Normalized area .
precise (bool) : Double precision (true) or single precision (false).
Returns: Between 0 and ∞
ccdfinv(ln, a, precise)
An Inverse Complementary Cumulative Distribution Function reverses the Log-Normal ccdf() by estimating the linear X coordinate from an area.
Parameters:
ln (LogNorm) : Object of log space parameters.
a (float) : Normalized area .
precise (bool) : Double precision (true) or single precision (false).
Returns: Between 0 and ∞
cdfab(ln, x1, x2, precise)
A Cumulative Distribution Function from A to B estimates the area under a Log-Normal curve between two linear X coordinates (A and B).
Parameters:
ln (LogNorm) : Object of log space parameters.
x1 (float) : First linear X coordinate .
x2 (float) : Second linear X coordinate .
precise (bool) : Double precision (true) or single precision (false).
Returns: Between 0 and 1
ott(ln, x, precise)
A One-Tailed Test transforms a linear X coordinate into an absolute Z Score before estimating the area under a Log-Normal curve between Z and Infinity.
Parameters:
ln (LogNorm) : Object of log space parameters.
x (float) : Linear X coordinate .
precise (bool) : Double precision (true) or single precision (false).
Returns: Between 0 and 0.5
ttt(ln, x, precise)
A Two-Tailed Test transforms a linear X coordinate into symmetrical ± Z Scores before estimating the area under a Log-Normal curve from Zero to -Z, and +Z to Infinity.
Parameters:
ln (LogNorm) : Object of log space parameters.
x (float) : Linear X coordinate .
precise (bool) : Double precision (true) or single precision (false).
Returns: Between 0 and 1
ottinv(ln, a, precise)
An Inverse One-Tailed Test reverses the Log-Normal ott() by estimating a linear X coordinate for the right tail from an area.
Parameters:
ln (LogNorm) : Object of log space parameters.
a (float) : Half a normalized area .
precise (bool) : Double precision (true) or single precision (false).
Returns: Between 0 and ∞
tttinv(ln, a, precise)
An Inverse Two-Tailed Test reverses the Log-Normal ttt() by estimating two linear X coordinates from an area.
Parameters:
ln (LogNorm) : Object of log space parameters.
a (float) : Normalized area .
precise (bool) : Double precision (true) or single precision (false).
Returns: Linear space tuple :
- - -
UNCERTAINTY
Model-based measures of uncertainty, information, and risk.
sterr(sample_size, fisher_info)
The standard error of a sample statistic.
Parameters:
sample_size (float) : Number of observations.
fisher_info (float) : Fisher information.
Returns: Between 0 and ∞
surprisal(p, base)
Quantifies the information content of a single event.
Parameters:
p (float) : Probability of the event .
base (float) : Logarithmic base (optional).
Returns: Between 0 and ∞
entropy(ln, base)
Computes the differential entropy (average surprisal).
Parameters:
ln (LogNorm) : Object of log space parameters.
base (float) : Logarithmic base (optional).
Returns: Between 0 and ∞
perplexity(ln, base)
Computes the average number of distinguishable outcomes from the entropy.
Parameters:
ln (LogNorm)
base (float) : Logarithmic base used for Entropy (optional).
Returns: Between 0 and ∞
value_at_risk(ln, p, precise)
Estimates a risk threshold under normal market conditions for a given confidence level.
Parameters:
ln (LogNorm) : Object of log space parameters.
p (float) : Probability threshold, aka. the confidence level .
precise (bool) : Double precision (true) or single precision (false).
Returns: Between 0 and ∞
value_at_risk_inv(ln, value_at_risk, precise)
Reverses the value_at_risk() by estimating the confidence level from the risk threshold.
Parameters:
ln (LogNorm) : Object of log space parameters.
value_at_risk (float) : Value at Risk.
precise (bool) : Double precision (true) or single precision (false).
Returns: Between 0 and 1
conditional_value_at_risk(ln, p, precise)
Estimates the average loss beyond a confidence level, aka. expected shortfall.
Parameters:
ln (LogNorm) : Object of log space parameters.
p (float) : Probability threshold, aka. the confidence level .
precise (bool) : Double precision (true) or single precision (false).
Returns: Between 0 and ∞
conditional_value_at_risk_inv(ln, conditional_value_at_risk, precise)
Reverses the conditional_value_at_risk() by estimating the confidence level of an average loss.
Parameters:
ln (LogNorm) : Object of log space parameters.
conditional_value_at_risk (float) : Conditional Value at Risk.
precise (bool) : Double precision (true) or single precision (false).
Returns: Between 0 and 1
partial_expectation(ln, x, precise)
Estimates the partial expectation of a linear X coordinate.
Parameters:
ln (LogNorm) : Object of log space parameters.
x (float) : Linear X coordinate .
precise (bool) : Double precision (true) or single precision (false).
Returns: Between 0 and µ
partial_expectation_inv(ln, partial_expectation, precise)
Reverses the partial_expectation() by estimating a linear X coordinate.
Parameters:
ln (LogNorm) : Object of log space parameters.
partial_expectation (float) : Partial Expectation .
precise (bool) : Double precision (true) or single precision (false).
Returns: Between 0 and ∞
conditional_expectation(ln, x, precise)
Estimates the conditional expectation of a linear X coordinate.
Parameters:
ln (LogNorm) : Object of log space parameters.
x (float) : Linear X coordinate .
precise (bool) : Double precision (true) or single precision (false).
Returns: Between X and ∞
conditional_expectation_inv(ln, conditional_expectation, precise)
Reverses the conditional_expectation by estimating a linear X coordinate.
Parameters:
ln (LogNorm) : Object of log space parameters.
conditional_expectation (float) : Conditional Expectation .
precise (bool) : Double precision (true) or single precision (false).
Returns: Between 0 and ∞
fisher(ln, log)
Computes the Fisher Information Matrix for the distribution, not a linear X coordinate.
Parameters:
ln (LogNorm) : Object of log space parameters.
log (bool) : Sets if the matrix should be in log (true) or linear (false) space.
Returns: FIM for the distribution
fisher(ln, x, log)
Computes the Fisher Information Matrix for a linear X coordinate, not the distribution itself.
Parameters:
ln (LogNorm) : Object of log space parameters.
x (float) : Linear X coordinate .
log (bool) : Sets if the matrix should be in log (true) or linear (false) space.
Returns: FIM for the linear X coordinate
confidence_interval(ln, x, sample_size, confidence, precise)
Estimates a confidence interval for a linear X coordinate.
Parameters:
ln (LogNorm) : Object of log space parameters.
x (float) : Linear X coordinate .
sample_size (float) : Number of observations.
confidence (float) : Confidence level .
precise (bool) : Double precision (true) or single precision (false).
Returns: CI for the linear X coordinate
- - -
CURVE FITTING
An overloaded function that helps transform values between spaces. The primary function uses quantiles, and the overloads wrap the primary function to make working with LogNorm more direct.
fit(x, a, b)
Transforms X coordinate between spaces A and B.
Parameters:
x (float) : Linear X coordinate from space A .
a (LogNorm | Quantile | array) : LogNorm, Quantile, or float array.
b (LogNorm | Quantile | array) : LogNorm, Quantile, or float array.
Returns: Adjusted X coordinate
- - -
EXPORTED HELPERS
Small utilities to simplify extensibility.
z_score(ln, x)
Converts a linear X coordinate into a Z Score.
Parameters:
ln (LogNorm) : Object of log space parameters.
x (float) : Linear X coordinate.
Returns: Between -∞ and +∞
x_coord(ln, z)
Converts a Z Score into a linear X coordinate.
Parameters:
ln (LogNorm) : Object of log space parameters.
z (float) : Standard normal Z Score.
Returns: Between 0 and ∞
iget(arr, index)
Gets an interpolated value of a pseudo -element (fictional element between real array elements). Useful for quantile mapping.
Parameters:
arr (array) : Float array object.
index (float) : Index of the pseudo element.
Returns: Interpolated value of the arrays pseudo element.

Min_Position_Size_ALLLibrary "Min_Position_Size_ALL"
getMinPositionSize(symbol_, type_, broker_)
Parameters:
symbol_ (string)
type_ (string)
broker_ (string)

ICOptimizerLibrary "ICOptimizer"
Library for IC-based parameter optimization
findOptimalParam(testParams, icValues, currentParam, smoothing)
Find optimal parameter from array of IC values
Parameters:
testParams (array) : Array of parameter values being tested
icValues (array) : Array of IC values for each parameter (same size as testParams)
currentParam (float) : Current parameter value (for smoothing)
smoothing (simple float) : Smoothing factor (0-1, e.g., 0.2 means 20% new, 80% old)
Returns: New parameter value, its IC, and array index
adaptiveParamWithStarvation(opt, testParams, icValues, smoothing, starvationThreshold, starvationJumpSize)
Adaptive parameter selection with starvation handling
Parameters:
opt (ICOptimizer) : ICOptimizer object
testParams (array) : Array of parameter values
icValues (array) : Array of IC values for each parameter
smoothing (simple float) : Normal smoothing factor
starvationThreshold (simple int) : Number of updates before triggering starvation mode
starvationJumpSize (simple float) : Jump size when in starvation (as fraction of range)
Returns: Updated parameter and IC
detectAndAdjustDomination(longCount, shortCount, currentLongLevel, currentShortLevel, dominationRatio, jumpSize, minLevel, maxLevel)
Detect signal imbalance and adjust parameters
Parameters:
longCount (int) : Number of long signals in period
shortCount (int) : Number of short signals in period
currentLongLevel (float) : Current long threshold
currentShortLevel (float) : Current short threshold
dominationRatio (simple int) : Ratio threshold (e.g., 4 = 4:1 imbalance)
jumpSize (simple float) : Size of adjustment
minLevel (simple float) : Minimum allowed level
maxLevel (simple float) : Maximum allowed level
Returns:
calcIC(signals, returns, lookback)
Parameters:
signals (float)
returns (float)
lookback (simple int)
classifyIC(currentIC, icWindow, goodPercentile, badPercentile)
Parameters:
currentIC (float)
icWindow (simple int)
goodPercentile (simple int)
badPercentile (simple int)
evaluateSignal(signal, forwardReturn)
Parameters:
signal (float)
forwardReturn (float)
updateOptimizerState(opt, signal, forwardReturn, currentIC, metaICPeriod)
Parameters:
opt (ICOptimizer)
signal (float)
forwardReturn (float)
currentIC (float)
metaICPeriod (simple int)
calcSuccessRate(successful, total)
Parameters:
successful (int)
total (int)
createICStatsTable(opt, paramName, normalSuccess, normalTotal)
Parameters:
opt (ICOptimizer)
paramName (string)
normalSuccess (int)
normalTotal (int)
initOptimizer(initialParam)
Parameters:
initialParam (float)
ICOptimizer
Fields:
currentParam (series float)
currentIC (series float)
metaIC (series float)
totalSignals (series int)
successfulSignals (series int)
goodICSignals (series int)
goodICSuccess (series int)
nonBadICSignals (series int)
nonBadICSuccess (series int)
goodICThreshold (series float)
badICThreshold (series float)
updateCounter (series int)

IC optimiser libLibrary "IC optimiser lib"
Library for IC-based parameter optimization
findOptimalParam(testParams, icValues, currentParam, smoothing)
Find optimal parameter from array of IC values
Parameters:
testParams (array) : Array of parameter values being tested
icValues (array) : Array of IC values for each parameter (same size as testParams)
currentParam (float) : Current parameter value (for smoothing)
smoothing (simple float) : Smoothing factor (0-1, e.g., 0.2 means 20% new, 80% old)
Returns: New parameter value, its IC, and array index
adaptiveParamWithStarvation(opt, testParams, icValues, smoothing, starvationThreshold, starvationJumpSize)
Adaptive parameter selection with starvation handling
Parameters:
opt (ICOptimizer) : ICOptimizer object
testParams (array) : Array of parameter values
icValues (array) : Array of IC values for each parameter
smoothing (simple float) : Normal smoothing factor
starvationThreshold (simple int) : Number of updates before triggering starvation mode
starvationJumpSize (simple float) : Jump size when in starvation (as fraction of range)
Returns: Updated parameter and IC
detectAndAdjustDomination(longCount, shortCount, currentLongLevel, currentShortLevel, dominationRatio, jumpSize, minLevel, maxLevel)
Detect signal imbalance and adjust parameters
Parameters:
longCount (int) : Number of long signals in period
shortCount (int) : Number of short signals in period
currentLongLevel (float) : Current long threshold
currentShortLevel (float) : Current short threshold
dominationRatio (simple int) : Ratio threshold (e.g., 4 = 4:1 imbalance)
jumpSize (simple float) : Size of adjustment
minLevel (simple float) : Minimum allowed level
maxLevel (simple float) : Maximum allowed level
Returns:
calcIC(signals, returns, lookback)
Parameters:
signals (float)
returns (float)
lookback (simple int)
classifyIC(currentIC, icWindow, goodPercentile, badPercentile)
Parameters:
currentIC (float)
icWindow (simple int)
goodPercentile (simple int)
badPercentile (simple int)
evaluateSignal(signal, forwardReturn)
Parameters:
signal (float)
forwardReturn (float)
updateOptimizerState(opt, signal, forwardReturn, currentIC, metaICPeriod)
Parameters:
opt (ICOptimizer)
signal (float)
forwardReturn (float)
currentIC (float)
metaICPeriod (simple int)
calcSuccessRate(successful, total)
Parameters:
successful (int)
total (int)
createICStatsTable(opt, paramName, normalSuccess, normalTotal)
Parameters:
opt (ICOptimizer)
paramName (string)
normalSuccess (int)
normalTotal (int)
initOptimizer(initialParam)
Parameters:
initialParam (float)
ICOptimizer
Fields:
currentParam (series float)
currentIC (series float)
metaIC (series float)
totalSignals (series int)
successfulSignals (series int)
goodICSignals (series int)
goodICSuccess (series int)
nonBadICSignals (series int)
nonBadICSuccess (series int)
goodICThreshold (series float)
badICThreshold (series float)
updateCounter (series int)

LIB_SDz_AucLibrary "LIB_SDz_Auc"
TODO: add library description here
getLineStyle(style)
Parameters:
style (string)

testLibLibrary "testLib"
TODO: add library description here
mySMA(x)
TODO: add function description here
Parameters:
x (int) : TODO: add parameter x description here
Returns: TODO: add what function returns

livremySMATestLibLibrary "livremySMATestLib"
TODO: add library description here
mySMA(x)
TODO: add function description here
Parameters:
x (int) : TODO: add parameter x description here
Returns: TODO: add what function returns

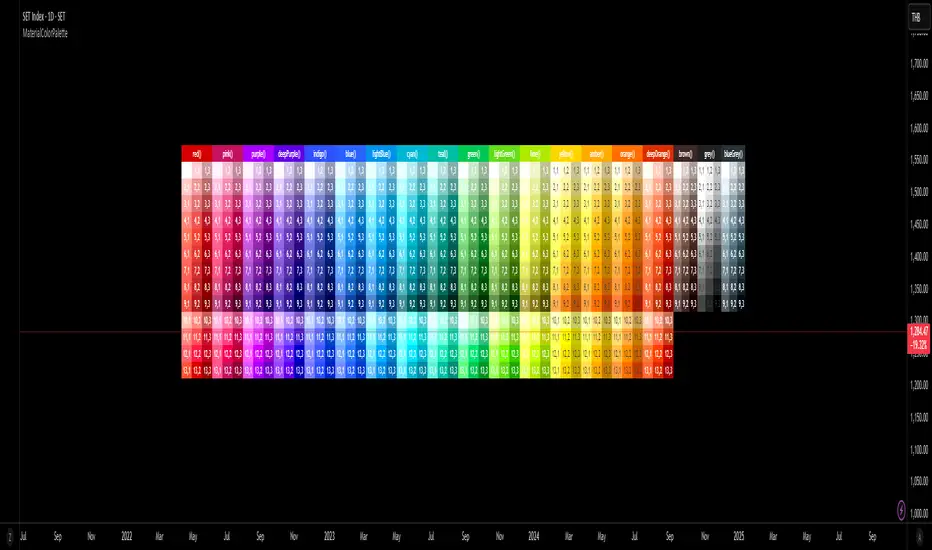
Material Color Palette Library█ OVERVIEW
Unlock a world of color in your Pine Script® projects with the Material Color Palette Library . This library provides a comprehensive and structured color system based on Google's Material Design palette, making it incredibly easy to create visually appealing and professional-looking indicators and strategies.
Forget about guessing hex codes. With this library, you have access to 19 distinct color families, each offering a wide range of shades. Every color can be fine-tuned with saturation, darkness, and opacity levels, giving you precise control over your script's appearance.
To make development even easier, the library includes a visual cheatsheet. Simply add the script to your chart to display a full table of all available colors and their corresponding parameters.
█ KEY FEATURES
Vast Spectrum: 19 distinct color families, from vibrant reds and blues to subtle greys and browns.
Fine-Tuned Control: Each color function accepts parameters for `saturationLevel` (1-13 or 1-9) and `darkLevel` (1-3) to select the perfect shade.
Opacity Parameter: Easily add transparency to any color for fills, backgrounds, or lines.
Quick Access Tones: A simple `tone()` function to grab base colors by name.
Visual Cheatsheet: An on-chart table displays the entire color palette, serving as a handy reference guide during development.
█ HOW TO USE
As a library, this script is meant to be imported into your own indicators or strategies.
1. Import the Library
Add the following line to the top of your script. Remember to replace `YourUsername` with your TradingView username.
import mastertop/ColorPalette/1 as colors
2. Call a Color Function
You can now use any of the exported functions to set colors for your plots, backgrounds, tables, and more.
The primary functions take three arguments: `functionName(saturationLevel, darkLevel, opacity)`
`saturationLevel`: An integer that controls the intensity of the color. Ranges from 1 (lightest) to 13 (most vibrant) for most colors, and 1-9 for `brown`, `grey`, and `blueGrey`.
`darkLevel`: An integer from 1 to 3 (1: light, 2: medium, 3: dark).
`opacity`: An integer from 0 (opaque) to 100 (invisible).
Example Usage:
Let's plot a moving average with a specific shade of teal.
// Import the library
import mastertop/ColorPalette/1 as colors
indicator("My Script with Custom Colors", overlay = true)
// Calculate a moving average
ma = ta.sma(close, 20)
// Plot the MA using a color from the library
// We'll use teal with saturation level 7, dark level 2, and 0% opacity
plot(ma, "MA", color = colors.teal(7, 2, 0), linewidth = 2)
3. Using the `tone()` Function
For quick access to a base color, you can use the `tone()` function.
// Set a red background with 85% transparency
bgcolor(colors.tone('red', 85))
█ VISUAL REFERENCE
To see all available colors at a glance, you can add this library script directly to your chart. It will display a comprehensive table showing every color variant. This makes it easy to pick the exact shade you need without guesswork.
This library is designed for fellow Pine Script® developers to streamline their workflow and enhance the visual quality of their scripts. Enjoy!
UTBotLibrary "UTBot"
is a powerful and flexible trading toolkit implemented in Pine Script. Based on the widely recognized UT Bot strategy originally developed by Yo_adriiiiaan with important enhancements by HPotter, this library provides users with customizable functions for dynamic trailing stop calculations using ATR (Average True Range), trend detection, and signal generation. It enables developers and traders to seamlessly integrate UT Bot logic into their own indicators and strategies without duplicating code.
Key features include:
Accurate ATR-based trailing stop and reversal detection
Multi-timeframe support for enhanced signal reliability
Clean and efficient API for easy integration and customization
Detailed documentation and examples for quick adoption
Open-source and community-friendly, encouraging collaboration and improvements
We sincerely thank Yo_adriiiiaan for the original UT Bot concept and HPotter for valuable improvements that have made this strategy even more robust. This library aims to honor their work by making the UT Bot methodology accessible to Pine Script developers worldwide.
This library is designed for Pine Script programmers looking to leverage the proven UT Bot methodology to build robust trading systems with minimal effort and maximum maintainability.
UTBot(h, l, c, multi, leng)
Parameters:
h (float) - high
l (float) - low
c (float)-close
multi (float)- multi for ATR
leng (int)-length for ATR
Returns:
xATRTS - ATR Based TrailingStop Value
pos - pos==1, long position, pos==-1, shot position
signal - 0 no signal, 1 buy, -1 sell


mt_elliott_coreLibrary "mt_elliott_core"
ewo(maFastLen, maSlowLen, smoothLen)
Parameters:
maFastLen (simple int)
maSlowLen (simple int)
smoothLen (simple int)
mt_phase_num(_len, _minGap)
Parameters:
_len (simple int)
_minGap (simple float)
mt_color_from_phase(_len, _minGap)
Parameters:
_len (simple int)
_minGap (simple float)
mt_phase_progress_pct(_len, _minGap)
Parameters:
_len (simple int)
_minGap (simple float)
anchor_p1_close(len, minGap)
Parameters:
len (simple int)
minGap (simple float)
anchor_p1_pivot(len, minGap)
Parameters:
len (simple int)
minGap (simple float)
row_group_from_ewo(ewoValue, atrValue, strongPct, neutralPct)
Parameters:
ewoValue (float)
atrValue (float)
strongPct (simple float)
neutralPct (simple float)
wave_event_pivot_aligned(ewoSeries, left, right, divTolPct, minBarsGap)
Parameters:
ewoSeries (float)
left (simple int)
right (simple int)
divTolPct (simple float)
minBarsGap (simple int)


DynLenLibLibrary "DynLenLib"
sum_dyn(src, len)
Parameters:
src (float)
len (int)
lag_dyn(src, len)
Parameters:
src (float)
len (int)
highest_dyn(src, len)
Parameters:
src (float)
len (int)
lowest_dyn(src, len)
Parameters:
src (float)
len (int)
var_dyn(src, len)
Parameters:
src (float)
len (int)
stdev_dyn(src, len)
Parameters:
src (float)
len (int)
hl2()
hlc3()
ohlc4()
sma_dyn(src, len)
Parameters:
src (float)
len (int)
ema_dyn(src, len)
Parameters:
src (float)
len (int)
rma_dyn(src, len)
Parameters:
src (float)
len (int)
smma_dyn(src, len)
Parameters:
src (float)
len (int)
wma_dyn(src, len)
Parameters:
src (float)
len (int)
vwma_dyn(price, vol, len)
Parameters:
price (float)
vol (float)
len (int)
hma_dyn(src, len)
Parameters:
src (float)
len (int)
dema_dyn(src, len)
Parameters:
src (float)
len (int)
tema_dyn(src, len)
Parameters:
src (float)
len (int)
kama_dyn(src, erLen, fastLen, slowLen)
Parameters:
src (float)
erLen (int)
fastLen (int)
slowLen (int)
mcginley_dyn(src, len)
Parameters:
src (float)
len (int)
median_price()
true_range()
atr_dyn(len)
Parameters:
len (int)
bbands_dyn(src, len, mult)
Parameters:
src (float)
len (int)
mult (float)
bb_percent_b(src, len, mult)
Parameters:
src (float)
len (int)
mult (float)
bb_bandwidth(src, len, mult)
Parameters:
src (float)
len (int)
mult (float)
keltner_dyn(src, lenEMA, lenATR, multATR)
Parameters:
src (float)
lenEMA (int)
lenATR (int)
multATR (float)
donchian_dyn(len)
Parameters:
len (int)
choppiness_index(len)
Parameters:
len (int)
vol_stop(lenATR, mult)
Parameters:
lenATR (int)
mult (float)
roc_dyn(src, len)
Parameters:
src (float)
len (int)
rsi_dyn(src, len)
Parameters:
src (float)
len (int)
stoch_dyn(kLen, dLen, smoothK)
Parameters:
kLen (int)
dLen (int)
smoothK (int)
stoch_rsi_dyn(rsiLen, stochLen, kSmooth, dLen)
Parameters:
rsiLen (int)
stochLen (int)
kSmooth (int)
dLen (int)
cci_dyn(src, len)
Parameters:
src (float)
len (int)
cmo_dyn(src, len)
Parameters:
src (float)
len (int)
trix_dyn(len)
Parameters:
len (int)
tsi_dyn(shortLen, longLen)
Parameters:
shortLen (int)
longLen (int)
ultimate_osc(len1, len2, len3)
Parameters:
len1 (int)
len2 (int)
len3 (int)
dpo_dyn(src, len)
Parameters:
src (float)
len (int)
willr_dyn(len)
Parameters:
len (int)
macd_dyn(src, fastLen, slowLen, sigLen)
Parameters:
src (float)
fastLen (int)
slowLen (int)
sigLen (int)
ppo_dyn(src, fastLen, slowLen, sigLen)
Parameters:
src (float)
fastLen (int)
slowLen (int)
sigLen (int)
aroon_dyn(len)
Parameters:
len (int)
dmi_adx_dyn(diLen, adxLen)
Parameters:
diLen (int)
adxLen (int)
vortex_dyn(len)
Parameters:
len (int)
coppock_dyn(rocLen1, rocLen2, wmaLen)
Parameters:
rocLen1 (int)
rocLen2 (int)
wmaLen (int)
rvi_dyn(len)
Parameters:
len (int)
price_osc_dyn(src, fastLen, slowLen)
Parameters:
src (float)
fastLen (int)
slowLen (int)
rci_dyn(src, len)
Parameters:
src (float)
len (int)
obv()
pvt()
cmf_dyn(len)
Parameters:
len (int)
adl()
chaikin_osc_dyn(fastLen, slowLen)
Parameters:
fastLen (int)
slowLen (int)
mfi_dyn(len)
Parameters:
len (int)
volume_osc_dyn(fastLen, slowLen)
Parameters:
fastLen (int)
slowLen (int)
up_down_volume()
cvd()
supertrend_dyn(atrLen, mult)
Parameters:
atrLen (int)
mult (float)
envelopes_dyn(src, len, pct)
Parameters:
src (float)
len (int)
pct (float)
linreg_line_slope(src, len)
Parameters:
src (float)
len (int)
lsma_dyn(src, len)
Parameters:
src (float)
len (int)
corrcoef_dyn(a, b, len)
Parameters:
a (float)
b (float)
len (int)
psar(step, maxStep)
Parameters:
step (float)
maxStep (float)
pivots_standard()
williams_alligator(src, jawLen, teethLen, lipsLen)
Parameters:
src (float)
jawLen (int)
teethLen (int)
lipsLen (int)
twap_dyn(src, len)
Parameters:
src (float)
len (int)
vwap_anchored(price, volume, reset)
Parameters:
price (float)
volume (float)
reset (bool)
performance_pct(len)
Parameters:
len (int)

AlgebraGeometryLabLibrary "AlgebraGeometryLab"
Algebra & 2D geometry utilities absent from Pine built-ins.
Rigorous, no-repaint, export-ready: vectors, robust roots, linear solvers, 2x2/3x3 det/inverse,
symmetric 2x2 eigensystem, orthogonal regression (TLS), affine transforms, intersections,
distances, projections, polygon metrics, point-in-polygon, convex hull (monotone chain),
Bezier/Catmull-Rom/Barycentric tools.
clamp(x, lo, hi)
clamp to
Parameters:
x (float)
lo (float)
hi (float)
near(a, b, atol, rtol)
approximately equal with relative+absolute tolerance
Parameters:
a (float)
b (float)
atol (float)
rtol (float)
sgn(x)
sign as {-1,0,1}
Parameters:
x (float)
hypot(x, y)
stable hypot (sqrt(x^2+y^2))
Parameters:
x (float)
y (float)
method length(v)
Namespace types: Vec2
Parameters:
v (Vec2)
method length2(v)
Namespace types: Vec2
Parameters:
v (Vec2)
method normalized(v)
Namespace types: Vec2
Parameters:
v (Vec2)
method add(a, b)
Namespace types: Vec2
Parameters:
a (Vec2)
b (Vec2)
method sub(a, b)
Namespace types: Vec2
Parameters:
a (Vec2)
b (Vec2)
method muls(v, s)
Namespace types: Vec2
Parameters:
v (Vec2)
s (float)
method dot(a, b)
Namespace types: Vec2
Parameters:
a (Vec2)
b (Vec2)
method crossz(a, b)
Namespace types: Vec2
Parameters:
a (Vec2)
b (Vec2)
method rotate(v, ang)
Namespace types: Vec2
Parameters:
v (Vec2)
ang (float)
method apply(v, T)
Namespace types: Vec2
Parameters:
v (Vec2)
T (Affine2)
affine_identity()
identity transform
affine_translate(tx, ty)
translation
Parameters:
tx (float)
ty (float)
affine_rotate(ang)
rotation about origin
Parameters:
ang (float)
affine_scale(sx, sy)
scaling about origin
Parameters:
sx (float)
sy (float)
affine_rotate_about(ang, px, py)
rotation about pivot (px,py)
Parameters:
ang (float)
px (float)
py (float)
affine_compose(T2, T1)
compose T2∘T1 (apply T1 then T2)
Parameters:
T2 (Affine2)
T1 (Affine2)
quadratic_roots(a, b, c)
Real roots of ax^2 + bx + c = 0 (numerically stable)
Parameters:
a (float)
b (float)
c (float)
Returns: with n∈{0,1,2}; r1<=r2 when n=2.
cubic_roots(a, b, c, d)
Real roots of ax^3+bx^2+cx+d=0 (Cardano; returns up to 3 real roots)
Parameters:
a (float)
b (float)
c (float)
d (float)
Returns: (valid r2/r3 only if n>=2/n>=3)
det2(a, b, c, d)
det2 of
Parameters:
a (float)
b (float)
c (float)
d (float)
inv2(a, b, c, d)
inverse of 2x2; returns
Parameters:
a (float)
b (float)
c (float)
d (float)
solve2(a, b, c, d, e, f)
solve 2x2 * = via Cramer
Parameters:
a (float)
b (float)
c (float)
d (float)
e (float)
f (float)
det3(a11, a12, a13, a21, a22, a23, a31, a32, a33)
det3 of 3x3
Parameters:
a11 (float)
a12 (float)
a13 (float)
a21 (float)
a22 (float)
a23 (float)
a31 (float)
a32 (float)
a33 (float)
inv3(a11, a12, a13, a21, a22, a23, a31, a32, a33)
inverse 3x3; returns
Parameters:
a11 (float)
a12 (float)
a13 (float)
a21 (float)
a22 (float)
a23 (float)
a31 (float)
a32 (float)
a33 (float)
eig2_symmetric(a, b, d)
symmetric 2x2 eigensystem: [ , ]
Parameters:
a (float)
b (float)
d (float)
Returns: with unit eigenvectors
tls_line(xs, ys)
Orthogonal (total least squares) regression line through point cloud
Input arrays must be same length N>=2. Returns line in normal form n•x + c = 0
Parameters:
xs (array)
ys (array)
Returns: where (nx,ny) unit normal; (cx,cy) centroid.
orient(a, b, c)
orientation (signed area*2): >0 CCW, <0 CW, 0 collinear
Parameters:
a (Vec2)
b (Vec2)
c (Vec2)
project_point_line(p, a, d)
project point p onto infinite line through a with direction d
Parameters:
p (Vec2)
a (Vec2)
d (Vec2)
Returns: where proj = a + t*d
closest_point_segment(p, a, b)
closest point on segment to p
Parameters:
p (Vec2)
a (Vec2)
b (Vec2)
Returns: where t∈ on segment
dist_point_line(p, a, d)
distance from point to line (infinite)
Parameters:
p (Vec2)
a (Vec2)
d (Vec2)
dist_point_segment(p, a, b)
distance from point to segment
Parameters:
p (Vec2)
a (Vec2)
b (Vec2)
intersect_lines(p1, d1, p2, d2)
line-line intersection: L1: p1+d1*t, L2: p2+d2*u
Parameters:
p1 (Vec2)
d1 (Vec2)
p2 (Vec2)
d2 (Vec2)
Returns:
intersect_segments(s1, s2)
segment-segment intersection (closed segments)
Parameters:
s1 (Segment2)
s2 (Segment2)
Returns: where kind: 0=no, 1=proper point, 2=overlap (ix/iy=na)
circumcircle(a, b, c)
circle through 3 non-collinear points
Parameters:
a (Vec2)
b (Vec2)
c (Vec2)
intersect_circle_line(C, p, d)
intersections of circle and line (param p + d t)
Parameters:
C (Circle2)
p (Vec2)
d (Vec2)
Returns: with n∈{0,1,2}
intersect_circles(A, B)
circle-circle intersection
Parameters:
A (Circle2)
B (Circle2)
Returns: with n∈{0,1,2}
polygon_area(xs, ys)
signed area (shoelace). Positive if CCW.
Parameters:
xs (array)
ys (array)
polygon_centroid(xs, ys)
polygon centroid (for non-self-intersecting). Fallback to vertex mean if area≈0.
Parameters:
xs (array)
ys (array)
point_in_polygon(px, py, xs, ys)
point-in-polygon test (ray casting). Returns true if inside; boundary counts as inside.
Parameters:
px (float)
py (float)
xs (array)
ys (array)
convex_hull(xs, ys)
convex hull (monotone chain). Returns array of hull vertex indices in CCW order.
Uses array.sort_indices(xs) (ascending by x). Ties on x are handled; result is deterministic.
Parameters:
xs (array)
ys (array)
lerp(a, b, t)
linear interpolate between a and b
Parameters:
a (float)
b (float)
t (float)
bezier2(p0, p1, p2, t)
quadratic Bezier B(t) for points p0,p1,p2
Parameters:
p0 (Vec2)
p1 (Vec2)
p2 (Vec2)
t (float)
bezier3(p0, p1, p2, p3, t)
cubic Bezier B(t) for p0,p1,p2,p3
Parameters:
p0 (Vec2)
p1 (Vec2)
p2 (Vec2)
p3 (Vec2)
t (float)
catmull_rom(p0, p1, p2, p3, t, alpha)
Catmull-Rom interpolation (centripetal form when alpha=0.5)
t∈ , returns point between p1 and p2
Parameters:
p0 (Vec2)
p1 (Vec2)
p2 (Vec2)
p3 (Vec2)
t (float)
alpha (float)
barycentric(A, B, C, P)
barycentric coordinates of P wrt triangle ABC
Parameters:
A (Vec2)
B (Vec2)
C (Vec2)
P (Vec2)
Returns:
point_in_triangle(A, B, C, P)
point-in-triangle using barycentric (boundary included)
Parameters:
A (Vec2)
B (Vec2)
C (Vec2)
P (Vec2)
Vec2
Fields:
x (series float)
y (series float)
Line2
Fields:
p (Vec2)
d (Vec2)
Segment2
Fields:
a (Vec2)
b (Vec2)
Circle2
Fields:
c (Vec2)
r (series float)
Affine2
Fields:
a (series float)
b (series float)
c (series float)
d (series float)
tx (series float)
ty (series float)

ema 狀態機Library "ema_flow_lib"
ema_flow_state(e10, e20, e100, entanglePct, farPct, e10_prev, e20_prev)
Parameters:
e10 (float)
e20 (float)
e100 (float)
entanglePct (float)
farPct (float)
e10_prev (float)
e20_prev (float)
state_name(s)
Parameters:
s (int)
