HVPro Style IndicatorHVPro Style Indicator – Historical Volatility + Volume
HVPro Style Indicator is a combined volatility-and-volume tool designed to help traders visualize market expansion and contraction phases.
It calculates Historical Volatility (HV) using log-returns and a customizable lookback period, then smooths the result for a cleaner trend signal.
The script also includes a volume histogram, scaled by a multiplier, with bar colors changing based on whether volatility is rising or falling.
This makes it easy to spot moments when both volume and volatility align, often signaling trend transitions, breakouts, or exhaustion.
Features
✔ Historical Volatility calculation (annualized)
✔ Smoothed HV for cleaner visual trends
✔ Volume histogram with customizable multiplier
✔ Volume bar color shifts based on HV direction
✔ User-controlled visibility for both HV and volume
✔ Lightweight and optimized for all timeframes
How to Use
Rising HV (green volume bars) can indicate trend expansion or breakout momentum.
Falling HV (red bars) suggests contraction, ranging conditions, or volatility cooldown.
Watch for volatility shifts combined with volume spikes for potential trade entries.
Indicators and strategies

MarketMafia Internals Overlay (0.5 steps, pure overlay)This indicator is designed to give you the over all heartbeat of the market for SPY,QQQ and IWM. Designed to give more confirmation on the internals of the markets direction to help keep you on the right side of the market

Second chartThis is a trend-following momentum confirmation indicator designed to filter trades in the direction of the dominant trend while timing entries using RSI momentum shifts.
Best suited for:
✅ Forex & Crypto
✅ 5m – 1H timeframes
✅ Trend continuation strategies
⚙ Inputs Explained
▸ Trend MA Length
Controls the EMA trend filter
Lower value (20–30) → faster, more signals
Higher value (50–100) → slower, stronger trend filter
▸ RSI Length
Controls responsiveness of momentum
Standard setting: 14
Lower → aggressive entries
Higher → conservative entries
▸ Show Buy/Sell Signals
ON → Displays BUY/SELL labels
OFF → Hides all trade signals
▸ Trend Background
ON → Green = Bullish / Red = Bearish
OFF → Clean chart mode
🧠 Signal Logic Breakdown

Trade By Design – Free Edition (v0.1)A clean, high-performance session & liquidity framework designed to bring structure, clarity, and precision to your intraday trading.
This indicator is inspired by the Trade Travel Chill – Trade By Design methodology and provides a free, simplified version of the core concepts—ideal for day traders seeking to understand market structure, session behavior, and intraday liquidity dynamics.
🔍 What This Indicator Does
The Free Edition automatically maps the most important intraday levels and contextual factors that drive daily price delivery.
Key Features:
• HOW / LOW
• IHOD / ILOD / 50% Asia
• HOD / LOD
• PVSRA Candles
• Vector candles
• Perp autooverride
⚠️ Version Notice (v0.1 – Early Release)
This is an early, not all features are active yet.
This version focuses purely on the core structure, keeping everything lightweight and easy to use.
⚠️ Disclaimer
This is an unofficial free re-creation inspired by public concepts taught in the Trade By Design methodology.
It is not endorsed, affiliated with, or sponsored by TradeTravelChill.club or its owners.
If you enjoy this indicator and want the complete methodology, mentorship, and full system, please support the original creators by purchasing the official course at:
👉 tradetravelchill.club

EMCT - Explosion Matrix / Candle TechScript Purpose
The "Explosion Matrix • Micro-Scalp Edition" is a highly aggressive 1-minute scalping indicator designed specifically for Bitcoin (and other crypto) trading. It detects three types of high-probability price action patterns in real time: reversal patterns (trend changes), continuation patterns (trend follow-through), and micro patterns (tiny scalp setups), with a special focus on visually highlighting strong rejection candles like Shooting Stars and Hammers.
Core Detection Logic
The script identifies classic and enhanced candlestick patterns (Shooting Star, Hammer, and large-body "John Wick" candles) by analyzing wick-to-body ratios, close position within the range, and candle size relative to ATR. It classifies each pattern as either reversal (against the trend) or continuation (with the trend) based on EMA alignment (8-21-50) and price position.
Trend & Momentum Context
Uses a triple EMA system (fast=8, mid=21, slow=50) to determine strong/weak trends. Momentum is checked via recent price direction. This context decides whether a rejection candle acts as reversal (at exhaustion) or continuation (pullback in strong trend).
Optional Confirmation Filters
Cumulative Volume Delta (CVD) Z-Score: measures aggressive buying/selling pressure; can be required for signals
Volume surge detection: filters for candles with significantly above-average volume
Scoring & Visual System
Each detected pattern receives a score (2–9+) based on strength, reversal/continuation type, and confirmation filters. Higher scores = brighter, larger, more opaque colored frames drawn around the candle(s). Frames are adaptive in size: largest for reversals, medium for continuations, smallest for micro signals.
Visual Output
Draws colored rectangular "explosion frames" directly on the chart around triggering candles. Labels show direction and type (REV↑, CON↓, ↑/↓) with optional score. Intensity-based coloring ranges from mild to extreme bull/bear.
Additional Features
Includes a separate CVD Z-Score subplot with threshold lines, customizable visual styles (Adaptive/Uniform/Minimal), and built-in alerts that fire separately for reversal and continuation patterns. Optimized for maximum detection frequency in fast-moving 1-minute crypto markets

HTF Candles Display MCThis indicator allows you to put up the live price from any timeframe to any timeframe.
You can choose how many candles it showcases.
Stay up to date with your power of 3 at all times


B/B Timeframe This indicator showcases the current state of every timeframe. (Bullish / Bearish)
Keeps it in check at all times and changes the changes are happening live.

Felix-Style Breakout ScannerThis stock scanner will scan stocks back on the 50MA, heartbeat pattern and buy volume to detect a good buying opportunity.

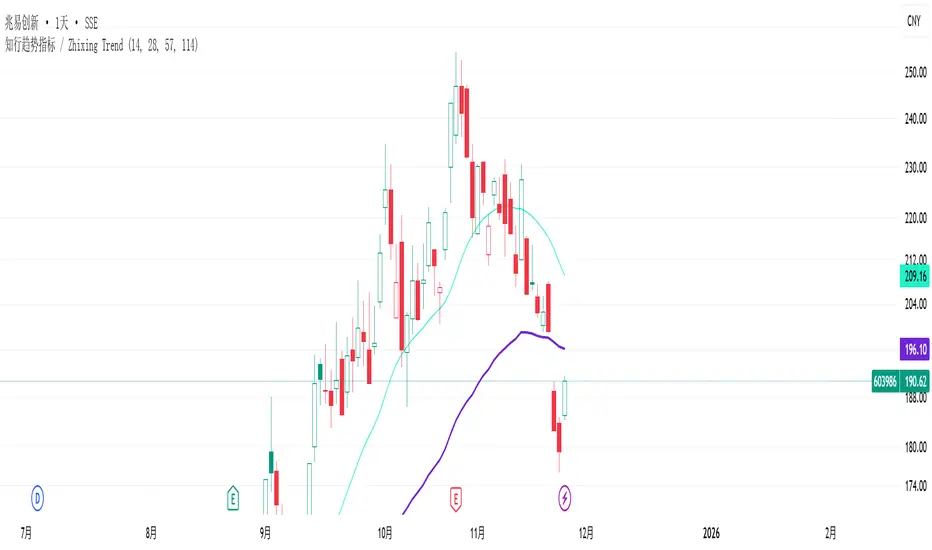
知行趋势指标根据Z哥给的通达信指标翻译为pine script,去掉了TV没有的行业板块概念信息。
知行趋势指标(Zhixing Trend Indicato)
知行趋势指标是一种基于多重均线的趋势跟踪工具,结合短期 EMA 与多周期 SMA,以判断市场的短期和中长期趋势。
指标组成:
知行短期趋势线(zx_short):采用双 EMA(EMA(EMA(Close, 10),10))计算,反应价格的短期波动和趋势。
知行多空线(zx_trend):由四条不同周期的 SMA 平均计算(默认周期 M1=14, M2=28, M3=57, M4=114),用于判断市场的多空方向。
使用说明:
指标只在日线及以上周期显示,分钟和小时级别周期自动隐藏。
短期趋势线可以捕捉快速的价格变化,而多空线用于确认整体趋势方向。
可通过调整四条 SMA 周期,适应不同市场和品种的波动特点。
Zhixing Trend Indicator
The Zhixing Trend Indicator is a trend-following tool based on multiple moving averages. It combines short-term EMA with multi-period SMA to identify both short-term and medium-to-long-term market trends.
Components:
Short-Term Trend Line (zx_short): Calculated using a double EMA (EMA(EMA(Close,10),10)), reflecting short-term price fluctuations and trend.
Bull-Bear Line (zx_trend): Calculated as the average of four SMAs with different periods (default M1=14, M2=28, M3=57, M4=114), used to determine overall market direction.
Usage Notes:
This indicator only displays on daily or higher timeframes; intraday (minute/hour) charts are automatically hidden.
The short-term trend line captures fast price movements, while the bull-bear line confirms the overall trend.
SMA periods can be adjusted to suit different markets or trading instruments.
Position Size Calculator - R & ATR v1# Position Size Calculator - R & ATR
Professional position sizing tool for crypto traders using risk management principles and ATR-based stop loss placement.
## Features
✅ **Automatic ATR Calculation** - Uses ATR(14) by default, customizable period
✅ **Risk Management** - Calculate position size based on portfolio % risk
✅ **Tranche Support** - Split positions into multiple entries
✅ **Visual Stop Loss** - Red line showing stop loss placement on chart
✅ **Real-time Results** - Table displays all calculations instantly
✅ **Clean Interface** - Professional table with all key metrics
## How It Works
The indicator calculates optimal position size using this formula:
1. **Risk Amount** = Portfolio Size × (Risk % / 100)
2. **Stop Distance** = ATR × Multiplier
3. **Stop Loss Price** = Entry Price - Stop Distance
4. **Position Size** = Risk Amount / Stop Distance
5. **Tranche Size** = Position Size / Number of Tranches
## Settings
**Portfolio & Risk**
- Portfolio Size (USD): Your total trading capital
- Risk per Trade (R in %): Percentage of portfolio to risk per trade
- Number of Tranches: Split position into multiple entries
**ATR Settings**
- ATR Length: Period for ATR calculation (default: 14)
- ATR Multiplier: Multiply ATR for stop loss distance (0.5x, 1x, 1.5x, etc.)
**Display**
- Show Stop Loss Line: Toggle red stop loss line on chart
- Show Calculation Table: Toggle results table
## Results Displayed
- Risk Amount (1R): Dollar amount risked on trade
- Stop Distance: Distance from entry to stop loss
- Stop Loss: Exact stop loss price
- Risk per Coin: Amount risked per unit
- Position Size (coins): Number of coins to buy

RSI Regime & Reversals (Leading) — Bull/Bear Trend Finder📈 RSI Regime & Reversals (Leading) — Bull/Bear Trend Finder
This advanced RSI-based tool helps identify bullish and bearish market trends before they happen — combining classic RSI analysis with Cardwell-style reversals and range shift detection to act as a leading indicator rather than a lagging one.
🧠 Core Concept
The script detects when RSI behavior “shifts ranges,” a signature of trend changes:
• Bull Regime — RSI pullbacks hold above ~40 (momentum stays strong)
• Bear Regime — RSI rallies stall below ~60 (momentum weakens)
It then looks for leading clues inside those regimes:
• ✅ Positive Reversal: Price makes a higher low while RSI makes a lower low — a bullish continuation or early trend reversal signal.
• ❌ Negative Reversal: Price makes a lower high while RSI makes a higher high — an early warning of weakness.
• 🔁 Classic Divergences: Confirms reversals when RSI and price diverge at pivot points.
🎯 Signals
• Green “▲ Bull lead” — bullish reversal or divergence detected.
• Red “▼ Bear lead” — bearish reversal or divergence detected.
• Optional background shading:
• 🟩 Teal = Bullish regime
• 🟥 Red = Bearish regime
⚙️ Customization
• Regime sensitivity — Adjust RSI floor/ceiling for your asset’s volatility.
• Pivot sensitivity — Tune pivot lookback (L/R bars) for faster or slower signals.
• RSI smoothing — Filters noise without losing responsiveness.
• Alerts included — Trigger TradingView alerts for bullish or bearish leading signals.
🕵️♂️ Why it’s different
Unlike standard RSI divergences (which confirm after the move), this indicator uses positive/negative reversals to identify potential trend shifts early — a technique favored by Andrew Cardwell’s RSI analysis.
📊 Works great for:
• Swing trading and trend detection
• Spotting momentum regime shifts
• Stocks, crypto, FX, indices

AbundanceThis tool is purpose-built for the Indian market landscape.
Tailored for dedicated long-term market participants, this indicator assists with investment decisions in both shares and ETFs. The script harnesses a blend of technical elements—Super Trend, RSI, multiple EMAs, and their dynamic relationships (for example, a 50 EMA positioned above 200 EMA indicates bullish momentum).
Through actionable notifications and buy cues on daily charts, the indicator supports anyone aiming to build a resilient portfolio. The indicator caters both high risk and risk averse investors.
Every mechanism is intended to deliver an actionable perspective, ensuring a comprehensive approach for those seeking effective capital growth.
Designed specifically for the daily timeframe , this indicator places buy signals as color-coded arrows exclusively on daily candles.
The tool functions as an all-inclusive solution for both stock and ETF investors, applying tailored accumulation logic to each asset category.
Some context of the Indicator used and what they imply:
• 50 EMA (Daily) – Measures intermediate trends
• 200 EMA (Daily) – Gauges long-term direction
• Daily timeframe – Identifies short-term movement
• Weekly timeframe – Assesses intermediate perspective
• Monthly timeframe – Reveals long-term context
ETF Module
ETF Selection Logic: The script implements explicit screening for ETFs, allowing users to operate with greater nuance through four unique accumulation intensity levels.
• Purple Arrow: Signals mild accumulation opportunities for aggressive dip-buyers—triggered when the 50 EMA is above the 200 EMA (i.e., uptrend), daily RSI drops below 40, the ETF price closes between the two EMAs, and weekly RSI remains above 50. If weekly RSI fails this threshold, signals are withheld to maintain trend integrity.
• Green Arrow: Indicates moderate accumulation, appearing in downtrends (200 EMA above 50 EMA) when daily RSI is in the oversold area and the price dips below 200 EMA.
• Blue Arrow: Represents strong accumulation. Both daily and weekly RSIs fall below 40 and the script’s close is under 200 EMA. Optimized for patient investors looking to accumulate during medium-term weakness.
• Red Arrow: Marks rare, very strong accumulation zones. RSIs across daily, weekly, and monthly timeframes must all read oversold with the price below 200 EMA, signifying potential long-term undervaluation but also substantial weakness. Patience is vital, as recovery may require extended periods.
Stock Module
Ideal for application on stocks within the Nifty 200—a universe proven through liquidity and market record. Stock accumulation signals come in two calibrated levels:
• Level 1 – Purple Arrow (early, mild accumulation): Suited for investors who have missed prior reversal zones or want additional entries in ongoing uptrends. Requires weekly and monthly RSI values above 50—i.e., no medium or long-term weakness. Accumulation signals occur when the stock trades below its 50 EMA but above its 200 EMA (with 50 EMA above 200 EMA indicating a healthy uptrend), and ADX reads below 22 (confirming the decline is not part of an accelerating downtrend).
• Level 2 – High conviction, Potential Reversal: Designed for risk-averse users, this level targets stocks that have corrected significantly and approach the 200 EMA on daily charts. Accumulation is triggered only when short-term downtrends reverse (Super Trend indicator shifts from red to green). Orange upward triangles serve as a preparatory signal for anticipated reversals, while green upward triangles mark confirmed buy events. If Super Trend returns to red after an alert but before a buy, the sequence is invalidated, limiting false signals.
All signals aim to provide precise market timing without exposing conservative investors to unnecessary risk.
Arrow colors are visually summarized on the right panel for constant reference for both ETFs and Stocks.

GK BOS ultimateGK BOS ultimate is a structured Break of Structure tool designed to highlight major shifts in the market structure.
The script identifies when price breaks above a significant previous high or below a significant low, using a defined lookback period and a ATR filter to reduce weak or minor breakouts
When a major bullish or bearish structure breaks occurs, the indicator marks the chart with a GK BUY or GK SELL label.
It also plots a TP1 level based on ATR(14) multiplied by a user-selected factor.
This provides a consistent volatility-based reference point that helps traders analyse potential follow-through areas after a structure break.
HOW IT WORKS
the script calculates the highest high and lowest low over the chosen lookback period
A break of structure is confirmed only if the close moves beyond these levels with enough strength relative to ATR, When this happens the indicator
Prints GK BUY for bullish structure breaks
Prints GK SELL for bearish structure breaks
Plots a corresponding TP1 PRINT derived from recent volatility
no repainting occurs because calculations are based on confirmed closes
this TOOL is intended for educational and analytical purposes only

CE-PE Options Price Tracker - Call, Put, PCR, Calendar SpreadThis advanced TradingView indicator provides a real-time, side-by-side visualization of both Call and Put option price action for Indian derivatives—including Nifty
, BankNifty
, Sensex
, and major commodities.
Designed for active option traders, it simplifies scanning for directional bias, volatility, and premium flows at any user-selected strike.
Key Features:
Dual Option Candle Visualization: Instantly visualize both Call and Put prices as candlesticks for any selected strike—compare price action, structure, and momentum with clarity.
Premium Differential Tracking (C-P Diff): Analyze market skew and sentiment with live premium difference between Call and Put options.
Put-Call Ratio (PCR) Widget: Real-time PCR analysis and signal (Bullish/Bearish/Neutral) with custom threshold levels, helping you track sentiment shifts and trading triggers.
Calendar Spread Analysis: Easily spot arbitrage and hedging opportunities between near and next expiry dates for both Call and Put—coloured expansion/contraction signals keep you focused on volatility premium flows.
Volatility Panel: Live volatility calculation on both calls and puts, along with Buy/Sell signals to alert you of trend or momentum shifts based purely on option volatility.
User-Friendly Controls: Pick underlying, strike, expiry (including next expiry) and custom colour themes in seconds.
Visual Alerts: Candle and shape signals for key option price trend events and PCR reversals.
How to Use:
Apply this indicator to any Indian index or commodity options chart on TradingView.
Select the underlying, expiry, and strike to monitor.
All signals and premium data update in real time—supporting scalping, swing, or statistical strategies.
Best Suited For:
Directional option traders
Arbitrage and calendar spread specialists
PCR sentiment and volatility signal followers
Active intraday and expiry scalpers
Anyone wanting a fast options dashboard with intuitive dashboard-style visuals
Note:
This tool is designed for study and analysis only. Options trading involves significant risk.
Always combine technical analysis with risk management and consult a financial advisor if needed.

ICT FVG & Order Flow (IRL to ERL)Overview
Master liquidity with precision. This indicator brings the iCT trading concept to life by automatically detecting liquidity pools, fair value gaps, and key swing points. It shows you exactly where price is likely to move next — from Internal Range Liquidity (IRL) to External Range Liquidity (ERL). With built-in alerts and multi-timeframe validation, it helps you stay one step ahead of the market.
Concept
Markets move where liquidity is. According to iCT theory, price usually sweeps internal liquidity (IRL) first and then hunts for external liquidity (ERL). By mapping this process in real time, the indicator provides a clear framework for understanding market structure, liquidity grabs, and directional bias.
How it works
Detects the High-Probability Leg (HPL) — the leg containing a fair value gap (FVG)
Highlights unmitigated FVGs within the current context.
Marks swing points (SPs), IRL levels, and ERL targets automatically.
Identifies IRL rejections when liquidity is taken inside the leg.
Identifies if a FVG is Respected or Disrespected by 2 Candle Rejection (2CR)
Notifies you of every critical liquidity event:
New context leg
New FVG
IRL rejection
ERL or SP liquidity sweep
FVG is Respected or Disrespected by 2CR
Key Features
Automatic drawing of IRL, ERL, and SP levels
FVG types: Simple FVG or Breakaway Gap (BAG)
Multi-timeframe sweep check – if a single candle takes both IRL and ERL, the indicator zooms into a lower timeframe to confirm which liquidity was swept first
Fully customizable alerts for all liquidity events
Flexible settings for swing points, lookback depth, colors, and style
How to use
Start from the monthly chart to define the macro trend.
Analyze the latest order flow leg:
Bullish FVG = bullish context
Bearish FVG = bearish context
Step down to the daily timeframe and repeat the analysis.
Wait for price to approach or reject from IRL (the indicator highlights it automatically).
Drop to a lower timeframe for entries — use timeframe alignment to select the right LTF.
Enter with the FVG model, targeting liquidity within the leg.
Place take profit inside the context — e.g., never above ERL in a bullish setup.
🔔 Alerts
New Context
New FVG
IRL Rejection
ERL Sweep
SP Sweep
2CR
⚙️ Customization
Context side (auto/manual)
LTF pointer (auto/manual)
Show/hide Resistance FVG, Overlapping Defense, ERL/SP sweeps, 2CR
Look back bars, swing lines, swing length, line offsets
* Full color customization (FVG, bullish/bearish, labels, boxes)

KLS Ultimate V.1"KLS Ultimate V.1" is a meticulously designed trading indicator. It is built specifically for "Scalpers" (traders who want quick in-and-out profits).
**🚀 How it Works: The 3-Level Logic**
This indicator doesn't just rely on one tool. It gathers several indicators to have a "meeting" and confirm everything before giving you a Buy or Sell signal.
**🎯 Level 1: Core Trend (The Gatekeepers)**
This is the first checkpoint. If the price doesn't pass this stage, no signal gets generated.
- EMA: Is the price standing above the trend line? (Uptrend needs to be above, Downtrend below).
- MACD: Checks momentum and looks at the Histogram to see if real buying/selling volume is coming in.
- ADX: Measures trend strength (it won’t trade in boring, sideways markets).
**🔥 Level 2: Momentum (Finding the Best Entry)**
The second checkpoint to find the perfect spot to jump in.
- RSI: Checks if the price is Oversold (too cheap) or Overbought (too expensive).
- Stochastic: Finds short-term reversal crossovers.
**⭐ Level 3: Signal Boosters (For Strict Mode)**
A special bonus stage for those who want high accuracy (enable this in settings).
- RSI Divergence: Spots conflicts between price and RSI (e.g., Price drops but RSI rises = ready to pump).
- Price Action: Checks for strong candlestick patterns that show a clear winner between buyers and sellers.
------------------------------------------------------------
**🎮 User Guide**
Once you add this code to TradingView, here is what you will see and how to use it:
**A. Entry Signals**
🟢 Green BUY Label: Pops up below the candle.
* Means: Uptrend + Momentum + All filters passed.
🔴 Red SELL Label: Pops up above the candle.
* Means: Downtrend + Selling pressure + All filters passed.
**B. TP/SL Lines (Profit & Loss)**
The system calculates these automatically—no need to measure manually!
- Blue Line: Entry point.
- Light Green (TP1, TP2): Short-term profit targets.
- Dark Green (TP3): Long-term profit target.
- Red Line (SL): Stop Loss point.
**C. Special Mode: Strict Filter**
- Normal (False): Uses only Level 1 + Level 2. You get more signals.
- Strict (True): Needs Level 1 + 2 + 3 to trigger. Fewer signals, but much higher accuracy.
------------------------------------------------------------
**🛠️ Settings & Customization**
Click the gear icon to tweak the settings as you like:
1. Show BUY/SELL Signals: Uncheck if you don't want to see the labels.
2. Use Strict Filter: Check this for high precision (but you'll wait longer for signals).
3. Point Size: **Very Important!** This defines the TP/SL distance.
- For Gold (XAUUSD): Use **0.01**.
- For Forex pairs: Try **0.0001**.
- *Tip: Adjust this number until the TP/SL lines look reasonable on your chart.*
4. TP/SL Points: Set your desired profit/loss distance (e.g., TP1 = 50 points).
------------------------------------------------------------
💡 **Pro Tips**
- Trading Time: This code is smart—it checks sessions (based on GMT+7/Thai Time). It only gives signals during active markets (Sydney, Tokyo, London, NY). It stays quiet during dead hours.
- Recommended Timeframe: Since it's for Scalping, it works best on **M5, M15, or M30**.
- Money Management: Even with SL lines, always calculate your Lot Size properly. Don't overtrade!
------------------------------------------------------------
"KLS Ultimate V.1" เป็นเครื่องมือช่วยเทรด (Indicator) ที่ออกแบบมาอย่างปราณีตและซับซ้อนพอสมควร โดยเน้นไปที่ "สาย Scalping" (เทรดสั้นทำกำไรเร็ว) โดยเฉพาะ
🚀 เจาะลึกการทำงาน: ระบบกรอง 3 ชั้น (The 3-Level Logic)
อินดิเคเตอร์ตัวนี้ไม่ได้ใช้แค่เครื่องมือเดียวตัดสินใจ แต่มันเอาอินดิเคเตอร์หลายตัวมา "คอนเฟิร์ม" กันก่อนจะบอกให้คุณ Buy หรือ Sell ครับ
🎯 Level 1: ตัวคุมเทรนด์หลัก (Core Indicators)
นี่คือด่านแรก ถ้าไม่ผ่านด่านนี้ จะไม่มีสัญญาณเกิดขึ้น
- EMA (เส้นค่าเฉลี่ย): เช็คว่าราคายืนเหนือเส้นเทรนด์ไหม? (ขาขึ้นต้องยืนเหนือ, ขาลงต้องอยู่ใต้)
- MACD (โมเมนตัม): ดูแรงส่งของกราฟ และดู Histogram ว่ามีแรงซื้อ/ขาย เข้ามาจริงไหม
- ADX: วัดความแข็งแรงของเทรนด์ (ถ้าตลาดไซด์เวย์น่าเบื่อๆ ADX ต่ำๆ มันจะไม่เทรด)
🔥 Level 2: จุดกลับตัว (Momentum Indicators) ด่านที่สอง หาจังหวะเข้าที่ได้เปรียบ
- RSI: ดูว่าราคาถูกเกินไป (Oversold) หรือแพงเกินไป (Overbought) หรือยัง
- Stochastic: หาจุดตัดเพื่อยืนยันจุดกลับตัวระยะสั้น
⭐ Level 3: ตัวบูสต์สัญญาณ (Boost Indicators - สำหรับโหมด Strict)
ด่านพิเศษ สำหรับคนที่ต้องการความชัวร์ระดับสูง (เปิดใช้ได้ในตั้งค่า)
- RSI Divergence: หาสัญญาณขัดแย้งระหว่างราคากับ RSI (เช่น ราคาลงแต่ RSI ยกขึ้น = เตรียมพุ่ง)
- Price Action: ดูรูปแบบแท่งเทียนว่ามีแรงซื้อ/ขาย ชนะขาดลอยหรือไม่
------------------------------------------------------------
🎮 คู่มือการใช้งาน (User Guide)
เมื่อคุณแปะโค้ดนี้ลงใน TradingView แล้ว สิ่งที่คุณจะเห็นและการใช้งานมีดังนี้ครับ:
A. สัญญาณเข้าออเดอร์ (Entry Signals)
🟢 ป้าย BUY (สีเขียว): จะโผล่ใต้แท่งเทียน
แปลว่า: เทรนด์เป็นขาขึ้น + โมเมนตัมมา + ผ่านเงื่อนไขกรองต่างๆ แล้ว
🔴 ป้าย SELL (สีแดง): จะโผล่เหนือแท่งเทียน
แปลว่า: เทรนด์เป็นขาลง + แรงขายมา + ผ่านเงื่อนไขกรองต่างๆ แล้ว
B. เส้นเป้าหมายกำไร/ขาดทุน (TP/SL Lines)
ระบบคำนวณให้อัตโนมัติ ไม่ต้องนั่งวัดเอง!
- เส้นสีน้ำเงิน: จุดเข้า (Entry)
- เส้นสีเขียวอ่อน (TP1, TP2): เป้าทำกำไรระยะใกล้
เส้นสีเขียวเข้ม (TP3): เป้าทำกำไรระยะไกล
เส้นสีแดง (SL): จุดยอมแพ้ (Stop Loss)
C. โหมดพิเศษ: Strict Filter (โหมดเข้มงวด)
- ค่าปกติ (False): ใช้แค่ Level 1 + Level 2 ก็เกิดสัญญาณแล้ว (สัญญาณเยอะหน่อย)
- ถ้าเปิดใช้ (True): ต้องผ่าน Level 1 + 2 + 3 ถึงจะเกิดสัญญาณ (สัญญาณน้อย แต่แม่นยำสูงมาก)
------------------------------------------------------------
🛠️ วิธีตั้งค่าและปรับแต่ง (Settings)
ในหน้าตั้งค่า (รูปเฟือง) คุณสามารถปรับจูนได้ตามใจชอบ:
1. Show BUY/SELL Signals: ติ๊กออกถ้าไม่อยากเห็นป้ายสัญญาณ
2. Use Strict Filter: ติ๊กถูกถ้าอยากได้สัญญาณแม่นๆ (แต่รอนานหน่อย)
3. Point Size: สำคัญมาก! ใช้กำหนดระยะ TP/SL
- ถ้าเทรดทอง (XAUUSD) ตั้งค่าพื้นฐาน 0.01 เท่านั้น
- ถ้าเทรดคู่เงิน (Forex) อาจจะปรับเป็น 0.0001
- แนะนำให้ลองปรับจนเส้น TP/SL บนกราฟดูสมเหตุสมผล
4. TP/SL Points: กำหนดระยะจุดกำไรขาดทุนที่ต้องการ (เช่น TP1 = 50 จุด)
------------------------------------------------------------
💡 คำแนะนำเพิ่มเติม (Tips)
- เวลาเทรด: โค้ดนี้ฉลาดมาก มันมีการเช็คเวลา (Session) ให้ด้วย โดยอิงเวลา GMT+7 (เวลาไทย) โดยจะเทรดเฉพาะช่วงที่มีตลาดหลักเปิด (Sydney, Tokyo, London, NY) ช่วงตลาดวายดึกๆ หรือเช้ามืดเงียบๆ มันจะไม่บอกสัญญาณ
- Timeframe ที่แนะนำ: เนื่องจากเขียนมาเพื่อ Scalping แนะนำให้ใช้กับ M5, M15 หรือ M30 จะเห็นผลดีที่สุดครับ
- การบริหารเงิน (MM): แม้ระบบจะมี SL ให้ แต่คุณควรคำนวณ Lot Size ให้เหมาะสม ไม่ควร Overtrade ครับ


YenCarry IndexA risk gauge that signals when USD/JPY is moving fast enough to make yen intervention likely by Ministry of Finance.

Market Sentiment [NeuraAlgo]
Market Sentiment
This indicator provides a real-time view of market momentum and sentiment by analyzing bullish and bearish impulses using price and volatility-based calculations. It visualizes trends on the chart and offers a dashboard with key statistics.
1.Status Calculation
The Status measures bullish momentum by identifying strong upward impulses.
Equation:
Status Source = Average of lows where(Low - High ) > ATR
For each bar, it checks if the current low minus the high from two bars ago exceeds the Average True Range (ATR) .
All lows that satisfy this condition are collected.
The average of these lows forms the Status Source , representing the level of strong buying pressure.
This helps traders visualize where significant bullish activity is concentrated and gauge upward momentum.
2.Status Source Calculation
Similarly, bearish impulses are detected by checking if highs fall below lows from two bars ago beyond ATR thresholds. The corresponding levels form the reference for selling pressure.
3. Trend Strength and States
Strength is Quantifies how far the price is from bullish or bearish reference levels as a percentage.
Trend States
Stability Phase (Gray): Market is quiet, minimal momentum.
Positive Flow (Green): Bullish pressure dominates; buyers are in control.
Negative Flow (Red): Bearish pressure dominates; sellers lead.
State Transition: Market is shifting; momentum is building.
4. Visuals
Bar colors indicate trend state: green for bullish, red for bearish, gray for neutral.
Filled zones highlight bullish and bearish reference levels for intuitive trend analysis.
5. Dashboard
An optional dashboard displays:
Sentiment: Visual gradient representing bullish or bearish dominance.
Status: Current trend state in concise, human-readable terms.
6. Purpose:
This indicator is designed to identify the current market status and the behavior of the asset by analyzing bullish and bearish impulses. It helps traders understand whether the market shows signs of stability, growth, or decline based on the asset’s price action and volatility.
Understand the asset behavior
Healthy asset behavior
Weak asset behavior
Market Sentiment combines price action, ATR-based volatility, and impulse tracking to provide a clear and actionable view of market conditions. The BullLine equation ensures that only meaningful bullish moves are highlighted, giving traders a reliable reference for momentum and potential entry points.


Thirdeyechart index weekly 2Positive values indicate weekly bullish momentum, while negative values show weekly bearish pressure. The results are displayed in a minimal, easy-to-read table format, suitable for intraday, swing, and position traders who rely on higher-timeframe bias.
This version is intentionally simple, fast, and lightweight, designed for traders who want a straightforward understanding of weekly strength without unnecessary complexity.
