ATR-Normalized VWMA DeviationThis indicator measures how far price deviates from the Volume-Weighted Moving Average ( VWMA ), normalized by market volatility ( ATR ). It identifies significant price reversal points by combining price structure and volatility-adjusted deviation behavior.
The core idea is to use VWMA as a dynamic trend anchor, then measure how far price travels away from it relative to recent volatility . This helps highlight when price has stretched too far and may be due for a reversal or pullback.
How it works:
VWMA deviation is calculated as the difference between price and the VWMA.
That deviation is divided by ATR (Average True Range) to normalize for current volatility.
The script tracks the highest and lowest normalized deviations over the chosen lookback period.
It also tracks price structure (highest/lowest highs/lows) over the same period.
A reversal signal is generated when a historical extreme in deviation aligns with a price structure extreme, and a confirmed reversal candle forms.
You get visual signals and color highlights where these conditions occur.
Settings explained:
Lookback period defines how many bars the script uses to find recent extremes.
ATR length controls how volatility is measured.
VWMA length controls how the volume-weighted moving average is calculated.
Signal filters help refine entries based on price vs deviation behavior.
Display options let you customize how signals and levels appear on the chart.
This indicator is especially useful for spotting potential turning points where price has moved far from VWMA relative to volatility, suggesting possible exhaustion or overextension.
Tips for use:
Combine with broader trend context (higher timeframe support/resistance).
Use with risk management rules (position sizing, stops) — signals are guides, not guaranteed entries.
Adjust lookback and ATR settings based on your trading timeframe and asset volatility.
Pivot points and levels

Volume Profile Lite [JOAT]
Volume Profile Lite — Simplified Volume-at-Price Analysis
Volume Profile Lite creates a histogram showing volume distribution across price levels using a proprietary lightweight calculation method. It identifies the Point of Control (POC), Value Area High, and Value Area Low—key concepts from auction market theory—in an optimized, easy-to-read format that won't slow down your charts.
Why This Script is Protected
This script is published as closed-source to protect the proprietary volume distribution algorithm and the optimized Value Area calculation methodology from unauthorized republishing. The specific implementation of volume allocation across price rows, the buy/sell volume separation logic, and the efficient POC detection system represents original work that provides a unique lightweight alternative to standard volume profile implementations.
What Makes This Indicator Unique
Unlike heavy volume profile indicators that can slow down charts, Volume Profile Lite:
Uses an optimized algorithm designed for performance
Separates buying and selling volume for additional insight
Provides clean visual presentation without chart clutter
Includes extending reference lines for key levels
Features a dashboard with price position relative to POC
What This Indicator Does
Distributes volume across price rows to create a visual profile histogram
Identifies the Point of Control (highest volume price level)
Calculates Value Area (where specified percentage of volume traded)
Separates buying and selling volume for each price level
Extends key levels as reference lines on the chart
Highlights the POC row with a distinct border
Core Methodology
The indicator uses a proprietary approach to volume-at-price analysis:
Price Row Division — The lookback range is divided into configurable price rows (default: 24 rows)
Volume Distribution — Each bar's volume is allocated to the price rows it touches. If a bar spans multiple rows, volume is distributed proportionally.
Buy/Sell Separation — Volume is classified based on bar direction (close >= open = buying volume, close < open = selling volume)
POC Detection — The row with maximum accumulated volume is identified as the Point of Control
Value Area Calculation — Starting from POC, expands outward (alternating up and down) until target volume percentage is captured
Key Concepts Explained
Point of Control (POC) — The price level with the highest volume concentration. Often acts as a magnet for price and represents "fair value" for the analyzed period. Price tends to return to POC.
Value Area High (VAH) — Upper boundary of the value area zone. Acts as resistance when price is below, support when price is above.
Value Area Low (VAL) — Lower boundary of the value area zone. Acts as support when price is above, resistance when price is below.
Value Area — Price range containing specified percentage (default 70%) of total volume. This is where most trading activity occurred.
Visual Features
Volume Histogram — Horizontal bars showing volume at each price level
Buy/Sell Coloring — Green portions show buying volume, red shows selling volume
POC Highlight — The POC row has a distinct orange border and fill
POC Line — Horizontal line extending from POC (optional extension to right)
Value Area Lines — Dashed blue lines at VAH and VAL
Value Area Fill — Subtle blue fill between VAH and VAL
Color Scheme
Up Volume Color — Default: #26A69A (teal) — Buying volume
Down Volume Color — Default: #EF5350 (red) — Selling volume
POC Color — Default: #FF9800 (orange) — Point of Control
Value Area Color — Default: #2196F3 (blue) — VAH/VAL lines and fill
Dashboard Information
The on-chart table (bottom-right corner) displays:
POC price level
Value Area High price level
Value Area Low price level
Current price position relative to POC (ABOVE POC, BELOW POC, or AT POC)
Distance from current price to POC as percentage
Inputs Overview
Calculation Settings:
Lookback Period — Number of bars to analyze (default: 100, range: 20-500)
Number of Rows — Price level divisions for the profile (default: 24, range: 10-50)
Value Area % — Percentage of volume for value area calculation (default: 70%, range: 50-90%)
Visual Settings:
Up/Down Volume Colors — Customizable buy/sell colors
POC Color — Point of Control highlighting
Value Area Color — VAH/VAL line and fill color
Profile Width — Visual width of histogram in bars (default: 30, range: 10-100)
Show POC Line — Toggle POC horizontal line
Show Value Area — Toggle VAH/VAL lines and fill
Show Dashboard — Toggle the information table
Extend Lines — Project POC and VA lines further right
How to Use It
For Support/Resistance:
Use POC as a potential support/resistance reference point
Price often gravitates back to POC (mean reversion)
VAH acts as resistance when approaching from below
VAL acts as support when approaching from above
For Trend Analysis:
Price above POC suggests bullish control
Price below POC suggests bearish control
Breaking out of Value Area often leads to trending moves
Returning to Value Area suggests failed breakout
For Entry/Exit:
Enter longs near VAL with stops below
Enter shorts near VAH with stops above
Target POC for mean-reversion trades
Use POC as a trailing stop reference in trends
Alerts Available
VPL Cross Above POC — Price crosses above Point of Control
VPL Cross Below POC — Price crosses below Point of Control
VPL Cross Above VAH — Price breaks above Value Area High
VPL Cross Below VAL — Price breaks below Value Area Low
Best Practices
Use longer lookback periods for more significant levels
Increase row count for more precise level identification
POC from higher timeframes is more significant
Combine with other indicators for confirmation
This indicator is provided for educational purposes. It does not constitute financial advice. Past performance does not guarantee future results. Always conduct your own analysis and use proper risk management before making trading decisions.
— Made with passion by officialjackofalltrades

Price Action ICT SMC - Crypto Lidya (Lite)Price Action • ICT • SMC — Crypto Lidya (Lite)
Short title: PA Lite — Crypto Lidya
ONE CHART. ONE FLOW. TEXTBOOK PA + ICT + SMC.
This is not “more drawings”. It’s a structured, rule-based framework that merges:
Market Structure + Liquidity + Confirmation → into a single decision flow.
Core textbook sequence:
Liquidity → (IDM) → Displacement → CHoCH / BOS → Return to PD / OB / FVG / BPR
Built for traders who want clean context, multi-timeframe discipline, and professional-grade confluence
without turning the chart into a mess.
━━━━━━━━━━━━━━━━━━━━━━━━━━━━━━━━━━━━━━━━━━━
WHAT YOU GET (HIGHLIGHTS)
━━━━━━━━━━━━━━━━━━━━━━━━━━━━━━━━━━━━━━━━━━━
- Market Structure engine: CHoCH + BOS with configurable confirmation logic
- Liquidity context: EQH/EQL sweeps + deterministic “linking” to structure breaks
- HTF Bias (Regime Filter): optional direction gating for cleaner, textbook alignment
- TF Bias Table (Multi-TF dashboard): “at-a-glance” bias stacking with reasons
- PD Range (Premium/Discount): dealing-range alignment filter (OB / FVG or both)
- Displacement filter: impulse-quality confirmation (Body% / ATR / Close-position)
- Killzones / Sessions: time-window validation (London / NY AM / NY PM)
- FVG + BPR: imbalance mapping + balanced range overlap logic
- OB / BB engine: source models, refinement, quality filters, strength scoring, overlap pruning
- Alerts + Webhook-ready output: Human / JSON format, HTF gate, cooldown controls
“Structure + Liquidity + Confirmation in one workflow (no clutter).”
━━━━━━━━━━━━━━━━━━━━━━━━━━━━━━━━━━━━━━━━━━━
QUICK START (RECOMMENDED FLOW)
━━━━━━━━━━━━━━━━━━━━━━━━━━━━━━━━━━━━━━━━━━━
1) Performance
- Set Lookback Window (bars) to match your chart speed/history needs.
- View when “Lookback Window (bars)” is increased (with “Limit to Nearest” OFF / all zones visible).
- View when “Lookback Window (bars)” is decreased (with “Limit to Nearest” OFF / all zones visible).
2) Regime & Multi-TF Context (ICT)
- Enable HTF Bias if you want direction filtering.
- Use TF Bias Table to verify alignment across your chosen timeframes.
3) Timing Filter (Optional)
- Enable Killzones / Sessions to focus on high-liquidity delivery windows.
4) Confirmation Quality
- Enable Displacement filter to reduce range noise / weak breaks.
5) Structure Execution (SMC)
- Use CHoCH / BOS for the “break confirmation” layer.
- Use Buffers / Confirm Modes for stricter or faster validation.
6) Zones & Returns
- Use PD Range to validate where setups “should” form (Premium/Discount).
- Map FVG / BPR and OB / BB for return-to-zone models.
━━━━━━━━━━━━━━━━━━━━━━━━━━━━━━━━━━━━━━━━━━━
MODULES (TEXTBOOK EXPLANATION)
━━━━━━━━━━━━━━━━━━━━━━━━━━━━━━━━━━━━━━━━━━━
1) HTF BIAS (REGIME FILTER)
HTF Bias acts as your directional framework (macro context).
When enabled, signals can be suppressed if they conflict with the HTF direction.
Two professional ways to define bias (you choose via Trend Mode):
A) Swing Structure Bias (HH/HL – LH/LL) — “stable”
- Uptrend requires HH + HL confirmation
- Downtrend requires LL + LH confirmation
- Best when you want fewer, higher-quality flips
B) Legacy / Break of Extreme — “faster”
- Bias can flip as soon as a new pivot breaks the last major extreme
- Best for aggressive / fast markets (but can be noisier)
2) TF BIAS TABLE (MULTI-TIMEFRAME DASHBOARD)
The TF Bias Table is built for disciplined multi-timeframe execution:
- Answers “Are higher TFs aligned?” in seconds
- Helps you avoid taking LTF triggers against HTF context
- Can show reasoning text (optional) to keep the logic transparent
Bias calculation options (Table Bias Mode):
- Swing Structure Bias (HH/HL – LH/LL): more stable, flips later
- Structure-Scope Bias (msStructScope aligned): follows your chosen structure scope and flips faster
Hybrid rule is deterministic:
External dominates; if External is not ready, fallback to Internal.
Provisional Bias (UI only, optional):
- If pivots are not fully confirmed, the table can display a provisional bias based on HTF candle direction
- UI only (does not change signals)
3) PD RANGE (PREMIUM / DISCOUNT)
PD Range defines where price is “dealing” relative to its midpoint (50%):
- Bullish context → Discount is preferred
- Bearish context → Premium is preferred
You can apply PD filtering to:
- OB + FVG (default), OB only, or FVG only
Optional strict mode:
- Require the level/zone to remain fully inside the dealing range (more textbook)
“Discount buys / Premium sells with a clear dealing range reference.”
4) DISPLACEMENT (IMPULSE CONFIRMATION)
Displacement filter keeps breaks “honest”.
CHoCH/BOS confirms only if the break candle shows real intent:
- Body dominance (Body% rule)
- Volatility expansion (ATR multiple rule)
- Close position in break direction (optional strictness)
This is designed to reduce fake breaks in ranges and thin-liquidity periods.
“Impulse-quality break passes; weak range poke fails.”
5) KILLZONES / SESSIONS (TIME-WINDOW VALIDATION)
Session gating is a professional timing filter:
- Validate structure breaks/sweeps only inside enabled windows
- Focus execution during high-liquidity delivery hours (London / NY AM / NY PM)
“Cleaner signals when you trade only the active delivery windows.”
- Normal vs Killzone:
6) MARKET STRUCTURE (CHoCH / BOS)
CHoCH (Change of Character):
- Signals a character shift by breaking a key protected point (optionally)
BOS (Break of Structure):
- Confirms continuation breaks in the current structure direction
Confirmation controls:
- Close / Wick / Body / combined modes
- Optional buffers (Ticks or Percent) to reduce micro-noise
Optional Protected Swing Mode:
- Uses protected HL/LH as reference (closer to classic SMC)
7) LIQUIDITY (EQH/EQL SWEEPS + LINKING)
Liquidity sweeps identify stop-runs / grabs around equal highs/lows:
- Wick Only: faster tagging
- Wick + Close Back: more textbook (grab + rejection)
Link Window (bars) ties a sweep to the next CHoCH/BOS:
- Smaller window = stricter context
- Larger window = more permissive linking
8) FVG + BPR (IMBALANCE & REBALANCE)
FVG (Fair Value Gap):
- Shows active imbalances and mitigation behavior
- Optional size filter (Percent / ATR / Ticks / Absolute)
BPR (Balanced Price Range):
- Overlap zone formed by Bull FVG + Bear FVG
- Used as a confluence zone for rebalance and continuation models
9) OB / BB (ZONES)
Order Blocks (OB):
- Anchored to BOS/CHoCH breaks or derived from displacement candles (source mode)
- Refinement modes: Body / Wick / Mean Threshold
- Optional quality filter (Balanced / Strict, etc.)
- Strength scoring + confluence bonuses (FVG overlap, liquidity context)
- Overlap pruning keeps the chart clean and relevant
Breaker Blocks (BB):
- Derived from invalidated OBs
- Can show inherited strength % (optional)
- Cleanup options preserve performance without deleting open zones
10) ALERTS (REALTIME / WEBHOOK)
- Enable Alerts: master switch
- Choose Human or JSON message format
- Optional gates: HTF Bias alignment, cooldown (anti-spam)
TradingView setup tip:
Use alert condition = “Any alert() function call” for full detail messages.
━━━━━━━━━━━━━━━━━━━━━━━━━━━━━━━━━━━━━━━━━━━
LITE / COMMUNITY ROADMAP (IMPORTANT)
━━━━━━━━━━━━━━━━━━━━━━━━━━━━━━━━━━━━━━━━━━━
This is the free Lite / Community release.
To keep this project sustainable and continue improving it for the community:
- This Lite edition is planned to become limited to 3 symbols in a future update (e.g., BTC / ETH / SOL).
- The full, unrestricted version (all symbols + advanced upgrades) will be released separately as the PRO edition.
You’ll always see clear release notes before major changes.
━━━━━━━━━━━━━━━━━━━━━━━━━━━━━━━━━━━━━━━━━━━
DISCLAIMERS
━━━━━━━━━━━━━━━━━━━━━━━━━━━━━━━━━━━━━━━━━━━
- Educational / analytical tool only. Not financial advice.
- No guarantees. Always manage risk.
- “ICT / SMC” terminology is used as a category reference to commonly known concepts.
This script is not affiliated with any third-party educator or brand.

Adaptive Scaled LevelsThis indicator allows users to manually define a list of price levels (e.g., round or psychological numbers) and automatically scales them to fit any asset's current price range using an intelligent anchor point. It then plots dynamic horizontal zones ideal for identifying potential supply/demand or reaction areas.
How It Works (Technical Methodology)
Manual Price List Input
Users enter a comma-separated list of price levels via a text area input (default example: 50,100,...,1400). These act as a "template" grid – often round numbers, psychological levels, or custom targets.
Auto-Scaling Logic (Core Innovation)
When enabled:
Calculates the average of the input list.
Determines a smart anchor price:
Default (Lock = 0): Close price of the highest-volume bar in the last user-defined lookback period (default 200 bars), fetched from a selectable timeframe (default Daily) via request.security().
Override: User can manually lock the anchor to any fixed price.
Computes a scale factor = Anchor / List Average.
Multiplies every input level by this factor to adapt the entire grid to the current market (e.g., scales low-price templates to BTC's 60k+ range).
Zone Construction
For each scaled level:
Creates a horizontal box centered on the level.
Height = Level × user-defined percentage (default 0.5%) for volatility-adjusted thickness.
Zones extend infinitely to the right for continuous reference.
Supply/Demand Coloring
Levels above current close: Supply color (default light gray) – potential resistance/overhead supply.
Levels below current close: Demand color (default cyan) – potential support/underlying demand.
Visual Elements
Transparent filled boxes with borders.
Optional labels showing "S" (Supply) or "D" (Demand) plus exact price.
Clean, non-cluttering design – redraws only on last bar for performance.
How to Use
This tool is perfect for plotting adaptive psychological/round number grids across any asset without manual adjustment.
Common Template: Use evenly spaced round numbers (e.g., 100 increments) as input – the script handles scaling.
BTC/ETH/Crypto: Enable auto-scaling with Daily timeframe anchor for high-volume alignment (often near fair value).
Forex/Stocks: Lower zone height % for tighter zones; use shorter lookback or lock anchor for stability.
Trading Applications:
Anticipate reactions/bounces at scaled levels (confluence with price action, volume, or order blocks).
Supply zones (above price): Potential short entries or take-profit targets.
Demand zones (below price): Potential long entries or stop-loss placement below.
Override anchor for specific analysis (e.g., lock to all-time high).
Best Practices: Combine with trend direction, higher-timeframe structure, or liquidity concepts for higher-probability setups.
Highly versatile – works on any timeframe/asset, especially volatile ones like cryptocurrencies where fixed levels quickly become irrelevant.
Disclaimer
This indicator is a technical analysis tool and should be used in conjunction with other forms of analysis. Past performance does not guarantee future results. Always use proper risk management.

Option Price SR (csgnanam)## ⚖️ Disclaimer
This script is provided for **educational and analytical purposes only**.
It does not constitute financial advice.
Use proper risk management and trade responsibly.
---
## 📌 Indicator Concept & Trading Logic
This is a rule-based reference indicator designed to interpret **option price behavior** using **previous-day derived equilibrium levels**.
The indicator helps traders classify the market into **range-bound, breakout, or invalid trade zones** by observing how **ATM Call (CE) and Put (PE)** prices react around these levels.
All levels are **fixed for the trading day** and recalculated only on the next session.
---
## 📊 Core Levels Explained
The indicator plots the following **daily-anchored reference levels**:
* **PDH / PDL** – Previous Day High / Low of the option
* **PDC** – Previous Day Close
* **100% AVG (Breakout Zone)**
Average of previous-day CE and PE prices for the same strike
* **75% AVG (Midzone)**
Balance / decision zone
* **50% AVG (Support Zone)**
Lower acceptance / decay boundary
These levels act as **reaction zones**, not prediction lines.
---
## 🧠 Market Interpretation Logic
### 1️⃣ Range-Bound Market Condition
* When **both ATM CE and ATM PE** are **trading within the 100% AVG (Breakout) level**,
the market has a **high probability of remaining range-bound**.
* Premium expansion is limited on both sides.
* Ideal environment for **non-directional strategies**.
---
### 2️⃣ Breakout Validation
* A **true directional move** requires **asymmetry** between CE and PE.
* If **one side moves into breakout**, the **opposite side must stay suppressed**.
**Example:**
* If **CE breaks down below Midzone**,
then **PE must be above Breakout or at least above Midzone**.
* The same logic applies inversely for PE breakdowns.
This confirms **capital rotation**, not random premium decay.
---
### 3️⃣ Midzone (75%) – Reversal Watch Area
* The **Midzone** is a **high-probability reaction area**.
* Many intraday reversals initiate from this level.
* Price acceptance or rejection here defines:
* Continuation
* Mean reversion
* Failed breakout
This zone should be **closely monitored for structure and volume behavior**.
---
### 4️⃣ Support Zone (50%) – Trade Invalidation
* When an option price trades **below the Support (50%) level**:
* That option side becomes **non-tradable**
* Premium strength is lost
* Risk increases significantly
Trades **below support** are considered **low probability** and should be avoided.
---
## ⚠️ Important Usage Notes
* This indicator is **not a buy/sell signal generator**
* It is a **context and decision-filter tool**
* Best used in combination with:
* Price action
* Structure
* Spot/index behavior
* Time-of-day context
All levels are **session-anchored** and do **not repaint intraday**.
---
## 🎯 Intended Use Case
* Intraday option traders
* ATM / near-ATM focus
* Range vs directional market identification
* Premium behavior analysis
* Trade filtering and risk control
---

Inducement [Kodexius]Inducement is a market structure overlay indicator designed to help you contextualize liquidity driven pullbacks inside an established structural trend. Rather than treating every sweep or wick as equal, it frames “inducement” as a selective event that tends to appear after structure has shifted and price is engineering a retracement to attract late participants, clear nearby liquidity, and create fuel for continuation.
At a high level, the script separates price action into two layers:
External (macro) structure to define meaningful swing points and detect structural shifts (Break of Structure).
Internal (micro) structure to locate the more subtle swing levels that are commonly targeted during retracements.
Once a valid structural break establishes directional context, the indicator looks for a characteristic internal level raid that occurs without invalidating the broader structure (i.e., structure remains “protected”). When that raid is followed by evidence of intent/continuation (displacement style behavior), the event is marked as an inducement and plotted directly on the chart.
The result is a clean, rules based way to highlight high probability “pullback bait” zones helping you distinguish between random noise and a retracement that is more consistent with structured continuation behavior.
🔹 Features
🔸 Dual Layer Swing Engine (Internal vs External)
Internal and external swing detection work together to separate micro structure from macro structure. Internal swings capture nearer term pivot behavior, while external swings define the larger structural framework. Sensitivity can be tuned through swing length inputs, and historical depth can be managed to keep the chart clean and performance stable.
🔸 Break of Structure (BOS) Context Filter
BOS acts as a context gate that defines the active directional regime. Rather than generating signals in isolation, inducement evaluation is tied to structural context, enabling cleaner interpretation of “what matters now” versus what is simply historical noise.
🔸 Structure Protection (Invalidation Awareness)
A key differentiator is the emphasis on structure staying intact. Inducement candidates are only considered while the relevant macro framework remains protected. This helps filter out pullback like events that are actually part of a reversal or breakdown sequence, keeping attention aligned with continuation friendly conditions.
🔸 Inducement Detection With Optional Sweep Strictness
Inducements are derived from internal levels that form around post break retracement behavior levels that are commonly “targeted” during pullbacks. You can choose a stricter interpretation (e.g., close confirmation) for stronger validation, or a more permissive interpretation if you prefer to capture wick based raids while still requiring follow through behavior.
🔸 Intent / Displacement Confirmation (Volatility Aware)
To reduce false positives from shallow noise, the script incorporates a volatility aware confirmation layer. This helps ensure the marked event is not just a minor sweep, but is followed by behavior more consistent with directional commitment improving selectivity across different assets and market conditions.
🔸 Clean On Chart Visualization (BOS + IDM Levels)
The overlay is designed to be readable and practical: BOS levels are presented clearly, and inducements are marked with distinct level styling and labeling (bullish vs bearish). The visual output aims to support fast decision making without overwhelming the chart.
Bullish IDM:
Bearish IDM:
🔸 Chart Hygiene Controls (Limit Visible History)
You can limit how many historical inducements remain visible to prevent clutter especially helpful on lower timeframes or long sessions. This keeps focus on the most relevant, recent structural narrative.
🔸 Designed for Confluence Based Trading Workflows
This indicator is best used as a context + trigger assistant, not a standalone entry system. It integrates naturally with higher timeframe bias, session logic, supply/demand mapping, execution models, and risk planning providing structure aligned pullback references you can combine with your own confirmations.

Advanced Multi-Level S/R ZonesAdvanced Multi-Level S/R Zones: The Comprehensive Guide
1. Introduction: The Evolution of Support & Resistance:
Support and Resistance (S/R) is the backbone of technical analysis. However, traditional methods of drawing these levels are often plagued by subjectivity. Two traders looking at the same chart will often draw two different lines. Furthermore, standard indicators often treat every price point equally, ignoring the critical context of Volume and Time.
The Advanced Multi-Level S/R Zones script represents a paradigm shift. It moves away from subjective line drawing and toward Quantitative Zoning. By utilizing statistical measures of variability (Standard Deviation, MAD, IQR) combined with Volume-Weighting and Time-Decay algorithms, this tool identifies where price is mathematically most likely to react. It treats S/R not as thin lines, but as dynamic zones of probability.
2. Core Logic and Mathematical Foundation:
To understand how to use this tool optimally, one must understand the "engine" under the hood. The script operates on four distinct pillars of logic:
A. Session-Based Data Collection:
The script does not look at every single tick. Instead, it aggregates data into "Sessions" (daily bars by default logic). It extracts the High, Low, and Total Volume for every session within the user-defined lookback period. This filters out intraday noise and focuses on the macro structure of the market.
B. Adaptive Statistical Variability:
Most Bollinger Band-style indicators use Standard Deviation (StdDev) to measure width. However, StdDev is heavily influenced by outliers (extreme wicks). This script offers a sophisticated Adaptive Method-Skewness Detection: The script calculates the skewness of the price distribution. Adaptive Selection: If the data is highly skewed (lots of outliers, typical in Crypto), it switches to MAD (Median Absolute Deviation). MAD is robust and ignores outliers. If the data is moderately skewed, it uses IQR (Interquartile Range). If the data is normal (Gaussian), it uses StdDev.
Benefit: This ensures the zone widths are accurate regardless of whether you are trading a stable Forex pair or a volatile Altcoin.
C. The Weighting Engine (Volume + Time)
Not all price history is equal. This script assigns a "Weight Score" to every session based on two factors:
Volume Weighting: Sessions with massive volume (institutional activity) are given higher importance. A high formed on low volume is less significant than a high formed on peak volume.
Time Decay: Recent price action is more relevant than price action from 50 bars ago. The script applies a decay factor (default 0.85). This means a session from yesterday has 100% impact, while a session from 10 days ago has significantly less influence on the zone calculation.
D. Clustering Algorithm
Once the data is weighted, the script runs a clustering algorithm. It looks for price levels where multiple session Highs (for Resistance) or Lows (for Support) congregate.
It requires a minimum number of points to form a zone (User Input: minPoints).
It merges nearby levels based on the Cluster Separation Factor.
This results in "Primary," "Secondary," and "Tertiary" zones based on the strength and quantity of data points in that cluster.
3. Detailed Features and Inputs Breakdown:
Group 1: Main Settings
Lookback Sessions (Default: 10): Defines how far back the script looks for pivots. A higher number (e.g., 50) creates long-term structural zones. A lower number (e.g., 5) creates short-term scalping zones.
Variability Method (Adaptive): As described above, leave this on "Adaptive" for the best results across different assets.
Zone Width Multiplier (Default: 0.75): Controls the vertical thickness of the zones. Increase this to 1.0 or 1.5 for highly volatile assets to ensure you catch the wicks.
Minimum Points per Zone: The strictness filter. If set to 3, a price level must be hit 3 times within the lookback to generate a zone. Higher numbers = fewer, but stronger zones.
Group 2: Weighting
Volume-Weighted Zones: Crucial for identifying "Smart Money" levels. Keep this TRUE.
Time Decay: Ensures the zones update dynamically. If price moves away from a level for a long time, the zone will fade in significance.
ATR-Normalized Zone Width: This is a dynamic volatility filter. If TRUE, the zone width expands and contracts based on the Average True Range. This is vital for maintaining accuracy during market breakouts or crashes.
Group 3: Zone Strength & Scoring
The script calculates a "Score" (0-100%) for every zone based on:
-Point Count: More hits = higher score.
-Touches: How many times price wicked into the zone recently.
-Intact Status: Has the zone been broken?
-Weight: Volume/Time weight of the constituent points.
-Track Zone Touches: Looks back n bars to see how often price respected this level.
-Touch Threshold: The sensitivity for counting a "touch."
Group 4: Visuals & Display
Extend Bars: How far to the right the boxes are drawn.
Show Labels: Displays the Score, Tier (Primary/Secondary), and Status (Retesting).
Detect Pivot Zones (Overlap): This is a killer feature. It detects where a Support Zone overlaps with a Resistance Zone.
Significance: These are "Flip Zones" (Old Resistance becomes New Support). They are colored differently (Orange by default) and represent high-probability entry areas.
Group 5: Signals & Alerts
Entry Signals: Plots Buy/Sell labels when price rejects a zone.
Detect Break & Retest: specifically looks for the "Break -> Pullback -> Bounce" pattern, labeled as "RETEST BUY/SELL".
Proximity Alert: Triggers when price gets within x% of a zone.
4. Understanding the Visuals (Interpreting the Chart)
When you load the script, you will see several visual elements. Here is how to read them:
The Boxes (Zones)
Red Shades: Resistance Zones.
Dark Red (Solid Border): Primary Resistance. The strongest wall.
Lighter Red (Dashed Border): Secondary/Tertiary. Weaker, but still relevant.
Green Shades: Support Zones.
Dark Green (Solid Border): Primary Support. The strongest floor.
Orange Boxes: Pivot Zones. These are areas where price has historically reacted as both support and resistance. These are the "Line in the Sand" for trend direction.
The Labels & Emojis
The script assigns emojis to zone strength:
🔥 (Fire): Score > 80%. A massive level. Expect a strong reaction.
⭐ (Star): Score > 60%. A solid structural level.
✓ (Check): Score > 40%. A standard level.
"⟳ RETESTING": Appears when a zone was broken, and price is currently pulling back to test it from the other side.
The Dashboard (Top Right)
A statistics table provides a "Head-Up Display" for the asset:
High/Low σ (Sigma): The variability of the highs and lows. If High σ is much larger than Low σ, it implies the tops are erratic (wicks) while bottoms are clean (flat).
Method: Shows which statistical method the Adaptive engine selected (e.g., "MAD (auto)").
ATR: Current volatility value used for normalization.
5. Strategies for Optimum Output
To get the most out of this script, you should not just blindly follow the lines. Use these specific strategies:
Strategy A: The "Zone Fade" (Range Trading)
This works best in sideways markets.
Identify a Primary Support (Green) and Primary Resistance (Red).
Wait for price to enter the zone.
Look for the "SUPPORT BOUNCE" or "RESISTANCE REJECTION" signal label.
Entry: Enter against the zone (Buy at support, Sell at resistance).
Stop Loss: Place just outside the zone width. Because the zones are calculated using volatility stats, a break of the zone usually means the trade is invalid.
Strategy B: The "Pivot Flip" (Trend Following)
This is the highest probability setup in trending markets.
Look for an Orange Pivot Zone.
Wait for price to break through a Resistance Zone cleanly.
Wait for the price to return to that zone (which may now turn Orange or act as Support).
Look for the "RETEST BUY" label.
Logic: Old resistance becoming new support is a classic sign of trend continuation. The script automates the detection of this exact geometric phenomenon.
Strategy C: The Volatility Squeeze
Look at the Dashboard. Compare High σ and Low σ.
If the values are dropping rapidly or becoming very small, the zones will contract (become narrow).
Narrow zones indicate a "Squeeze" or compression in price.
Prepare for a violent breakout. Do not fade (trade against) narrow zones; look to trade the breakout.
6. Optimization & Customization Guide
Different markets require different settings. Here is how to tune the script:
For Crypto & Volatile Stocks (Tesla, Nvidia)
Method: Set to Adaptive (Mandatory, as these assets have "Fat Tails").
Multiplier: Increase to 1.0 - 1.25. Crypto wicks are deep; you need wider zones to avoid getting stopped out prematurely.
Lookback: 20-30 sessions. Crypto has a long memory; short lookbacks generate too much noise.
For Forex (EURUSD, GBPJPY)
Method: You can force StdDev or IQR. Forex is more mean-reverting and Gaussian.
Multiplier: Decrease to 0.5 - 0.75. Forex levels are often very precise to the pip.
Volume Weighting: You may turn this OFF for Forex if your broker's volume data is unreliable (since Forex has no centralized volume), though tick volume often works fine.
For Scalping (1m - 15m Timeframes)
Lookback: Decrease to 5-10. You only care about the immediate session history.
Decay Factor: Decrease to 0.5. You want the script to forget about yesterday's price action very quickly.
Touch Lookback: Decrease to 20 bars.
For Swing Trading (4H - Daily Timeframes)
Lookback: Increase to 50.
Decay Factor: Increase to 0.95. Structural levels from weeks ago are still highly relevant.
Min Points: Increase to 3 or 4. Only show levels that have been tested multiple times.
7. Advantages Over Standard Tools:
Feature Standard S/R Indicator, Advanced Multi-Level S/R Calculation, Uses simple Pivots or Fractals, Uses Statistical Distributions (MAD/IQR). Zone Width Arbitrary or Fixed Adaptive based on Volatility & ATR.
Context Ignores Volume Volume Weighted (Smart Money tracking).
Time Relevance Old levels = New levels Time Decay (Recency bias applied).
Overlaps Usually ignores overlaps Detects Pivot Zones (Res/Sup Flip).
Scoring None 0-100% Strength Score per zone.
8. Conclusion:
The Advanced Multi-Level S/R Zones script is not just a drawing tool; it is a statistical analysis engine. By accounting for the skewness of data, the volume behind the moves, and the decay of time, it provides a strictly objective roadmap of the market structure.
For the optimum output, combine the Pivot Zone identification with the Retest Signals. This aligns you with the underlying flow of order blocks and prevents trading against the statistical probabilities of the market.

Impulsive Trend Detector [dtAlgo]This advanced Pine Script indicator identifies and tracks impulsive price movements based on Break of Structure (BOS) and Change of Character (CHoCH) concepts from Smart Money trading methodology.
The indicator automatically detects pivot highs and lows, then monitors when price breaks these key levels to signal potential impulsive moves. BOS indicates continuation in the current trend direction, while CHoCH signals potential trend reversals. Each detected move is measured from the break point to the next opposing pivot, providing accurate percentage calculations that match TradingView's measuring tool.
Impulsive moves are categorized into four levels based on magnitude (Level 1: 5-10%, Level 2: 10-15%, Level 3: 15-20%, Level 4: 20%+), with color-coded visual labels and connecting lines displayed directly on the chart.
Comprehensive Session Analysis:
Track moves across 11 distinct trading sessions in Eastern Time: Pre-London/NY, London/NY overlap, NY (with Power Hour and End subdivisions), Sydney, Asia, Sake Time, Asia/London overlap, London, Weekend, and No Session periods.
Three Dynamic Tables provide:
Real-time statistics (bullish/bearish, BOS/CHoCH, levels)
Session breakdown with move counts and average percentages
Event log showing last 10 moves with date, day, session, direction, type, level, percentage, duration, and bar count
Perfect for Smart Money traders seeking data-driven insights into market structure behavior across global trading sessions.

Volume-Weighted Fibonacci PivotThis indicator automatically plots dynamic Fibonacci retracement and extension levels based on a volume-weighted pivot point within a user-defined lookback period or date range. It intelligently calculates a central "pivot" price biased toward high-volume bars, then draws symmetric levels both upward (extensions) and downward (retracements) for balanced confluence analysis.
How It Works (Technical Methodology)
Lookback Period Determination
Multiple filter modes control the data range used for calculations:
"Last X Bars": Fixed number of recent bars (default 400, max 4999).
"Manual Date": User-specified start date.
"Interactive (Chart)": Confirmed start date via input.
"None": Full available history (falls back to max bars).
Optionally, when using "Last X Bars", calculations can pull data from a higher/lower user-selected timeframe via request.security() for multi-timeframe alignment.
A dotted vertical line marks the start point in date-based modes.
Range and Pivot Calculation
Within the selected period:
Highest high and lowest low define the full price range.
Average volume is computed across the period.
Volume-Weighted Pivot: Average close price only from bars where volume > average volume (fallback to simple midpoint if no high-volume bars).
This creates a "smart" central pivot that leans toward areas of greater participation, often aligning with institutional activity.
Fibonacci Level Generation
User-configurable ratios (default: 0.236, 0.382, 0.5, 0.618, 0.786, 1.0, 1.272, 1.414, 1.618).
Levels are calculated symmetrically around the volume-weighted pivot:
Upward: Pivot + (Range × Ratio × Correction Factor) – teal/cyan shades.
Downward: Pivot - (Range × Ratio × Correction Factor) – red shades.
Correction Factor (default 0.5): Scales level spacing for tighter/wider grids without altering ratios.
Only the user-defined number of active lines (default 9) are drawn.
Visual Construction
Central Pivot Line: Thick yellow horizontal line with label showing exact price.
Up/Down Levels: Dashed lines extended into the future, labeled with ratio direction ("Up" or "Dn").
All objects redraw only on the last bar for performance, clearing previous drawings.
Multi-Timeframe Option
When enabled with "Last X Bars":
Pulls high/low/volume data from specified timeframe.
Aligns the pivot and levels to higher-timeframe structure while displaying on current chart – ideal for intraday traders seeking HTF confluence.
How to Use
This tool provides clean, volume-aware Fibonacci grids for identifying potential support/resistance, reversal zones, and targets.
Volume-Weighted Pivot: Often acts as a strong mean reversion level or fair value area.
Upward Levels (Teal): Potential resistance/extensions in bullish moves; watch for reactions on retests.
Downward Levels (Red): Potential support/retracements in bearish moves.
Confluence: High probability when price reacts at levels aligning with other tools (order blocks, pivots, volume profile).
Correction Factor: Lower values (<0.5) for tighter grids in ranging markets; higher (>0.5) for trending markets.
Multi-Timeframe Mode: Use on lower charts (e.g., 15m) with HTF input (e.g., 4H or Daily) to project major structure levels.
Common Setups:
Pullbacks to 0.618–0.786 zones for continuation entries.
Breaks beyond 1.0–1.618 for extension targets.
Reactions near pivot line for mean reversion trades.
Adjust ratios and active line count to match your preferred Fibonacci style (classic retracement vs. extensions).
Disclaimer
This indicator is a technical analysis tool and should be used in conjunction with other forms of analysis. Past performance does not guarantee future results. Always use proper risk management.

ETF-Futures Opening Ratio (Table)This indicator calculates the opening price ratio between an ETF and its corresponding futures contract using the 9:30 AM New York (RTH) opening price.
The ratio is locked at the official market open and remains fixed throughout the session, providing a stable reference for:
Translating ETF price levels into futures equivalents
Comparing relative value and premium/discount behavior
Maintaining consistent cross-instrument analysis during the trading day
The output is displayed in a simple on-chart table for quick reference and minimal chart clutter.

C2 HTF Detection CRT [MarioLeb]What This Indicator Does:
1. Detects "C2 Sweeps" - Price retesting previous highs/lows then closing back inside the range.
2. Shows HTF Structure - Marks High Timeframe support/resistance zones (C1 ranges).
3. Finds Multi-Timeframe Confluence - When HTF and LTF C2 signals align at same levels.
4. Highlights CRT Cycles - Complete market cycles (C1→C2→C3 pattern).
Visual Output:
Horizontal lines = C2 sweep levels
Colored zones = C1 ranges (key areas)
Yellow line = 50% level of C1 range
Boxes = CRT cycles (if enabled)
CISD lines = Change in supply/demand confirmation
Purpose:
Identify where higher timeframe structure meets lower timeframe precision - shows where big moves often start.
Alert Features:
Automated Alerts trigger when:
HTF C2 Detected - "Bullish/Bearish HTF C2 Detected on "
CRT Cycle Complete - "Bullish/Bearish CRT Cycle Detected on "
CISD Confirmed - "HTF CISD Confirmed on "
LTF C2 Detected - "Bullish/Bearish LTF C2 vs HTF C1 Detected"
Key Alert:
Once C2 candle closes inside C1 range after sweeping high/low → Alert fires immediately.
Each alert includes:
Direction (Bullish/Bearish)
Timeframe
Mode (Strict/Easy)
Pattern type (C2/CRT/CISD)
Alert frequency: Once per bar (no spam).

SMC Execution Engine by @abdallacryptoSMC Execution Engine by @abdallacrypto is a Smart Money Concepts structure and execution toolkit that turns price action into a clear, rules-based map.
It automatically detects swing structure, BOS and CHOCH, tracks the active structural anchor, and projects clean Fibonacci retracement levels built from the current context. It also draws the latest context Order Block and adds optional intrabar alerts for high-probability confluence events (OB touches, 0.79 and 0.618 fib interactions, OB plus fib, and sequential “fib then OB” logic). A multi-timeframe HUD (5m to 1M) shows structural bias and RSI so you can align execution with higher-timeframe context.
This is not a buy/sell signal generator. It is a structure reader and execution framework designed to reduce noise, improve consistency, and help you act with clarity.
Suggested use: identify context with CHOCH and anchor, wait for price to return to key fib levels and the active Order Block, then execute your own risk plan.
Full documentation:
🇺🇸 beneficial-hyena-c1e.notion.site
🇧🇷 beneficial-hyena-c1e.notion.site
🇪🇸 beneficial-hyena-c1e.notion.site


Range EncapsulatorWhen a user selects a start date and the desired duration, the specified date range will be highlighted. High and low data lines corresponding to this range will be drawn. Additionally, quarter-point interval lines from the previous data range will be displayed between the high and low lines of the current range, provided they fall within those boundaries.

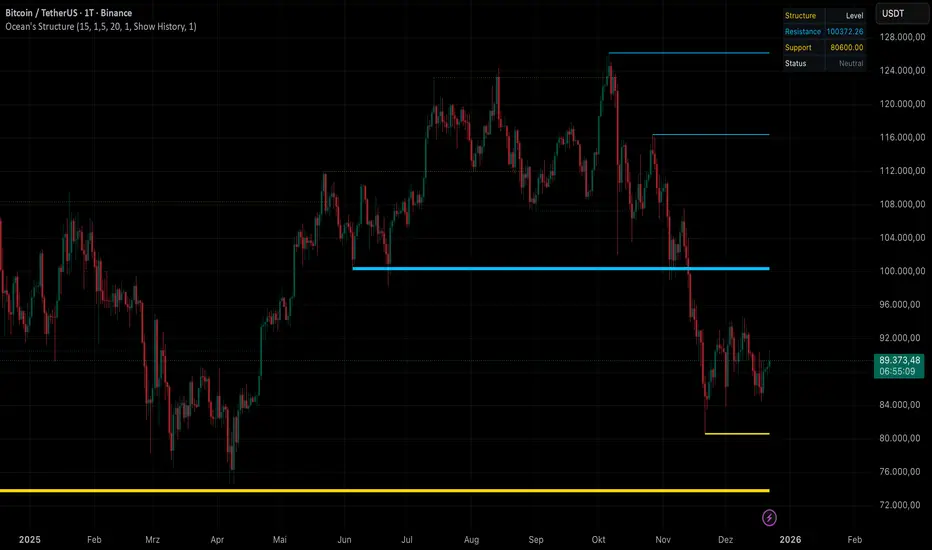
Ocean's Smart Structure [Pro]Ocean's Smart Structure – Professional Market Architecture
Stop guessing where the liquidity is.
Ocean's Smart Structure is a next-generation technical analysis suite designed for precision traders. Unlike standard pivot indicators that clutter your chart with noise, it uses a Volatility-Adaptive Clustering Algorithm to merge, filter, and validate the levels that actually matter.
It doesn't just draw lines; it understands market behavior. It detects when support flips to resistance, identifies liquidity grabs (fakeouts), and visually indicates the strength of every zone.
🌊 Key Features
1. Volatility-Adaptive Clustering
Markets expand and contract. Standard indicators fail because they use static values. It calculates the Average True Range (ATR) in real-time to determine the effective width of a zone.
Result: Nearby pivots are intelligently merged into single, robust "Structural Clusters."
2. Advanced Role Reversal (Flip Logic)
Price rarely respects a level once. When a strong Support breaks, it often becomes Resistance.
The Logic: The indicator automatically flips lines from Support (Gold) to Resistance (Blue) upon a confirmed break, keeping the history of that price level alive on your chart.
3. Institutional Fakeout Protection
The unique selling point of this tool. Algorithms often push price past a level to trigger stop-losses before reversing.
Standard Indicators: Delete the level immediately upon a break.
This Tool: Enters a "Pending Break" state. If the next candle reclaims the level, the line is preserved and strengthened, marking it as a Liquidity Grab rather than a breakout.
4. Dynamic Strength Visualization
Not all levels are equal.
Visual Feedback: As a level is tested more times without breaking, the line automatically becomes thicker. This allows you to instantly identify "Concrete Walls" vs. "Glass Windows" at a glance.
5. Real-Time HUD (Heads-Up Display)
A clean, non-intrusive dashboard sits on your chart, providing instant context:
Nearest Resistance & Support: Exact price ticks.
Live Status: Tells you if price is "Ranging," "At Support," or "At Resistance" based on volatility proximity.
⚙️ Settings & Customization
Pivot Period: Adjust sensitivity to swing highs/lows.
Cluster Sensitivity: Controls how aggressive the merging algorithm is.
Role Reversal Limit: Limit how many times a level can flip (preventing infinite ping-pong lines).
Invalidation Action: Choose to delete broken lines or keep them as "Ghost Levels" (dotted history).
Visuals: Fully customizable branding colors (Default: Gold & Neon Blue).
NQ Geometric Trading System NQ Geometric Trading System
Advanced confluence indicator for NQ futures implementing Michael S. Jenkins' geometric methodology.
Core Features:
Automatic spike detection (9:30-9:35) captures institutional footprint
Geometric levels from opening range using Jenkins ratios (R_50, R_25, R_67, extensions)
Rising zero angles provide dynamic time+price support/resistance
Fibonacci time windows highlight natural reversal periods
Weighted confluence algorithm (spike levels = 2x, others = 1x)
Real-time dashboard displays score 0-10 and signal strength
Customizable alerts for high-probability setups
How It Works:
System automatically detects opening spike extremes, calculates geometric ratios from 9:30-10:00 range, projects zero angles rising at 0.75 points/minute, and highlights Fibonacci time windows. When multiple factors align, dashboard shows confluence score with color-coded signals (Strong 5+, Trade 4, Watch 3).
Optimized For:
NQ/MNQ scalping and day trading on 1-5 minute timeframes. Works best during regular trading hours with timezone set to Exchange.
Customizable:
15+ parameters including angle rate, confluence threshold, price tolerance, time windows, and visual settings. Default optimized for NQ but adaptable.
Requirements:
Chart timezone must be "Exchange" or "America/New_York" for proper spike/range detection.
Perfect for traders seeking mechanical, objective signals based on proven geometric principles.

Pivot Levels [BigBeluga]🔵 OVERVIEW
The Pivot Levels indicator automatically detects and draws key market pivot levels across multiple sensitivity settings. Each pivot level represents a significant local high or low in price structure, acting as potential zones of support and resistance. Traders can visualize short-, medium-, and long-term pivot layers simultaneously, helping to identify where price may react, reverse, or break out.
🔵 CONCEPTS
Different pivot lengths provide multi-length sensitivity on the same timeframe — shorter lengths detect local micro-swings, while longer lengths capture broader swing structure within the current chart.
ATR-based color logic marks active, bullish, or bearish pivot zones dynamically.
Lines can extend to the right or both sides to track reactions over time.
🔵 FEATURES
Detects up to four custom pivot levels simultaneously.
Each pivot level has independent settings for length , style , and extension mode .
Auto-colors each pivot as support (green), resistance (orange), or active zone (blue).
Displays dual-width line layers: a solid base and a transparent overlay for visual depth.
Dynamic price labels show exact pivot levels for clarity.
Fully customizable line styles: dashed (--), solid (-), or dotted (..).
Extends lines to the right for future reaction tracking or both directions for structure alignment.
🔵 HOW TO USE
Enable or disable pivot levels (1–4) to control how many layers of structure you want visible.
Use shorter pivot lengths for intraday turning points and longer ones for macro structure.
Watch for multiple pivot lines clustering in the same region — these often mark strong reversal zones.
Observe color changes: green = support, orange = resistance, blue = active neutral zone.
Combine with price action or volume analysis to confirm reactions near major pivots.
🔵 CONCLUSION
The Pivot Levels indicator provides a clean, multi-layered visualization of market structure.
By tracking pivots of varying lengths, traders can easily identify overlapping support and resistance regions, gauge breakout strength, and align trades with the dominant structural zones visible across multiple time horizons.

ORACLE v13: The Gamified Market HUDORACLE v13 is not just an indicator; it is a complete Trading HUD (Heads-Up Display) that translates complex market data into an intuitive, video-game-style interface. It turns abstract concepts like "volatility" and "support/resistance" into actionable game mechanics, allowing you to react faster and trade smarter.
⚔️ Key Features:
🛡️ Boss & Shield Mechanics (Support/Resistance):
Automatic detection of key levels visualized as "Bosses" (Resistance) and "Shields" (Support).
HP System: Watch price "damage" these levels in real-time. When "Boss HP" hits zero, a breakout is imminent.
🔮 The Bestiary (Market Conditions):
Instantly identifies the "Enemy Type" you are fighting:
🟢 SLIME: Squeeze zone (low volatility, prepare for a move).
👺 GOBLIN: Chop/Noise (high risk, avoid trading).
🐉 DRAGON: Strong Trend (ride the momentum).
👹 BERSERKER: Extreme Volatility (proceed with caution).
📈 Live Structure Mapping:
Real-time ZigZag overlays with automatic HH/LL/LH/HL labels.
Breakout Flash: Candles flash WHITE instantly when major structure or Boss levels are broken.
🎮 Combat Stats:
Combo Counter: Tracks consecutive directional candles.
Aggro Meter: Visualizes volume intensity.
Loot Drop Rate: innovative metric calculating the probability of a profitable move based on current ATR.
Momentum Bar: RPG-style health bar for trend strength.
Why use ORACLE? Most indicators just draw lines. ORACLE gives you Context. It tells you exactly what kind of market environment you are in so you never bring a knife to a Dragon fight. Perfect for scalpers and day traders who need instant situational awareness.
Settings: Fully customizable Lookback periods, ZigZag sensitivity, and Visual Themes.

ODR BoxThis indicator automates the Opening Range Definition (ODR) based on the Ali Khan / ICT Model 1 framework. By capturing the 07:00-09:25 AM Dealing Range, it projects institutional quadrants and standard deviation targets. It is designed to filter out 'retail noise' and highlight the mathematical levels where price delivery is most likely to accelerate or reverse.

Previous Days Settlement Price📌 Indicator Description — Previous Days Settlement Prices
Previous Days Settlement Prices is a clean, efficient Pine Script v6 indicator designed for intraday futures and high-precision price reference. It automatically tracks and displays the settlement prices from the previous trading days — anchored to the exact bar where each settlement occurred — and plots each as a horizontal level extending into the current session with customizable visual styles and labels.
⚙️ Core Purpose
Settlement prices represent the officially determined price at which futures contracts settle each trading day — a level often watched by professional traders for support, resistance, acceptance, or rejection behavior. Unlike standard previous-close or high/low indicators, this script uses anchored historical data tracking to accurately record where each settlement happened and visually maintain that reference throughout the subsequent intraday session.
🧠 Original Approach
Rather than relying on request.security lookups alone, this script uses bar-based tracking and array storage to maintain precise settlement values (close price of the last bar of each session). This method ensures:
Accurate anchoring to the actual bar index where the settlement completed, not just price aggregation.
Clean, customizable rendering with dashed/dotted/solid lines and dynamic labels.
Scales elegantly across multiple days without chart clutter.
📊 What It Displays
Up to N previous days’ settlement price levels (configurable, 1–9).
Levels are drawn as horizontal lines from the original settlement bar to the current bar.
Labels with formatted price values display at the rightmost edge of the chart.
Colors, line style (solid/dashed/dotted), line width, and label size are all user-configurable.
🎯 Designed For
Intraday futures traders who rely on settlement levels as reference points.
Traders who want precise anchoring of historical settlement levels for context, not simple static prior-day closes.
Those who prefer a light UI footprint with clear, extendable horizontal levels and reading labels.
📌 Key Indicator Configurations
Number of Days to Show – Choose how many previous settlement levels to display.
Line Style & Width – Customize visual clarity across timeframes.
Label Appearance – Choose color and size for easy identification.
📖 Important Notes for Use
This indicator is optimized for intraday timeframes where settlement references matter most.
Levels are anchored to their actual session close bar, offering a more precise historical reference than simple session closes.
Adjust your chart settings (session times) to match the market you’re trading for best alignment.

BulletProof Long Wick Reversal Markers with LinesThis custom Pine Script indicator for TradingView identifies and marks potential reversal points on your chart based on long wick candles at swing highs (tops) and lows (bottoms). It focuses on candles where the wick is significantly longer than the body (e.g., shooting stars or hammers) and where the subsequent price reversal exceeds a minimum percentage move. Markers appear as colored circles (green for tops, red for bottoms), with horizontal lines extending from each marker to the current bar for easy reference as support/resistance levels.Key Features and InterpretationMarkers (Dots): Green circles at tops: Indicate a potential bearish reversal where price was pushed down after a long upper wick candle.
Red circles at bottoms: Indicate a potential bullish reversal where price was pushed up after a long lower wick candle.
These only appear if the wick-to-body ratio meets the threshold (default 2.0) and the reversal move is at least the minimum percentage (default 1%).
Lines: Horizontal lines extend from each marker to the current bar (updating in real-time). Use these as dynamic levels—e.g., a green top line might act as resistance, while a red bottom line could be support. Lines do not extend into the future blank space on the chart.
Time Filtering: By default, only markers from the last 7 days are shown to reduce clutter. Set to 0 to display all historical ones.
Best Used On: 1-hour charts as per your request, but it works on any timeframe. It's ideal for spotting reversals in trending markets or confirming entries/exits with other indicators.

Highs & LowsIntroduction: This indicator marks highs and lows from the previous New York, Asian, and London sessions, including the daily high and low. It is made to be as user friendly/adjustable as possible.
It was designed around trading during the New York morning session, using the 1 hour and 1 minute(or similar) timeframes in conjunction.
Settings: Common settings for the cleanest viewing are as follows:
1 Hour Chart Settings:
Box #3 "Label Vertical Offset" to "18".
Box #4 "Label X Offset" to "2".
1 Minute Chart Settings:
Box #3 "Label Vertical Offset" to "2".
Box #4 "Label X Offset" to "0".
Note: Adjusting text to the darkest "black" setting may provide the best contrast.
