RSI Correlation with future priceThis script measures the correlation of the hourly RSI of 24 hours ago with the difference of price between now and the price 24 hours ago. In other words, this is an indicator which measures the predictive power of the RSI.
Green means that the price is strongly correlated with the past RSI (which is the normal state when the market is flat and there is no news).
Red means that the price is inversely correlated with the past RSI.
The hourly RSI is a leading indicator which enables you to (sort of) see into the future. It shows you how the current price is, compared to the price 24 (or 48) hours into the future.
If the RSI is low, it means the current price is low compared to the future price, and if the RSI is high, it means the current price is high compared to the future price.
So the hourly RSI really correlates (in the way I described) to the price 24 hours in the future.
Except when it doesn't!!!
What happens when the correlation breaks (RED on this indicator)? Usually there are important news - a strong signal external to the chart. There are either economy at large news, or security-specific news.
Following a strong break of this RSI-future price correlation, some cash can be made by understanding what happened and playing the restoration of the RSI-price correlation.
Prediction

Hull MA & Warning Zones & Buy/Sell ArrowsThis moving average, in contrast to the standard, shows a slowdown of the current trend - it draws additional zones of yellow color. These zones show a possible trend reversal by 1-2 bars earlier than the standard Hull moving average. Additionally, there are arrows to enter a position and the second is the same MA for another timeframe, which can be selected in the settings.

Bull Bear Divergence IndicatorThe script is written for Constance Brown-like anayis with divergence signals between price and indicator (i.e. stock close / RSI divergence)
Note: Though the example here with NVDA shows good reversal predictions, best results generally are optained with un-normalized indicators and oscilators like CB#s comosite index.
(For Trading view written by LazyBear.) I use two different lines: an indi high line for baerish, and an indi low line for bullish divergences.
The script only shows divergences to pivot pairs next to each other, not between actual pivot and those "a few pivots ago"
For individual work, chose your indicator and replace rsi in line 10 with it, anything else is auto. Sript bottom: optional comparison lines addable.

Linear ExtrapolationBasic extrapolator for forecast a time-series, all forecasts are mades length periods ahead.
This is not a estimation of the exact price
This should only be used for forecasting direction, dont expect the price to be at the same value of its forecast.
Bias, Mean absolute error, Mean percentage error...etc look useless here, its better to use correlation as a accuracy measurement.
Correlation(Forecast ,close,period)
Rescaling for a better forecast ?
Transforming a non-stationary signal to a stationary signal can increase the forecasting accuracy, this can be done by detrending. Here is a list of somes detrending methods:
Auto-Bias : price - price
Mean-Bias : price - price moving average
Log transform : log(price/price moving average)
Correlation : correlation(price,n,period)

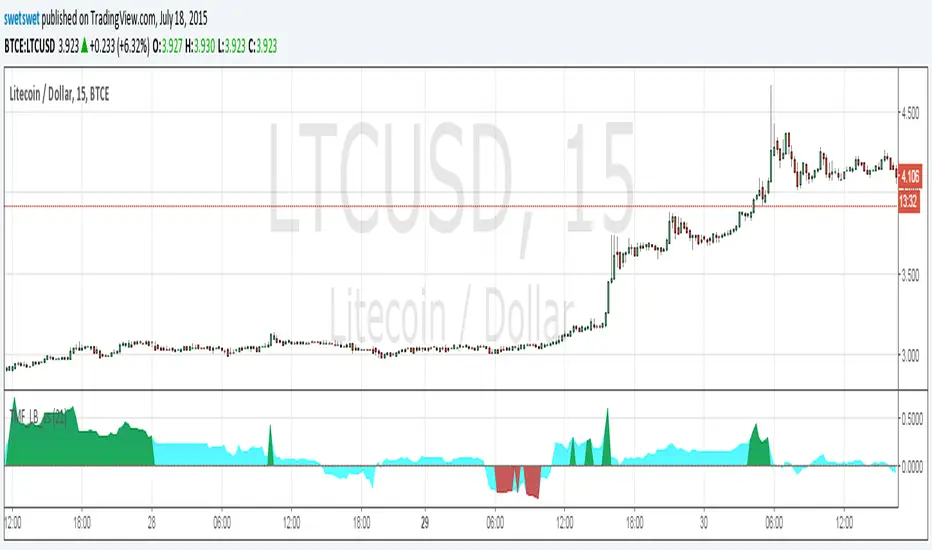
Twiggs Money Flow_LB [SwetSwet]The modified indicator Twiggs Money Flow more convenient. The critical value is colored in green or red.