PVT RSIPrice Volume Trend based RSI with SMA smoothing. I personally prefer smoothed RSI's to get rid of noise.
Price Volume Trend (PVT)

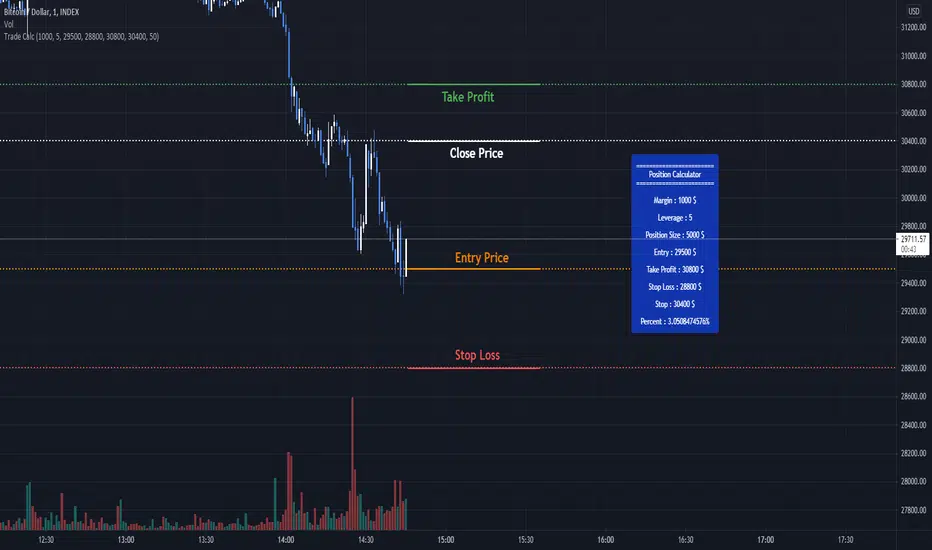
Trade Calculator by RealmixA clean Trade Calculator for any Asset, which calculates everything you need to know.
This script is a modified version of the Position Calculator by Mysteriown. Link:
I try to make it a bit better for Futures Trading.
MAIQ Volume Trend IndicatorUses Volume and current outstanding shares float to calculate a ratio to determine if a price trend is occuring.
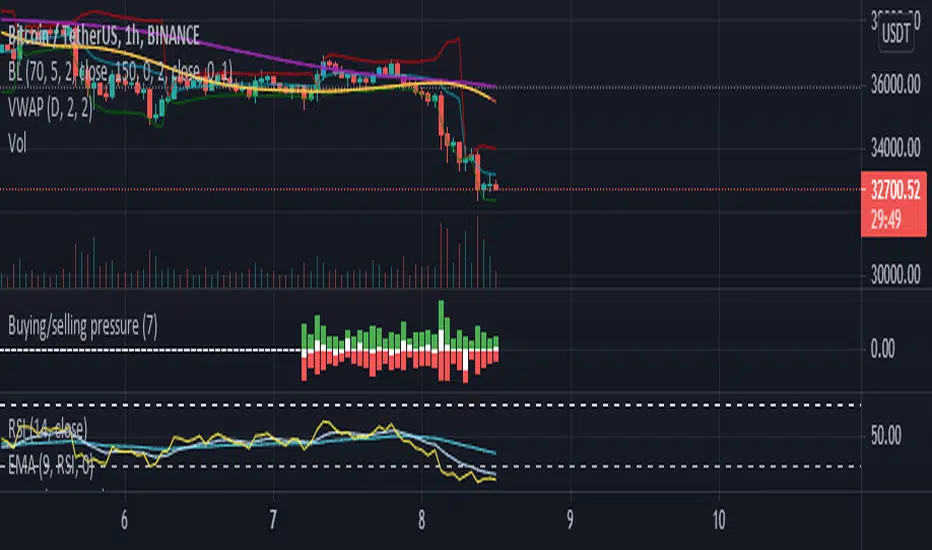
Buying/selling pressureBuying/selling pressure
Green bar for buying pressure, calculated by multiply Volume change and the increasing of price
Red bar for selling pressure, calculated by multiply Volume change and the decreasing of price
White bar is the subtract of Green bar and Red bar, which is calculated how strong of buying or selling in the market at the current timeframe.
The heigh of the Bars (green+red) is related to Moving average of Volume (100 points is equal to 100% of current Volume MA) , can set custom period in Setting.
Price/Volume Trend MeterAnother simple indicator from the sweet indicator series, This is a combination of the Volume and Price Trend Meter indicators combined (Links below) into one indicator called PVTM (Price Volume Trend Meter).
PVTM measures the strength of price and volume pressure on a histogram.
The indicator sums up all green candles price and volume and red candles price and volume over a specific period of bars and plots based on Price summed value. The result will look similar to Price Trend Meter with the benefit of trying to filter out more noise.
Use this indicator to identify the increasing asset of price and volume with the green candles (Close is higher than open) and decreasing of price and volume with the red candles (Close is lower than open).
======= Calculation ==========
Bright Green Color Column: Total summed up Price and Volume are higher than 0.
Bright Red Color Column: Total summed up Price and Volume are Lower than 0.
Weak Green Color Column: Conflict between Price and Volume (One positive and one negative) so we continue based on previous color .
Weak Red Color Column: Conflict between Price and Volume (One positive and one negative) so we continue based on previous color.
======= Price/Volume Trend Meter Colors =======
Green: Increasing buying pressure.
Weaker Green: Declining Buying pressure (Possible Sell Reversal).
Red: Increasing selling pressure.
Weaker Red: Declining Selling pressure (Possible Buy Reversal).
Other sweet indicators that this indicator is based on:
Volume Trend Meter:
Price Trend Meter:
Like if you Like and Follow me for upcoming indicators/strategies: www.tradingview.com

NSE BankNifty Spot Volume - by GrowMore IndicatorsNSE BankNifty Spot Volume - by GrowMore Indicators !!
HOW Does it work ?
Trading volume is a measure of how much of a given financial asset has traded in a period of time. For stocks, volume is measured in the number of shares traded and, for futures and options, it is based on how many contracts have changed hands. The numbers, and other indicators that use volume data, are often provided with online charts.
The Spot Volume of NSE Bank-Nifty is hard to calculate, but TradingView Pine made it easier to calculate the actual spot volume of Bank-Nifty.
As Bank-Nifty users are aware that the Bank-Nifty comprises of 12 banks and each bank has its own weightage in Bank-Nifty movement.
The Indicator has 12 inputs of banks that are in NSE Bank-Nifty and next beside there is weightage input for that particular bank,
now this weightage is modified by NSE every month so it should be changed every month. The link to it is - www1.nseindia.com
User must update the weightage given by NSE into indicator to use it flawlessly.
Disclaimer : Here the volumes are average of volume - of all Bank-Nifty banks.
User Options : Option to input security name and weightage nearby.
also have SMA of volume of user defined length.
Visual Checks - The user could manually validate the back test results on various assets they would like to use this strategy on before putting it live.
How to get access
Please click on the link / email available in the signature or send me a private message to get access.
Feedback
Please click on the link/email in the signature or send me a private message for suggestions/feedbacks.

Pivot Points by stelmaxFor pivot levels, we use different definitions of the pivot point. In fact, there are three different methods to calculate the reference level using this method.
For these pivot points, we set the variable x, the value of which depends on whether the open is higher or lower than the close.
If the close is less than the open, x = H + 2L + C.
If the close is higher than the open, x = 2H + L + C.
When open equals close, x = H + L + 2C
This final value will be one of the most commonly used designs. This is because, as FX is a 24 hour market, the open is almost always equal to the close.
If you look at the daily chart throughout the week, the close and the open are really just names. This is in contrast to the stock market, where the open and close are very different things, separated by time and price.
Once we have the pivot point and the x-value, we use it to compute the pivot point of the base P.
P = x / 4
Support and resistance levels are also calculated from x (pivot points do not use more than one support and resistance level).
S₁ = x / 2 - H
S₂ = x / 2 - L
Thus, we have seen how to calculate different types of Pivot Points indicator. But how can we now use them in our trade?
First, we can use our anchor point to define the general direction. - If the existing market price is above the key PP level, it suggests a bullish trend.
- If the market is below the key PP level, it suggests a bearish trend.
Pivot levels are set according to the value of the previous trading day.
+ If the price is below the PP pivot level - priority is given to sell deals, if higher - to purchases
+ Confirmatory signals can be candlestick patterns and the Stochastic indicator
+ The SL level can be set either for a signal candle or for the nearest level
+ Target - movement to the nearest support / resistance level
Keep in mind that the Pivot Level Indicator is not a complete trading system!
Remember that there are no indicators in trading that do not make mistakes, Pivot Points, like any others, require confirmation of their signals. When building your own trading system, use several indicators.
Observe Money Management. Never risk more than 2 percent of your capital in one trade. This approach will protect you from ruin and will allow you to consistently make money on Forex using the Pivot Point.
Be clear about your trading strategy. If, according to the pivot point strategy, you need to open a deal - open, if you fix the result - fix it, and it doesn't matter if you are in the black or not. Only following the rules of Pivot Points "from and to" will allow you to earn.

MAX SAHAM ADX with DI Max Saham's ADX line with D+ & D-
ADX is used to quantify trend strength.
When the D+ (+DMI) is dominant and rising, price direction is up.
When the D- (-DMI) is dominant and rising, price direction is down. But the strength of price must also be considered.
Uses Wilder's MA to get a more accurate ADX reading as compared to SMA.
Also added the green background to indicate the trend and also dots to indicate bull and bear crossing of the DMI's

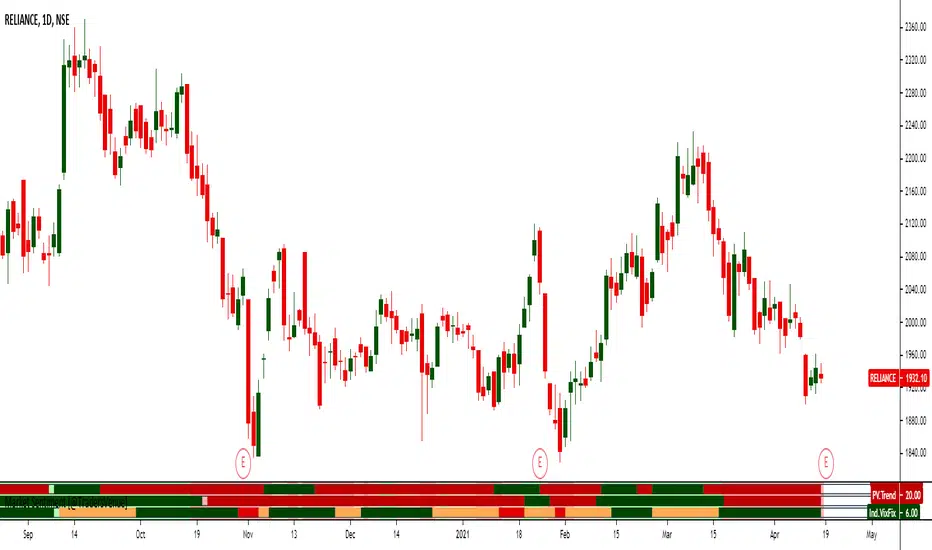
Market Sentiment [@TradersVenue]This majorly combines 3 indicators. More detailed usage will be taught to the subscribers as part of webinars to understand how to use these along with VSA to improve the trading results.
1)Mean Revert Indicator (M.Revert) - Most useful for intraday. When M.Revert bar turns red its ideally a sell signal. When M.Revert bar turns green its buy signal.
2)PV.Trend is nothing but price volume trend. Green bullish, red bearish.
3) Ind.VIxFix - Its India VIX. When its red it means VIX is shooting up and chances of fall is higher. When VIX turns green VIX is cooling down and market may consolidate or go higher.
When VIXFIX turns green its a good time to sell straddle or strangles and avoid neutral strategies when red. Additionally when VIXFix turns red, simply exit the losing leg holding the other leg of the neutral strategy. It helps.
GOD's EYEGet to know when to accumulate when biggies are buying and when to stay away from the stock

Zeta Volume Profile ProWhat is Volume Profile?
Volume Profile is an advanced order flow analysis which displays volume distribution at various price points over time. It may be called a recent biodata of a stock which is displayed on a chart as a horizontal histogram. Volume Profile can help reveal significant price levels where smart money is sitting.
Why Volume Profile is important?
The life of a Future Contract is of maximum 3 months. All the near month contracts expire on the last Thursday of the respective month. But, the traders who want to continue holding on to their winning positions would likely take the same position in the next series. So they often close the existing position near the expiry and take position in the next series. This activity is termed as Rolling Over the position and mostly it catches strength about 5-6 days before the expiry.
If we start tracking Volume Profile 5-6 days before the monthly expiry, we get to know the levels where maximum concentration of volume is located. In layman terms, we want to see where the biggest crowd is sitting. In this crowd, there will be equal number of buyers and sellers and when either party starts feeling the heat (market goes against them), they try to limit their loss by Buying/Selling and the random walks become a unidirectional march.
Zeta Volume Profile Pro tries to detect this crowd behavior by tracking maximum volume concentration area and when price leaves this area, it generates Buy/Sell Signals.
What is unique about Zeta Volume Profile Pro?
There are other volume profile indicators also in the market but Zeta Volume Profile Pro is unique in following aspects:
1. Whenever last Thursday of any month starts, Zeta Volume Profile Pro resets automatically and starts calculating volume and price levels from 30 bars backwards (default value which the user can change). Assuming we are looking at 30 Min. Time-Frame chart and your Stock Exchange opens for 6 hours a day, the last 30 candles cover 5 days data. If in your time zone, stock exchange remains open for longer hours, you can either increase minimum number of bars to be considered or you may increase your time-frame. The idea is you should cover 5-6 days of data on last Thursday of the month.
2. Once you set the minimum number of bars and time-frame relevant to you, leave everything to Zeta Volume Profile Pro. Now with every passing tick, the volume profile created by Zeta Volume Profile Pro will keep changing and more and more price bars will keep adding to the minimum number of bars set by you till last Wednesday of the current month occurs.
3. On any given day or time, whenever price breaks out of maximum volume concentration area, the indicator generates a Buy/Sell Signal and often such breakouts give handsome returns.
What markets it is suitable for?
It can be used in any time-zone on any stock exchange. However, since the concept is based upon Volume Concentration, it works best on highly liquid stocks, commodities, currency pairs and indices.
It will not give good results if the underlying security is illiquid because volume profile generated will not be efficient one.
Since Future Contracts volume tends to be more than cash segment, it gives much better results on Futures Charts.
Which time frames are best for this indicator?
Choose such time-frame and minimum number of bars which are equivalent to 5-6 trading sessions in your time-zone. In settings, there is an option to set your time-zone.
How to Take Buy/Sell Entry with Zeta Volume Profile Pro?
Whenever you see a Buy Signal appearing on your chart, take Buy Entry and whenever you see a Sell Signal, take Sell side Entry.
Your STOP LOSS would be high or low of candle which occurs just before the Buy/Sell Signal respectively.
Keep moving your STOP LOSS up as the price moves in your favor and when market turns around and you see a SELL signal, it is time to book your BUY position profit and take Entry on SELL Side now and so on.
What are the limitations of this indicator?
Sometimes price takes a break out of maximum volume concentration area and then again comes back which might hit your stop loss. However, as the backtested data shows, having faith in the indicator will give you some so nice breakouts that a single trade will cover your 10 to 20 Stop Loss hits.
How to get this indicator?
This is invite-only indicator. Get in touch with us using information given below in Signature field to try this tool FREE for 02 live sessions. After that, it is subscription based access.

Candlestick RSThis is a candlestick charted Relative Strength indicator. It compares the chosen stock's progress compared to that of the SPY ETF ... ( SPY is used so it should hopefully update intraday). I use this indicator to see which stocks are outperforming the market.
Input Variable Descriptions:
Ratio: this variable is a float (0 to 1) that is basically how close the Candlestick RS is to the actual price action of the chart. (1.0 being right on top of it, 0.0 being as far away as possible from it)
Ballpark SPY price: this variable has to be constant, and due to the way pinescript works, you have to manually put in a ballpark of what SPY is at.
Neither of these variables influences the actual data of the indicator, but rather how it is shown on screen. It's difficult to describe, so I recommend you messing around with the variables and see what changes.
Hope this helps, I find this useful, so I figured I'd publish this... This is my first pine script so forgive me for any errors, just want to help :)
[Steve Woods Float Analysis ] Volume Float Indicator This Indicator is developed as mentioned in Steve Woods Book
"Float Analysis, Powerful technical Indicators using Price and Volume"
Overview
Float analysis is a holistic approach to studying the technical behavior
of stocks. By this I mean it treats the shares actually being traded as equal in importance to price and volume activity. Thus, price and volume are seen as only two-thirds of the picture, with the number of shares actually traded being the final third that completes the picture. The power of looking at stocks this way is that it demonstrates a direct relationship between the volume of shares traded in the past and subsequent future movements in price. Thus, float analysis is a powerful tool to predict future stock price movements. In addition, by studying stocks holistically, float analysis expands and clarifies the definition of several technical terms. These include bottoms and tops, support and resistance, and accumulation and distribution.
Float analysis also allows us to create a model of price, volume, and tradeable shares activity. As a model it does not claim to be the “truth” of all stock price and volume activity. It is, of course, just one point of view among many. But like any valid model, it has the ring of truth; and to all who listen, float analysis rings rather loudly. Its appeal as a model of stock behavior is three- fold. First, it is based on several discoveries that are easy to understand. Second, it is backed up by hard data. And third, it makes common sense.
The first and most important discovery, made in 1993, is a simple concept with profound implications. In order to understand this discovery, we need to know two key terms: float and float turnover. The float is well known to knowledgeable market players. I coined the term float turnover to explain the discovery.
The Float
Any given stock has only a certain number of shares that are actually avail- able for trading. These freely traded shares in the hands of the public are called the float, a shortened version of the floating supply of shares. For big companies, like Intel or Microsoft, the number can be over a billion shares. For a small, obscure company, it may be a few hundred thousand. But every company has a specific number of shares that is actually traded by the pub- lic. The float should not be confused with the shares outstanding, which includes both the floating supply of shares and those shares held tightly by the company’s management. The float number for any given company can change periodically; the management might issue more shares, they might sell their shares, or the shares might go through a stock split. The number of shares in a company’s float is not a secret. It is a publicly accessible from a number of sources
A Float Turnover
A float turnover is the amount of time it takes for a number of shares to trade that cumulatively corresponds with the number of shares in the stock’s float. For example, if a company’s float has 100 million shares that are actively trading and the total cumulative volume of shares traded over the last year was 100 million shares, then a single float turnover would be a one-year span starting from the current date and going back to the day when the cumulative total of the volume equaled 100 million shares. In other words, all we’ve done is add the volume numbers from a starting point back to a date when the total equals the float number. There is in this definition an important point that needs to be noted. Although the company’s float is 100 million shares and 100 million shares were traded in a one-year span, we cannot say that all the shares in the float have been traded. This is because it is impossible to know the intentions of all the market participants. There may be short-term day traders who buy and sell several times during a float turnover, and there may be long-term investors who are holding their shares and not trading at all. This being the case, we can only say approximately all the shares in the float were traded. We can, however, quite correctly say that the total number of shares that were traded corresponds to the number of shares in the stock’s float. This is because we can add up the number of shares that were traded during any time frame and compare it to the stock’s float number. When the number of shares traded in any time frame is the same as the float number, we can say that by our definition we have a float turnover.
To some degree, a complete change of ownership in the company is implied by a float turnover, but it can never be measured with any degree of precision.
Real Life Applications
One can make a good strategy out of it
Can be used as confirmations to the old school patterns observed
Useful in deciding recovery points
Useful in deciding reverse trade points
Useful in deciding catastrophic Exit Plan
Some more Visual Examples
Which Timeframes it can be used
Can be used in any timeframes
like : 15s, 30s, 1m, 3m .... 1D, 1W, 1M,
Only to be used for securities for which tradingview provides volume data
How can you get this Indicator
You get this indicator only by messaging me privately , do not use the comment box for requesting access to the indicator, as it is against the house rules of Tradingview community. Use comments only for adding or suggesting constructive stuffss.
Last but not the least Thanks to TradingView for providing us such an awesome platform!

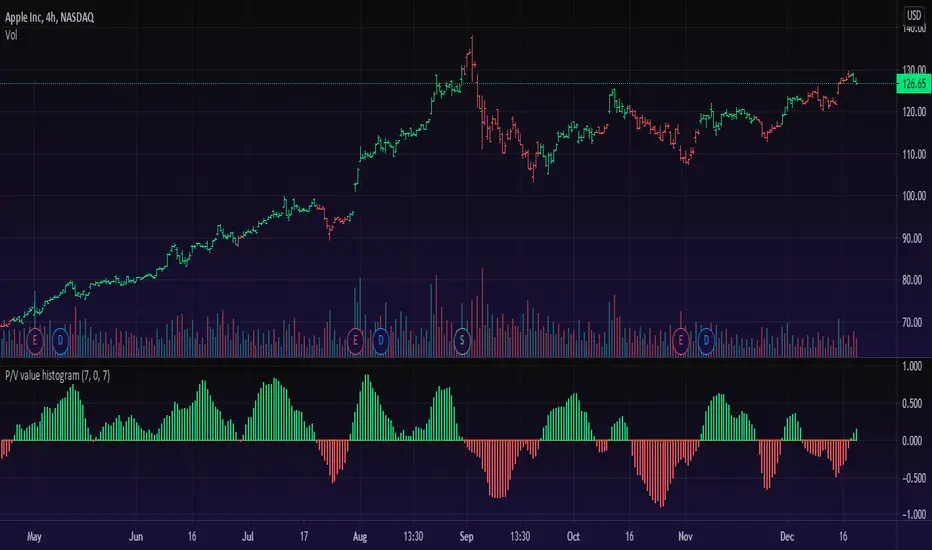
Price/Volume Value HistogramAn interesting implementation of mine to measure an asset changes based on asset price velocity and volume velocity. The indicator acts as asset value calculator. Long and Short.
==Points System Rules==
UPTRENDING
If Current Close is higher than previous Close and Current Volume is bigger than previous Volume: Adds Close Points and Volume Points
Otherwise check
If Current Close is higher than previous Close: Adds Only Close Points
DOWNTRENDING
If Current Close is lower than previous Close and Current Volume is bigger than previous Volume: Reduces Close Points and Volume Points
Otherwise check
If Current Close is lower than previous Close: Reduces Only Close Points
==Plotting==
Result of the values are summed up to a histogram.
Obviously on increasing prices and volume the histogram will be above zero line and on the Bullish side (green color), otherwise, on the Bearish side (red color).
You can't cheat the price movement, it's just what it is.
Optional to smooth it by EMA (set to true by default).
Like if you Like and Enjoy!
Follow for upcoming indicators.
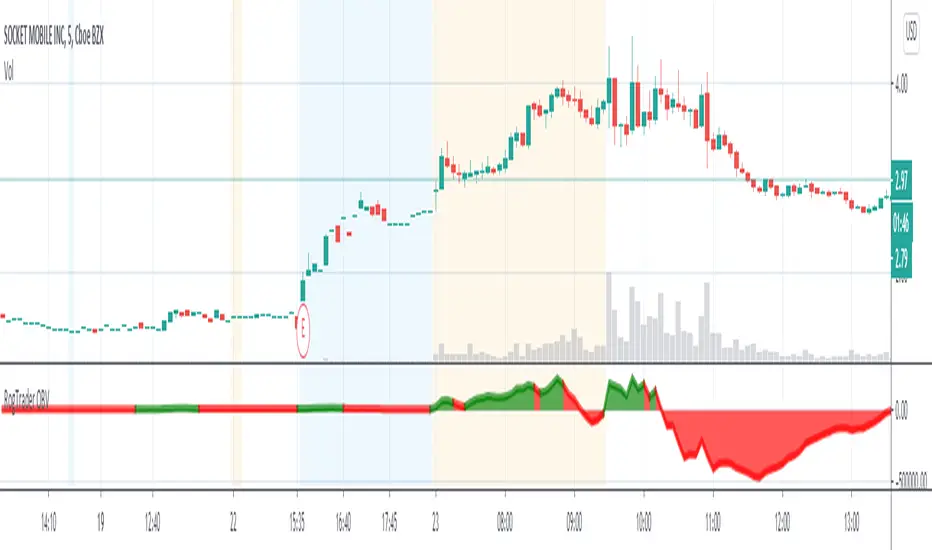
RogTrader On Balance VolumeSmoothed, Simplified, and Color-coded OBV to easily understand the price direction.
Primarily uses Price Action, Moving Averages(EMA), and Volume
Green Zone is Uptrend
Red Zone is the Downtrend.
Confirm the direction with other indicators
Check multiple timeframes.
RogTrader Bull Bear StrengthsSimplified Bull/Bear Strengths Indicator uses price action, volume flow, and candlesticks to calculate bull and bear strengths, also known as buying and selling pressures.
Green/Red Volume Bars can be misleading at times
This indicator shows the net bull/bear power
Recommended to be used in combination with indicators to find reversal signals.
For example, during an uptrend, a long red bar indicates that strong selloff has started, and bears begin to control the bargains.

CC - PVT CloudsReleasing this test script for PVT ratios using sub-interval harmonics at a 1D, 4H, 1H, 45M, 15M and 5M level.
It basically takes the PVT values for a rolling periodic interval and gets the (avg - min)/max for that interval (the ratio).
Then it colors it based on the subinterval next to it. Just think of it as rolling Ichimoku clouds, but in real-time using PVT.
I'm not saying much more than that, as this is an experimental indicator. Feel free to use it and give me feedback.
Drop a like if this helps you trade, but please do not use these indicators as a DIVINING ROD for your trades.
However, I will possibly release a paid version with TEXTUAL take profit/stoploss indicators.
*DISCLAIMER*
No amount of technical indicators will safe you from a lapse in Due Diligence or Market/Industry Judgement.
I am not responsible for lost equity due to trades caused my relying on this indicator.

@sumonpal 1.0 Price ChartThis is a momentum and volume based strategy. Plot "@sumonpal 1.1 Momentum Indicator" & "@sumonpal 1.2 Volume Trend" indicators to check the trading signals.
1. Barcolor is GREEN -> When Momentum is in green region and Volume is in green region
2. Barcolor is RED -> When Momentum is in red region and Volume is in red region.
3. Barcolor is YELLOW -> Volume and Momentum is not going in same direction. Staying away from trading is good in this scenario.
Entry --> Above/below the 50% range of the signal bar
Target --> Target is calculated based on signal bar ATR
Buy Entry Condition -->
a) Though entry level is plotted on chart but fresh entry is plotted when Volume and Momentum both turned green. Wait for the bar to close above the entry level in your timeframe. Say, you are using 5m timeframe, go long only when 5m bar closes above the entry level.
b) Stop loss could be low of previous bar where entry is confirmed
c) Exit - Once 1st target is met, 50% position can be booked and SL can be moved to entry and trailed. Another way is to trail based on ATR or whatever suits you.
Short Entry Condition -->
a) Though entry level is plotted on chart but fresh entry is plotted when Volume and Momentum both turned red. Wait for the bar to close below the entry level in your timeframe. Say, you are using 5m timeframe, go short only when 5m bar closes below the entry level.
b) Stop loss could be high of previous bar where entry is confirmed
c) Exit - Once 1st target is met, 50% position can be booked and SL can be moved to entry and trailed. Another way is to trail based on ATR or whatever suits you.
Attention->
1. Be extra cautious on long in overbought zone (@sumonpal 1.1 Momentum Indicator).
2. Be extra cautious on short in oversold zone (@sumonpal 1.1 Momentum Indicator).
3. Avoid trading when "@sumonpal 1.1 Momentum Indicator" & "@sumonpal 1.2 Volume Trend" are flat.
4. Whipsaws could be there in rangebound market. To avoid that I follow the below process:
a) No fresh buy in first 15m (if timeframe is below 5m)
b) after 15m, mark the high low of first 15m min, ignore signals within the first 15m range
c) after 30m, mark the high low of first 30m min, ignore signals within the first 30m range
d) if timeframe is below 1hr, do not trade based on signal of previous session i.e. signal is there at last bar of the previous session and next day trade is confirmed on first bar --> avoid that trade
e) Look for divergences in momentum indicator and avoid signals in divergence is in progress.
Disclaimer: Trading in equity is risky. Asses your risk profile before trading. If you make loss/profit, you will be responsible for that, not me. Backtest this strategy before using.
Freedom of MovementFreedom of Movement Indicator
---------------------------------------------------------
In “Evidence-Based Support & Resistance” article, author Melvin Dickover introduces two new indicators to help traders note support and resistance areas by identifying supply and demand pools. Here you can find the support-resistance technical indicator called "Freedom of Movement".
The indicator takes into account price-volume behavior in order to detect points where movement of price is suddenly restricted, the possible supply and demand pools. These points are also marked by Defended Price Lines (DPLs).
DPLs are horizontal lines that run across the chart at levels defined by following conditions:
* Overlapping bars: If the indicator spike (i.e., indicator is above 2.0 or a custom value) corresponds to a price bar overlapping the previous one, the previous close can be used as the DPL value.
* Very large bars: If the indicator spike corresponds to a price bar of a large size, use its close price as the DPL value.
* Gapping bars: If the indicator spike corresponds to a price bar gapping from the previous bar, the DPL value will depend on the gap size. Small gaps can be ignored: the author suggests using the previous close as the DPL value. When the gap is big, the close of the latter bar is used instead.
* Clustering spikes: If the indicator spikes come in clusters, use the extreme close or open price of the bar corresponding to the last or next to last spike in cluster.
DPLs can be used as support and resistance levels. In order confirm and refine them, FoM (Freedom of Movement) is used along with the Relative Volume Indicator (RVI), which you can find here:
Clustering spikes provide the strongest DPLs while isolated spikes can be used to confirm and refine those provided by the RVI. Coincidence of spikes of the two indicator can be considered a sign of greater strength of the DPL.
More info:
S&C magazine, April 2014.

Price Volume Strength ComparatorBollinger bands says whether price or any source is relatively high or low at any particular point of time. We can apply Bollinger bands on RSI and volume indicator Price Volume Trend to identify if RSI movement or PVT movement is relatively high or low.
By calculating Bollinger %B, we can define the variation in a range between 0 to 1. By applying Bollinger %B on price, volume and strength, we are trying to compare how much they differ relative to each other.
For example, if Bollinger %B of volume is higher than Bollinger %B of price, which may mean, we can still expect continuation of upward movement. If volume %B is lesser, we can interpret this as price has moved more than the volume and may retrace back.
Note: I tried adding multiple volume/strength indicators as input choice. But, if condition did not work with simple string. Have no idea why. I will try adding that later if more people show interest.

DTC_ZoneThis Indicator can be used for finding the supply and demand zone. Supply and demand has been fetched from the past 10 days volatility of the particular stock. And the main thing is the target and stop-loss were arrived based on the Fibonacci retracement.
