Advanced Trend Break TargetsIntroduction
The Advanced Trend Break Targets (ATBT) is a semi-automated technical analysis system designed to validate trendline trading strategies with algorithmic precision. While standard trendlines are subjective drawings, the ATBT converts user-defined price structures into a mathematical model. It projects a trajectory based on two specific "Anchor Points" and monitors price action for valid breakouts, applying a strict "Confluence Filter" before generating signals or projecting targets.
Originality & Utility
Most trendline indicators rely on automatic detection, which often draws lines across irrelevant swing points. The ATBT respects the trader's discretion by allowing manual placement of the trendline (via timestamps) while automating the tedious tasks of monitoring for breaks, checking momentum conditions, and calculating Fibonacci risk-to-reward levels. This "Hybrid" approach combines human pattern recognition with machine discipline, ensuring trades are only signaled when specific quantitative conditions are met.
Detailed Methodology
1. The Advanced Projection Logic
The core of the script calculates a linear trajectory between two points in time (Start Date and End Date). Unlike standard drawings, this script calculates the exact slope (m) using the bar index difference
The script automatically detects the "Price Source" at your chosen timestamps. If a Pivot High exists at the start date, it defaults to a Resistance Line (Highs). If a Pivot Low exists, it defaults to a Support Line (Lows). This slope is then projected forward indefinitely:
2. The Confluence Filter (Multi-Condition Validation)
A raw price crossover is often a "fake-out." To combat this, the script includes a Mandatory Conditions engine. A breakout is only confirmed if the user-selected conditions are TRUE at the moment of the cross:
Volume Confirmation: Verifies if the breakout bar's volume is greater than its 20-period SMA.
CHOCH (Change of Character): Checks if the price has broken the most recent Swing High (for bullish setups) or Swing Low (for bearish setups) prior to the trendline break.
Swing Break: A strict check requiring the close to be beyond the last swing point.
Momentum (MACD & RSI): Ensures the MACD line is crossing the Signal line or that RSI is on the correct side of the 50 threshold.
Trend Filter (SMA): Verifies that price is above the 20 SMA (bullish) or below it (bearish).
3. Dynamic Target & Risk Calculation
Upon a validated breakout, the script scans the chart history for the most recent Pivot High or Low (within the lookback period) to define the "Structure Width" or Risk distance (D).
Stop Loss (SL): Placed at the recent Pivot Price.
Target 1: Projected at $1.0 \times D from the breakout point.
Target 2: Projected at $1.618 \times D (Golden Ratio).
Target 3: Projected at $2.618 \times D.
How to Use
1. Identify the Structure: visually identify a trendline on your chart (e.g., the upper resistance of a Wedge or Flag).
2. Set Anchors: Go to the script settings (Inputs tab) and enter the exact timestamp for Point 1 (Start of trendline) and Point 2 (End of trendline).
Tip: Ensure these dates align with the specific high/low candle you want to anchor to.
3. Configure Filters: Toggle the checkboxes in the "Mandatory Conditions" group.
Example: If you want to trade pure price action, enable "Require CHOCH" but leave "Require MACD" unchecked.
4. Interpret Signals:
Blue Labels (1 & 2): Indicate where the script has Advanced the trendline.
"Breakout" / "Breakdown" Label: Appears when price crosses the projected line AND all selected conditions are met.
Green/Red Dotted Lines: represent your Take Profit targets based on the structure width.
Inputs & Settings
TBT Group:
Start/End Date: The timestamps defining the line.
Pivot Left/Right: Controls the sensitivity of the pivot detection used for Stop Loss placement.
Extend Target Line: How far into the future the target lines are drawn.
Mandatory Conditions Group:
Require Volume / CHOCH / MACD / SMA / RSI: Individual toggles to build your specific trade strategy.
Thresholds: Adjust the lengths for SMA and RSI to match your preferred timeframe.
Example:
XAUUSD 4-hour timeframe
We had an uptrend. We added the indicator and set the point at the penultimate low (HL) and then the second point at the last low (HL), as shown in the following image.
You can choose the conditions you prefer to be met to trigger the breakout from the user settings.
Based on the conditions you set, if they are met, the indicator displays all the data, as seen in the following image. A stop-loss point was set, the breakout candle was identified, and the first target was set (you can choose to display the second and third targets from the user settings, noting that they are less likely to be achieved).
As we can see in the last image, the price reached the first target, then continued its path and achieved the second target as well. Afterward, it shifted to a short sideways trend and then reversed.
TBT vs. ATBT: Key Technical & Functional Enhancements
The ATBT (Advanced Trend Break Target) script introduces significant upgrades over the Free TBT, transforming it from a pure geometric breakout tool into a comprehensive strategy scanner with multi-factor confluence capabilities. Below are the primary differences:
1. Integration of Confluence Filters ("Mandatory Conditions")
The most substantial change is the addition of a robust filtering engine. While TBT relied solely on price crossing the trendline to trigger a signal, ATBT introduces a "Mandatory Conditions" input group. Traders can now require specific criteria to be met before a breakout is validated:
Volume Confirmation: Requires volume to exceed its SMA.
Market Structure (CHOCH): Can require a Change of Character to have occurred prior to the entry.
Momentum & Trend Filters: Options to enforce confirmation from MACD (crossovers), RSI (thresholds), and SMA (price location relative to the moving average).
2. Automated Risk Management (Stop-Loss)
ATBT adds a built-in Stop-Loss mechanism, addressing a missing feature in TBT.
TBT: Only projected Profit Targets (T1, T2, T3).
ATBT: Automatically calculates and plots a Stop-Loss (SL) level based on the pivot price used for the setup. This provides an immediate Risk/Reward visualization upon signal generation.
3. Smart Source Detection
ATBT improves user experience with an automation feature regarding the "Price Source" (High vs. Low).
TBT: The user must manually select whether they are anchoring to "High" or "Low" via the settings.
ATBT: The script attempts to automatically detect the correct source at the "Start Date" by checking if a pivot high or low exists at that timestamp, reducing manual configuration errors.
4. Enhanced Visuals & Swing Point Tracking
Visual clarity has been upgraded in the new version.
Swing Points: ATBT includes a `showSwingPoints` toggle that plots visual markers (circles) on Swing Highs and Swing Lows, helping traders visualize the market structure used for CHOCH and pivot calculations , Helping the trader identify the locations of the first and second points .
Signal State Tracking: ATBT uses "latched" logic (e.g., `chochMet`, `swingBrkMet`) to track if conditions were met anytime between Point 2 and the breakout, whereas TBT treated CHOCH largely as a separate visual component unrelated to the main trigger.
5. Refined Signal Logic
TBT: Triggers immediately upon a close across the trendline.
ATBT: Triggers only if the trendline cross occurs AND all enabled "Mandatory Conditions" return true. This significantly reduces noise by filtering out low-quality breakouts that lack structural or momentum support
Disclaimer
This script is a tool for visualizing market structure and calculating potential geometries. It does not guarantee future performance. Breakouts can fail, and "Mandatory Conditions" are lagging indicators that confirm past data. Always manage risk responsibly.
Profittargets

Trend Break Target
The Trend Break Target indicator helps traders identify and trade potential breakout opportunities with precision. It offers the following key benefits:
Customizable Trend Anchors
Allows traders to set specific start and end dates for the trendline, ensuring analysis is aligned with chosen time windows.
Supports different price sources (High, Low, Close) to fit diverse trading styles.
Automatic Trendline Projection
Dynamically plots a trendline between selected anchor points and extends it forward, providing a clear visual guide for future price interactions.
Breakout Detection
Instantly detects when price breaks above or below the trendline.
Plots breakout markers (▲ / ▼) directly on the chart to highlight actionable trade signals.
Pivot-Based Target Calculation
Uses the nearest valid pivot high/low before the breakout (or a fallback lookback if unavailable).
Measures the distance between the pivot and the trendline, then projects a target price in the breakout direction.
Clear Visual Targets
Draws a dotted target line to show where price may reach after the breakout.
Adds a connector line from breakout to target and a measurement line from pivot to trendline, improving clarity of the setup.
Automatic Reset & Efficiency
Resets calculations when new anchors are applied, keeping charts clean and reducing noise.
Deletes old lines and labels automatically to optimize chart readability.
Strategic Trade Planning
Helps traders quickly identify risk-reward opportunities by visualizing breakout levels and price targets.
Useful for trend continuation as well as reversal trading strategies.
👉 In short, the FTBT indicator provides a structured way to analyse trendlines, confirm breakouts, and project realistic price targets—making it a powerful tool for both discretionary and systematic traders.

Average Range @coldbrewroshTaking the average daily range from low to high or high to low isn't the "best" way to get an idea of how much to set targets. So, I made this indicator to make the system better.
This indicator calculates the daily range from Open to High on Bullish Days & Open to Low on Bearish Days .
Nobody can catch the absolute low of the day on bullish days and get out at the high but one can enter at a reasonable price around the open ( 17:00 EST ) .
To complement the Average Range, another table shows the movement in the opposite direction.
For Instance: On Bullish Days how much it moved from Open to Low so that we have an idea of where to put the stop loss and vice versa. The time ranges calculated are the last 5 days, last 1 month, last 3 months & last 1 year.
Note #1: Even though the date range is predefined, it has a different meaning. For Instance: date range of last 5 days means "calculation of the range of last 5 bullish daily candles & not last 5 days" .
Note #2: Exclusive to Forex at the time of posting this.

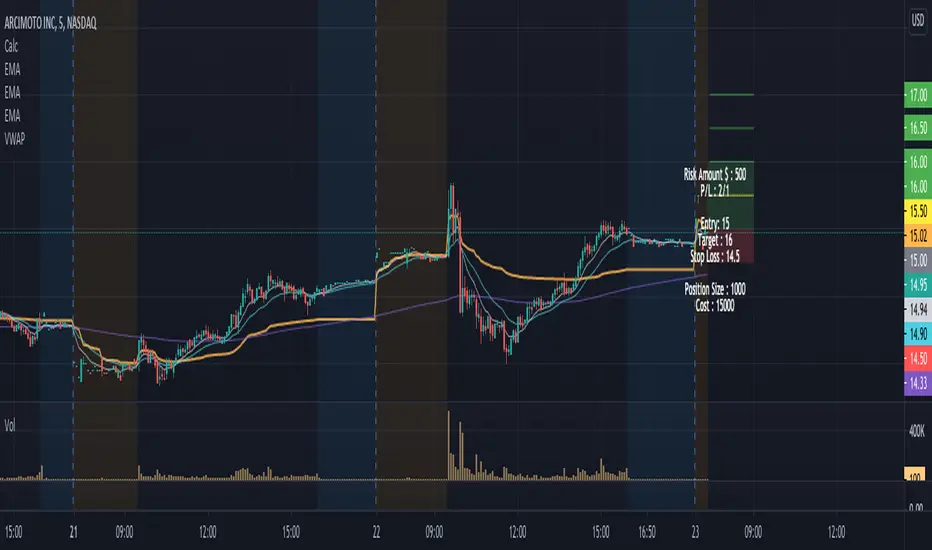
Position Size Calculator w/ profit targetsThis script helps the user visualize profit targets and calculates position size based on the input risk amount.
Input variables:
- Risk amount
- Entry price
- Stop loss amount
- Profit target amount
Calculated variables:
- Profit loss ratio
- Position size
- Postion cost
Plotted variables:
- shaded: entry price --> price target (green filled)
- shaded: entry price --> stop loss target (red filled)
- 1:1 p/l ratio --> yellow line
- 2:1, 3:1, 4:1 p/l ratios --> green lines
Overlay text can be toggled on/off in parameter input section
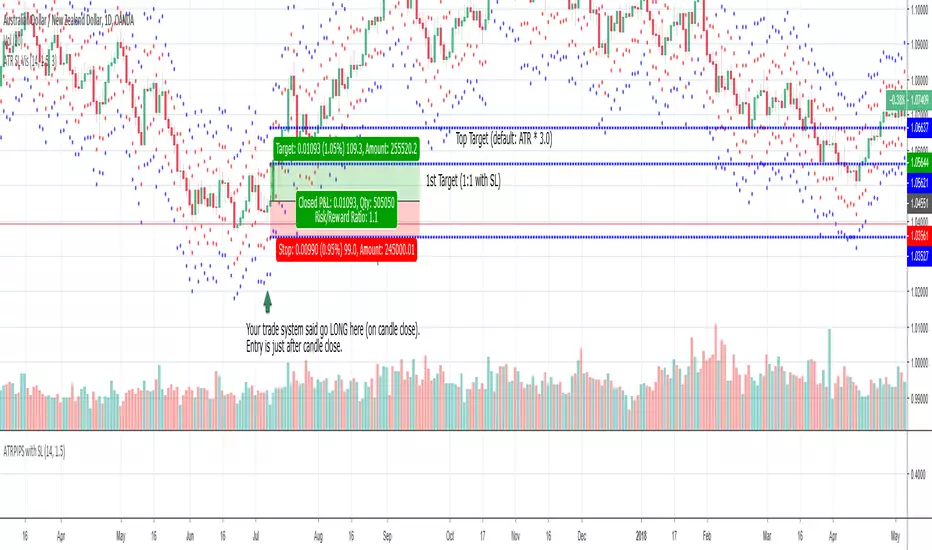
ATR SL Visualization (on chart)This indicator plots 2 sets of dots (and lines) based on your chosen ATR multiplier (Average True Range).
Generally, when trading on the daily timeframe a good rule of thumb is to use the ATR * 1.5 (the default setting of this indicator).
I created this indicator to quickly test other indicators but I also find it helpful in live trading.
How to use this indicator:
Your trade system provides an entry signal. The red dot (can be connected line in options) would be used as the stop loss for either a long or short.
Then the dot on the other side would be your first 1:1 target.
The blue line is the same ATR multiplier as a target (default but can be modified).
Using an additional tool like the horizontal ray can be helpful to see the exact location the SL might be hit or where the target might hit.
When drawing your ray ensure you’re using the right entry candle.
For instance, in a long scenario you would typically be entering a trade after your signal candle closes. So draw the ray at the point in price on the next candle for both stop loss and target.
Also use these dots (lines) as guides provides an easy way to plot SL and targets if you want to use the Long or Short tool.
For my trade systems I don’t use price targets (I exit when structure or indicators reveal to exit) but I do find it helpful to graph when testing. When something moves in my favor either the ATR or the ATR * 1.5 I take profit and typically move up my stop loss to break even or trailing.
The other strategy that could be possible but have not tested is as long as the SL is making a new high moving up a hard stop to the ATR SL each day the trade goes in your favor.
This should be obvious but if you want to use just the true ATR edit the multiplier to be 1.0