Vector Candle Zones/Cloud MTF X4Description:
This indicator employs Price, Volume, Support, Resistance Analysis (PVSRA), a trading strategy that analyzes price movements, volume, support, and resistance levels to identify potential trading opportunities. It detects large, volatile moves with significant activity in specific zones on the chart, which the market tends to revisit due to the high transaction volume in these areas. The primary purpose of this indicator is to draw these high probability areas where the market is likely to return.
The PVSRA algorithm used in this indicator:
Detects climactic situations: The algorithm identifies climactic situations by looking at bars where the volume is at least 200% of the average volume of the previous 10 bars. Additionally, it checks if the product of the candle spread, and candle volume is greater than or equal to the highest value for the previous 10 bars. In these situations, if the bar is bullish (closing price is higher than the opening price), it is colored green; if it's bearish (closing price is lower than the opening price), it is colored red.
Detects above-average volume situations: The algorithm looks for bars with a volume that is at least 150% of the average volume of the previous 10 bars. In these cases, if the bar is bullish, it is colored blue; if it's bearish, it is colored violet.
If the bar does not fall into climactic and above-average situations: The bar is colored with shades of gray depending on whether it's bullish or bearish, and is not considered a vector (aka. vector zone of interest).
The algorithm calculations can adapt to show the above information also from higher time-frames.
Using the indicator:
Utilize this indicator to trade towards and away from vector areas, and watch for reversals when these zones are recovered. While there are no certainties in trading, only probabilities, the vector candles on the chart represent high probability areas the market often revisits. Additionally, zones recovered between 50% - 100% signal high probability points where the market might change direction. The likelihood of market direction change increases as more vectors are recovered in succession. Although there is no set rule for when these vectors are recovered, monitoring candle colors (green, blue, red, purple) can help gauge the speed of a move to and from a zone. To use this indicator more effectively, establish a trend using other preferred indicators or even a simple EMA. Spend time studying how these zones are recovered for each specific asset.
Main Features:
High volume candles are detected and marked with colors, indicating high probability areas the market may revisit.
The indicator shows the percentage of a zone's recovery with labels for clear visibility.
If ghosting is enabled, fully recovered past candles (also called vectors) are highlighted to signal potential reversal points.
Imbalance Weighted Average (IWA) can be activated to display the point of attraction (mid/high/low) on high interest zones.
Fair Value Gaps can be displayed alongside PVSRA candles, as both represent imbalances in the chart.
The indicator supports showing 3x-4x higher timeframe PVSRA zones on a lower timeframe for convenience.
Pvsraanalysis

PVA Volume - DataCrypto Analytics
The PVA Volume indicator (Price Volume Analysis) is a technical indicator that transforms the accumulated historical data.
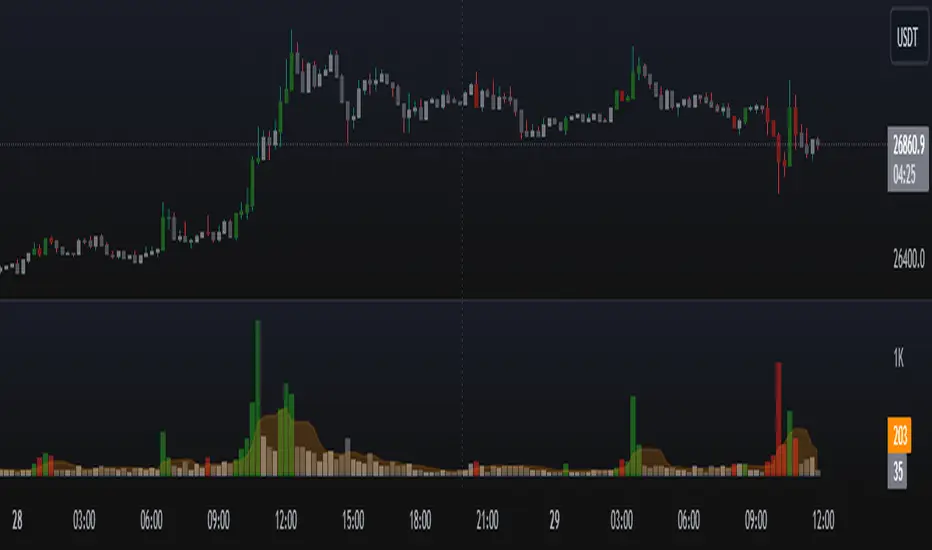
The PVA Volume Indicator displays a color-coded volume histogram based on Price Volume Analysis (PVA). It is plotted on a separate panel below the price chart of the underlying asset and colors the candles according to the PVA. The indicator represents four market states by means of four different colored histogram bars:
Green : Extreme volume on a bullish candle
Red : Extreme volume on a bearish candle
Silver : Neutral Volume, increasing more than the average
Gray : Neutral Volume
The PVA Volume indicator can be applied to confirm the action of the high or low price of any financial instrument.
PVA Volume + ATRThis indicator is actually a counterpart of the @JAPARICO indicator, if you can use the separate ATR use his, I also ask you to enjoy his indicator in the link below.
I created the PVA Candle + Dragon, in which he repatriated the indicator, I am doing the same, repatriating the indicator he created by adding the Average True Range (ATR), within the same indicator so that it can save space, many people end up leaving use for not having the necessary limit, so I decided to merge the same PVA Volume indicator so that you can use the Japa Rico strategy in a simple and easy way without being able to keep changing the indicator, the settings are easy, you will open the indicator gear in the settings -> clicking on style and changing the precision to 4 in order to apply the ATR to FOREX strategy. So the numeral ATR will be available in red, for you to use in your operations.
The code will be blocked, only @JAPARICO is the official owner of that indicator.

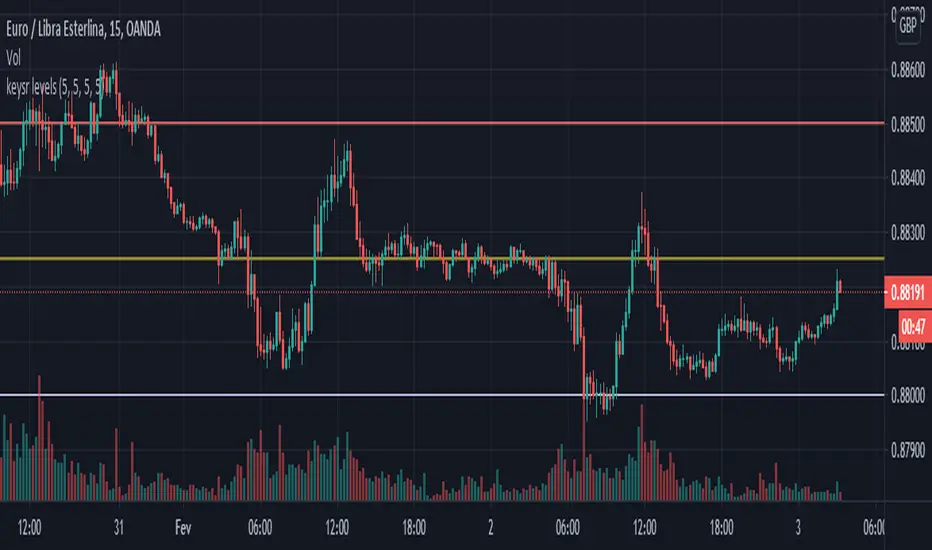
Key SR Levels. I am the original creator of this indicator for tradingview, it can be used separately now, it is a PVSRA indicator, where it marks the key points of support and resistance.
Market makers pull the market above the key level for distribution in bearish and pull below the key level for accumulation in bullish
Mainly used for
We have Whole level: main resistance ended in 000
We have a Key level ending in 250
We have half level finished in 500
And we have a Key level ending in 750.
Enjoy the indicator, share with friends. If it happens to be dented, pull until the graph stretches.
Note. This indicator works only for Forex, it can make a difference in pairs with Japanese Yen.
Whole Half Quarter Levels© ForexPipCheats and iceicebaby_
This indicator is coded to run on Trading View which was originally created by traderathome (TAH), qFish, and all other respective contributors for the mt4 version.
This indicator helps to enhance the visuals of the current price at the whole, half and quarter levels.
From time to time when there is a surge in price, the indicator might produce diagonal lines. If that occurs, simply switch TF and it should disappear. Otherwise, refresh or restart the indicator.

Daily and Fibo Pivots© ForexPipCheats
This indicator is coded to run on Trading View which was originally created by traderathome (TAH), qFish, and all other respective contributors for the mt4 version.
Daily Support & Resistance Pivots
You can select to display the support and resistance pivot lines (SR) using either the Daily or Fibonacci formulas.
The Fibonacci displays five levels.
Normally, the Daily displays only three levels but is extended to include five levels.
Due to the short TF it displays, the indicator would only appear on TF 1H and below.

Range Weekly HL© ForexPipCheats and iceicebaby_
This indicator is coded to run on Trading View which was originally created by traderathome (TAH), qFish, and all other respective contributors for the mt4 version.
It creates a Range High/Low Lines for the Week by displaying two horizontal lines, one for the computed range high target, and one for the computed range low target. The range is based on the averaging period of 13 days. A swing trader might pay more attention to the RWH/RWL lines, and hold a trade into oncoming days.
A. Two conditions determine where range lines appear
1. Condition #1 - the Week range has not exceeded the computed average range.
* The RWH line is the computed average range distance above the session Low.
* The RWL line is the computed average range distance below the session high.
* The lines will move as new highs/lows are achieved during the session.
* This display shows how far price can move in either direction before exceeding the computed average range.
2. Condition #2 - the Week range has exceeded the computed average range.
* If price swings during the Week TF cause the difference between the high and the low to equal the computed range, the range lines lock into place.
* This display will clearly show any subsequent breakout of the range.
B. The purpose of the range lines is to provide a perspective on how far PA might move during the trading week. This can be of some guidance in selecting where to exit a trade.
Due to pinescript limitations, the Daily HL is separated into another indicator which you may wish to add it into your chart

Range Daily HL© ForexPipCheats and iceicebaby_
This indicator is coded to run on Trading View which was originally created by traderathome (TAH), qFish, and all other respective contributors for the mt4 version.
It creates a Range High/Low Lines for the Day by displaying two horizontal lines, one for the computed range high target, and one for the computed range low target. The range is based on the averaging period of 15 days. A day trader looking for quick profits and limited exposure to market price swings might pay more attention to the RDH/RDL lines.
A. Two conditions determine where range lines appear
1. Condition #1 - the Day range has not exceeded the computed average range.
* The RDH line is the computed average range distance above the session Low.
* The RDL line is the computed average range distance below the session high.
* The lines will move as new highs/lows are achieved during the session.
* This display shows how far price can move in either direction before exceeding the computed average range.
2. Condition #2 - the Day range has exceeded the computed average range.
* If price swings during the day TF cause the difference between the high and the low to equal the computed range, the range lines lock into place.
* This display will clearly show any subsequent breakout of the range.
B. The purpose of the range lines is to provide a perspective on how far PA might move during the trading day. This can be of some guidance in selecting where to exit a trade.
Due to pinescript limitations, the Weekly HL is separated into another indicator which you may wish to add it into your chart

Dragon and TrendThis Dragon Band and Trend line indicators are based off PVSRA System. The Dragon uses the Exponential moving average indicator with a period of 50 while the Trend uses period 100 and 200 respectively. You may edit the period of the dragon and trend line to suit your analysis style.
Using this indicator along with PVA Candle and Volume can help you identify a trade setup for a suitable entry.

PVA Candles and Volume© ForexPipCheats and iceicebaby_
This indicator is coded to run on Trading View which was originally created by traderathome (TAH), qFish, and all other respective contributors for the mt4 version.
It creates standard PVA candlesticks and volumes based on Price Volume Support Resistance Analysis (PVSRA)
Special colours are used demote candles and corresponding volume bars where special situations occur involving price and volume
Hence PVA (Price-Volume Analysis).
The special situations or requirements for the colours are as follows:
Situation "Climax"
Bars with volume >= 200% of the average volume of the 10 most recent previous candles in the current TF, and bars where the product of candle spread x candle volume is >= the highest for the 10 most recent previous candles in the current TF. Bull bars are green and bear bars are red.
Situation "Volume Rising Above Average"
Bars with volume >=150% of the average volume of the 10 most recent previous candles in the TFs. Bull bars are blue and bear are blue-violet
**Important**
Please note that this indicator is a form of market analysis and not a trading method.
You are recommended to use this indicator with the Dragon and Trend indicator to guide your trading entry. You can find it in my profile.
The volume colours may not be the same if you compared it with mt4 as the broker you are using might differ.
Chat Display Settings
Make the necessary adjustments to your main chart in order for your indicator to display correctly.
1. Change the candle body and outline's transparency to 100%
2. Change the candle wick to silver /light grey for bull and dark grey for bear
Colour Settings
Note that the default colours are based on the colours of the PVA Volumes trading guide.
It is recommended to keep it default but please feel free to change it however you like.
Bull Volume Climax - Green
Bull Rising Volume - Blue
Bull Normal Volume - Silver / Light Grey
Bear Volume Climax - Red
Bear Rising Volume - Bear
Bear Normal Volume - Dark Grey
Alert Settings
This indicator comes with a custom alert setting whenever a Rising Volume or Volume climax condition is fulfilled. However, it does not trigger automatically and you are required to manually set the duration before it can be initialized.
1. Create an alert on your desired currency pairing by selecting "Apply PVA Alert"
2. Set alert per bar and change the alert setting duration to unlimited if possible
3. You are recommended to set multiple alerts on various TFs if possible ( M1 , M5, H1, H4, D1)
4. Remember to replace {Edit TF} in the alert message with the TF you have created the alert on.
This script will include additional SR and Daily Range indicator in the future, hopefully.
Comment if you have any questions
