Volume-Weighted Money Flow [sgbpulse]Overview
The VWMF indicator is an advanced technical analysis tool that combines and summarizes five leading momentum and volume indicators (OBV, PVT, A/D, CMF, MFI) into one clear oscillator. The indicator helps to provide a clear picture of market sentiment by measuring the pressure from buyers and sellers. Unlike single indicators, VWMF provides a comprehensive view of market money flow by weighting existing indicators and presenting them in a uniform and understandable format.
Indicator Components
VWMF combines the following indicators, each normalized to a range of 0 to 100 before being weighted:
On-Balance Volume (OBV): A cumulative indicator that measures positive and negative volume flow.
Price-Volume Trend (PVT): Similar to OBV, but incorporates relative price change for a more precise measure.
Accumulation/Distribution Line (A/D): Used to identify whether an asset is being bought (accumulated) or sold (distributed).
Chaikin Money Flow (CMF): Measures the money flow over a period based on the close price's position relative to the candle's range.
Money Flow Index (MFI): A momentum oscillator that combines price and volume to measure buying and selling pressure.
Understanding the Normalized Oscillators
The indicator combines the five different momentum indicators by normalizing each one to a uniform range of 0 to 100 .
Why is Normalization Important?
Indicators like OBV, PVT, and the A/D Line are cumulative indicators whose values can become very large. To assess their trend, we use a Moving Average as a dynamic reference line . The Moving Average allows us to understand whether the indicator is currently trending up or down relative to its average behavior over time.
How Does Normalization Work?
Our normalization fully preserves the original trend of each indicator.
For Cumulative Indicators (OBV, PVT, A/D): We calculate the difference between the current indicator value and its Moving Average. This difference is then passed to the normalization process.
- If the indicator is above its Moving Average, the difference will be positive, and the normalized value will be above 50.
- If the indicator is below its Moving Average, the difference will be negative, and the normalized value will be below 50.
Handling Extreme Values: To overcome the issue of extreme values in indicators like OBV, PVT, and the A/D Line , the function calculates the highest absolute value over the selected period. This value is used to prevent sharp spikes or drops in a single indicator from compromising the accuracy of the normalization over time. It's a sophisticated method that ensures the oscillators remain relevant and accurate.
For Bounded Indicators (CMF, MFI): These indicators already operate within a known range (for example, CMF is between -1 and 1, and MFI is between 0 and 100), so they are normalized directly without an additional reference line.
Reference Line Settings:
Moving Average Type: Allows the user to choose between a Simple Moving Average (SMA) and an Exponential Moving Average (EMA).
Volume Flow MA Length: Allows the user to set the lookback period for the Moving Average, which affects the indicator's sensitivity.
The 50 line serves as the new "center line." This ensures that, even after normalization, the determination of whether a specific indicator supports a bullish or bearish trend remains clear.
Settings and Visual Tools
The indicator offers several customization options to provide a rich analysis experience:
VWMF Oscillator (Blue Line): Represents the weighted average of all five indicators. Values above 50 indicate bullish momentum, and values below 50 indicate bearish momentum.
Strength Metrics (Bullish/Bearish Strength %): Two metrics that appear on the status line, showing the percentage of indicators supporting the current trend. They range from 0% to 100%, providing a quick view of the strength of the consensus.
Dynamic Background Colors: The background color of the chart automatically changes to bullish (a blue shade by default) or bearish (a default brown-gray shade) based on the trend. The transparency of the color shows the consensus strength—the more opaque the background, the more indicators support the trend.
Advanced Settings:
- Background Color Logic: Allows the user to choose the trigger for the background color: Weighted Value (based on the combined oscillator) or Strength (based on the majority of individual indicators).
- Weights: Provides full control over the weight of each of the five indicators in the final oscillator.
Using the Data Window
TradingView provides a useful Data Window that allows you to see the exact numerical values of each normalized oscillator separately, in addition to the trend strength data.
You can use this window to:
Get more detailed information on each indicator: Viewing the precise numerical data of each of the five indicators can help in making trading decisions.
Calibrate weights: If you want to manually adjust the indicator weights (in the settings menu), you can do so while tracking the impact of each indicator on the weighted oscillator in the Data Window.
The indicator's default setting is an equal weight of 20% for each of the five indicators.
Alert Conditions
The indicator comes with a variety of built-in alerts that can be configured through the TradingView alerts menu:
VWMF Cross Above 50: An alert when the VWMF oscillator crosses above the 50 line, indicating a potential bullish momentum shift.
VWMF Cross Below 50: An alert when the VWMF oscillator crosses below the 50 line, indicating a potential bearish momentum shift.
Bullish Strength: High But Not Absolute Consensus: An alert when the bullish trend strength reaches 60% or more but is less than 100%, indicating a high but not absolute consensus.
Bullish Strength at 100%: An alert when all five indicators (MFI, OBV, PVT, A/D, CMF) show bullish strength, indicating a full and absolute consensus.
Bearish Strength: High But Not Absolute Consensus: An alert when the bearish trend strength reaches 60% or more but is less than 100%, indicating a high but not absolute consensus.
Bearish Strength at 100%: An alert when all five indicators (MFI, OBV, PVT, A/D, CMF) show bearish strength, indicating a full and absolute consensus.
Summary
The VWMF indicator is a powerful, all-in-one tool for analyzing market momentum, money flow, and sentiment. By combining and normalizing five different indicators into a single oscillator, it offers a holistic and accurate view of the market's underlying trend. Its dynamic visual features and customizable settings, including the ability to adjust indicator weights, provide a flexible experience for both novice and experienced traders. The built-in alerts for momentum shifts and trend consensus make it an effective tool for spotting trading opportunities with confidence. In essence, VWMF distills complex market data into clear, actionable signals.
Important Note: Trading Risk
This indicator is intended for educational and informational purposes only and does not constitute investment advice or a recommendation for trading in any form whatsoever.
Trading in financial markets involves significant risk of capital loss. It is important to remember that past performance is not indicative of future results. All trading decisions are your sole responsibility. Never trade with money you cannot afford to lose.
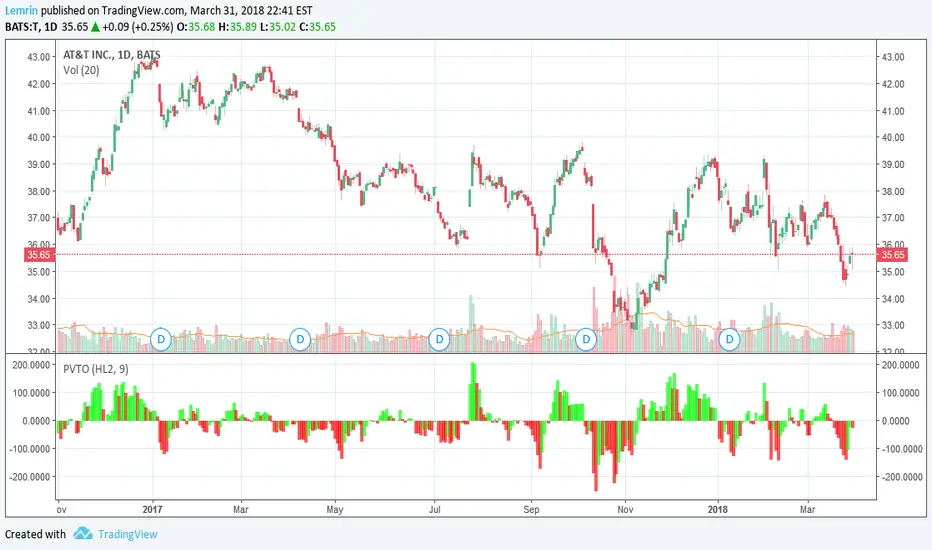
Pvt

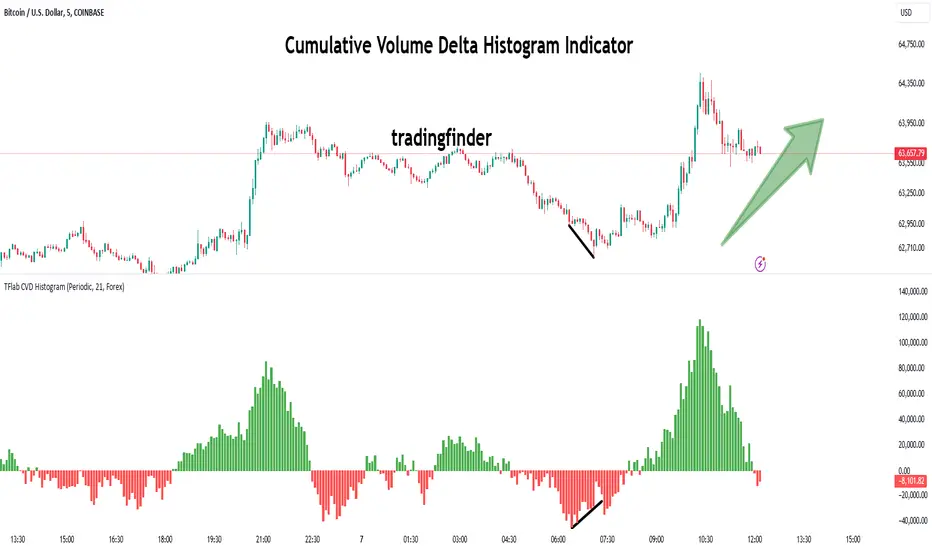
Cumulative Volume Delta Histogram [TradingFinder] CVD Histogram🔵 Introduction
To fully understand Cumulative Volume Delta (CVD), it’s important to start by explaining Volume Delta. In trading, "Delta" refers to the difference between two values or the rate of change between two data points. Volume Delta represents the difference between buying and selling pressure for each candlestick on a chart, and this difference can vary across different time frames.
A positive delta indicates that buying volume exceeds selling volume, while a negative delta shows that selling pressure is stronger. When buying and selling volumes are equal, the volume delta equals zero.
The Cumulative Volume Delta (CVD) indicator tracks the cumulative difference between buying and selling volumes over time, helping traders analyze market dynamics and identify reliable trading signals through CVD divergences.
🔵 How to Use
Cumulative Volume Delta (CVD) is an essential technical analysis tool that aggregates delta values for each candlestick, creating a comprehensive indicator. This helps traders evaluate overall buying and selling pressure over market swings.
Unlike standard Volume Delta, which compares the delta on a candle-by-candle basis, CVD provides a broader view of buying and selling pressure during market trends. A downward-trending CVD suggests that selling pressure is dominant, which is typically a bearish signal.
Conversely, an upward-trending CVD indicates bullish sentiment, suggesting buyers are in control. This analysis becomes even more valuable when compared with price action and market structure, helping traders predict the direction of asset prices.
🟣 How to Use CVD in Trend Analysis and Market Reversals
Understanding how to detect trend changes using Cumulative Volume Delta is crucial for traders. Typically, CVD aligns with market structure, moving in the same direction as price trends.
However, divergences between CVD and price movements or signs of volume exhaustion can be powerful indicators of potential market reversals. Recognizing these patterns helps traders make more informed decisions and improve their trading strategies.
🟣 How to Spot Trend Exhaustion with CVD
CVD is particularly effective for identifying trend exhaustion in the market. For instance, if an asset's price hits a new low, but CVD doesn’t follow, this might indicate a lack of seller interest, signaling potential exhaustion and a possible reversal.
Similarly, if an asset reaches a new high but CVD fails to follow, it can suggest that buyers lack the strength to push the market higher, indicating a possible reversal to the downside.
🟣 How to Use CVD Divergence in Price Trend Analysis
Another effective use of CVD is identifying divergences in price trends. For example, if CVD breaks a previous high or low while the price remains stable, this divergence may indicate that buying or selling pressure is being absorbed.
For instance, if CVD rises sharply without a corresponding increase in asset prices, it may suggest that sellers are absorbing the buying pressure, which could lead to a strong sell-off. Conversely, if prices remain stable while CVD declines, it may indicate that buyers are absorbing selling pressure, likely leading to a price increase once the selling subsides.
🟣 CVD Display, Candlestick vs. Histogram – What’s the Difference?
CVD can be displayed in two different formats :
Candlestick Display : In this format, the data is shown as green and red candlesticks, each representing the difference in buying and selling pressure over a given time period. This display allows traders to visually analyze market pressure along with price changes.
Histogram Display : Here, the data is represented as vertical green and red bars, where each bar’s height corresponds to the volume delta. This format offers a clearer view of the strengths and weaknesses in market buying and selling pressure.
🟣 What are the Key Settings for CVD?
Cumulative Mode : CVD offers three modes: "Total," "Periodic," and "EMA." In "Total" mode, CVD accumulates the delta from the beginning to the end of the session. In "Periodic" mode, it accumulates volume periodically, resetting at specific intervals. In "EMA" mode, the CVD is smoothed using an Exponential Moving Average (EMA) to filter out short-term fluctuations.
Period : The "Period" setting allows you to define the number of bars or intervals for "Periodic" and "EMA" modes. A shorter period captures more short-term movements, while a longer period smooths out the fluctuations and provides a broader view of market trends.
Market Ultra Data : This feature integrates data from 26 major brokers into the volume calculations, providing more reliable volume data. It’s important to specify the type of market you are analyzing (Forex, crypto, etc.) as different brokers contribute to different markets. Enabling this setting ensures the highest accuracy in volume analysis.
🔵 Conclusion
Cumulative Volume Delta (CVD) is a powerful technical indicator that helps traders assess buying and selling pressure by aggregating the delta values of each candlestick. Whether displayed as candlesticks or histograms, CVD provides insights into market trends, helping traders make informed decisions.
CVD is particularly useful in identifying divergences and exhaustion in market trends. For example, if CVD does not align with price movements, it can signal a potential trend reversal. Traders use this tool to fine-tune their entry and exit points and better predict future market movements.
In summary, CVD is a versatile tool for analyzing volume data and understanding the balance of buying and selling pressure in the market, making it an invaluable asset in any trader’s toolkit
All TimeFrame OscillatorsI have always fighted to understand the market direction because it looks different on different timeframes.
I wanted an indicator where I can see all the different timeframes at once.
This indicator shows already existing oscillators but not only in the current chart's timeframe, but all the most important higer timeframes at once.
I have started with the stoch, then added as many oscillators as I could.
Experimenting with this I have saw that confluence of 4H 1D and 1W Stoch can be very interesting and can highlight higher timeframe take profit areas and sometimes major tops/bottoms.
Also bounces can be interesting when a lower timeframe stoch is bounced or rejected from a higher one.
Oscillators:
Stoch - Stochastic Oscillator
SMI - Stochastic Momentum Index
Rsi - Relative Strength Index
StochRsi - Stochastic RSI
WaveTrend - Vumanchu alias Market Cypher Wave Trend line
CCI - Commodity Channel Index
CCIStoch - Stochastic CCI
Williams Percent Range - Williams %R
Norm. MACD - Normalized Moving Average Convergence Divergence
Norm. MACD Hist - Normalized MACD Histogramm
PVT - Normalized Price Volume Trend
MFI - Money Flow Index
CMF - Chaikin Money Flow
Chande Momentum - Chande Momentum
Volume - Normalized Volume
CandleValue - Vumanchu alias Market Cypher MoneyFlow
BBWP - Bollinger Band Width Percentile
Line Type
Smooth: lines are smoothed, but the actualy not closed values are not shown
Step: Step lines, the actually open timeframes are calculated as they closed at the current values
Plot Oscillator or it's Slope:
its possible to not plot the oscillator but it's slope
Print dots when:
Cross Up/Down oversold/overbougt level - best for most oscillators. for example when Stoch crosses above 20 or below 80
Cross os/ob and the one higher TF is about to cross - when it's crosses beolw 80 and the higher timeframe oscillator is still above ans sloping down
Cross above/below middle line - for example on RSI being above or below 50 can be interesting
Print triangles when:
All Slope Match - all visible timeframe lines are pointing up or down at the same time
All above/belove middle line - all visible lines are above or belove the middle line
All above/belove middle line and slope match - like the previous one and the slope direction is the same
All above/below oversold/overbougt - all lines are above or below os/ ob. this is the default. it can be a very important confluence
Lower TF in order - 5, 15, 30, 60 minute timeframes are in order.
Higher TF in order - 4H 1D 1W in order (like 4H above 1D abd 1D above 1W). can be interesting at RSI
4H-1D in order - 4H 1D in order .
Print triangles
Print all triangles - print all triangles when the condition is met
Print only first triangles - only show when the condition starts to met
Print only last triangles - small triangles when the condition met first, large when last. tis is the default.
Timeframes to show:
You can turn on/off different timeframs to show or not from the list below:
1m 5m 15m 30m 1H 4H D 5D W M
This is for experimenting/ understanding the market direction on multiple timeframes at once.
Don't take it's signals (and any other indicator's) as exact trade signals. use it as confirmation instead.
Any comments, insights, ideas are welcome.

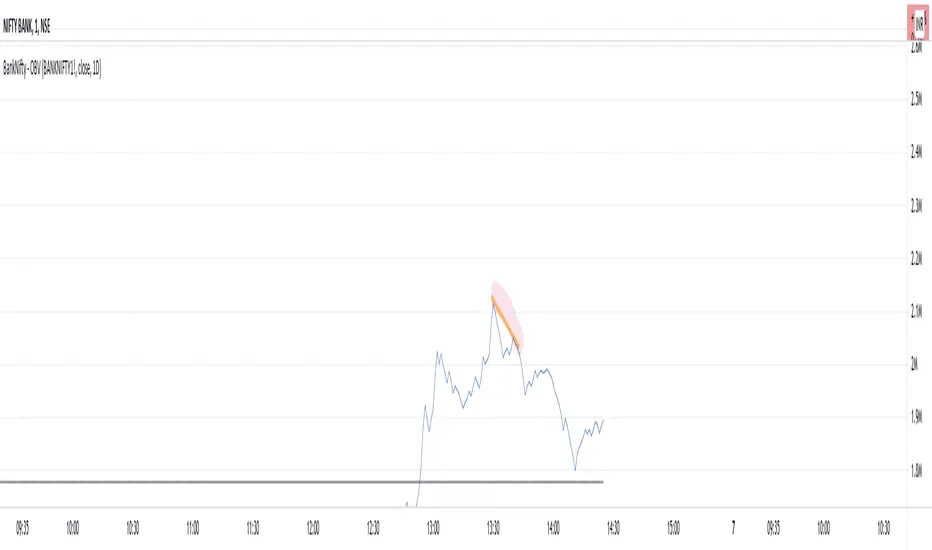
BankNifty - OBVThis script tries to draw OBV for BankNifty using Futures Volume along with Average OBV. For Nifty50 just change the Futures Volume symbol in settings. Look at devations in Price vs OBV or Average OBV breakout.
NSE:NIFTY
NSE:BANKNIFTY
+ Breadth & Volumenote* If you've used my "+ Rate of Change Indicator", I am updating that without the OBV, which has been moved here. Just an FYI.
This "indicator" is basically a variety of indicators that measure volume, or accumulation/distribution. There's a bit of a story about how this came about but
it's not that interesting, so I'll spare you.
Indicators from which you may choose here are On Balance Volume (OBV), Money Flow Index (MFI), Chaikin Money Flow (CMF), Chaikin Oscillator, and Positive & Negative Net Volume.
I'll give a brief overview of these below, and if you want to educate yourself further on them you may. There are many web resources for that.
Most people are probably familiar with OBV. It's one of the more commonly used volume indicators, especially in the crypto crowd (at least amongst those traders I follow). It's basically a cumulative (doesn't oscillate around a midpoint) momentum indicator that measures volume of the current period versus volume of the previous period and adds it if price closed higher, but subtracts it if price closes lower. It's another way of using volume to confirm trend.
The MFI is a momentum indicator that measures the flow of money into and out of an asset over some period of time (user input). It's calculated using the RSI, so it can be used similarly to RSI (divergences, overbought, oversold, etc.), but of course unlike the RSI it's calculated primarily using volume and comparing the most recent candle close to the previous one (similar to OBV).
CMF is a volume-weighted average of accumulation and distribution over a some period of time (typically 21). It's a way of measuring accumulation versus
distribution in an asset, and oscillates around a zero line. You would use it similarly to any other oscillator, in that you can look for divergences, and general positive or negative momentum.
Chaikin Oscillator is basically a MACD (without signal line) of the accumulation and distribution index (or line--which is somehow different than simply accumulation and distribution). I haven't looked into these differences deeply, but if you look below at the calculations, and substituted 'ad' for 'accdist' you get very different readings. I actually did that, and what it looks like it would do is turn the actual Oscillator into a MACD signal line. So, by substituting 'ad' for 'accdist' (or the accumulation/distribution index) you produce a signal line of the Chaikin Oscillator.
Anyway, all that confusion out of the way, as I said, it's a MACD on the accumulation and distribution index, therefore it is another zero line oscillator, and similarly to CMF, it's a way of measuring price movements in the chart versus a/d. The zero line isn't just any old zero line, however, it is actually the accumulation distribution line. I've made an OBV version of this by substituting the OBV for AD, so if you prefer OBV maybe you will like that.
Pos. & Neg Net Volume is actually an indicator I had seen made by RafaelZioni. It basically takes net volume, calculates a cumulative of that, then subtracts a moving average of some period from the cumulative net volume in order to create a volume oscillator. Use it like the other oscillators!
Added Donchian Channels, moving averages, Bollinger Bands, colored everything, and alerts.
Enjoy!
Below I will post images with the different indicators, everything on default settings (except for lookback period, which I have adjusted to my personal preferences).
Above is an image with the MFI being compared to the RSI since they are very similar (MFI being basically a volume derivative of the RSI).
Chaikin Money Flow set to lookback of 13. You could probably extend that a bit if you wanted to smooth the line more.
Chaikin Oscillator and Chaikin Oscillator of OBV, with a zoomed in look below, to see the differences more clearly.
CO and COBV closer look.
Positive & Negative Net Volume.

Volume Price Trend with Divergence and Pivot Points The volume price trend indicator is used to determine the balance between a security’s demand and supply. The percentage change in the share price trend shows the relative supply or demand of a particular security, while volume indicates the force behind the trend. The VPT indicator is similar to the on-balance volume (OBV) indicator in that it measures cumulative volume and provides traders with information about a security’s money flow.
This is Volume Price Trend or VPT recalculated to be an Oscillator, a Divergence hunter was added, also Pivot Points and Alerts.
VPT is considered a "leading indicator" - in contrast to a "lagging indicator" just as Moving Averages it does not show a confirmation what already happened, but it shows what can happen in the future. For example: The chart is climbing while the VPT oscillator is slowly declining, gets weaker and weaker, maybe even prints bearish divergences? That means that a reversal might be occurring soon. Leading indicators are best paired with Stop and Resistance Lines, general Trendlines , Fib Retracements etc...Your chart is approaching a very important Resistance Trendline but the VPT shows a very positive signal? That means there is a high probability that the Resistance is going to be pushed though and becomes Support in the future.
What are those circles?
-These are Divergences. Red for Regular-Bearish. Orange for Hidden-Bearish. Green for Regular-Bullish. Aqua for Hidden-Bullish.
What are those triangles?
- These are Pivots . They show when the VPT oscillator might reverse, this is important to know because many times the price action follows this move.
Please keep in mind that this indicator is a tool and not a strategy, do not blindly trade signals, do your own research first! Use this indicator in conjunction with other indicators to get multiple confirmations.

PVT RSIPrice Volume Trend based RSI with SMA smoothing. I personally prefer smoothed RSI's to get rid of noise.

Price Volume Trend + Signal and HistogramThis is a script based on PVT + Signal Line, which can be EMA or SMA. It then plots a histogram which is equal to PVT - Signal. This makes it easier to spot divergences.
To better match up the scales, we decided to add a multiplication factor to the histogram. Each asset and even timeframe requires a different multiplication factor, so please experiment to find what suits you.
Credits and special thanks are listed on the source code.

Cumulative Volume OscillatorCVO: Cumulative Volume Oscillator allows you to choose between 3 types of oscillators based on volume indicators:
-OBV (On Balance Volume)
-CVD (Cumulative Volume Delta)
-PVT (Price Volume Trend)
Being a volume based oscillator this indicator allows for the detection of divergences between price action and volume, ideal for predicting reversals.
As an oscillator you can choose the length of the fast & slow EMAs, and a signal line is provided for trend following.

Pure Volume Divergence [NeoButane]PVD: MACD with volume as source.
Options to configure:
OBV, PVT, or MFI as source
Display PVD or a faux zero-based oscillating CVD

Volume Zone Oscillator [xdecow]Volume Zone Oscillator (VZO) is an indicator that presents a different way of looking at OBV.
VZO is a difference (delta) between OBV and an exponential moving average.
The EMA becomes the baseline 0.
And in this way we can observe the strength of the movements, overbought and oversold (when the OBV is far from the average) and divergences.

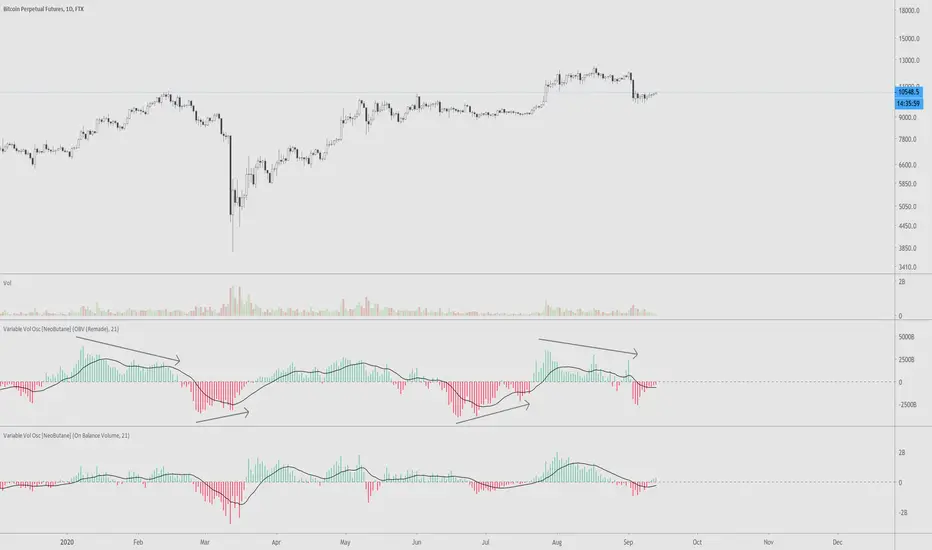
VVOscillator [nb]Multiple volume oscillators in one.
Description:
As Warren Guppet once said, be “fearful when others are buying less, and greedy when others are selling less.”
Divergences are the main point of usage of all bundled indicators.
OBV Oscillator, remade. The formula has been changed to smooth out the way OBV is calculated during a trending move
OBV Oscillator, original OBV formula.
Price Volume Trend Oscillator. Similar to OBV, except price is taken into account as well.
Price Volume Trend Oscillator, log.
Accumulation/Distribution. (close - low) - (high - close) / (high - low), then multiplied by volume
Chaikin Money Flow . Very similar to accum/dist except it was already made into an oscillator.
OBV just by itself. Change style to line for easier interpretation.
Experimental function that utilizes a part of CCI
This is the unedited "Variable Volume Oscillator v1" released for free use. In the time since I've created it, I've realized it's something I'd like to share because I like it and hope you will too.
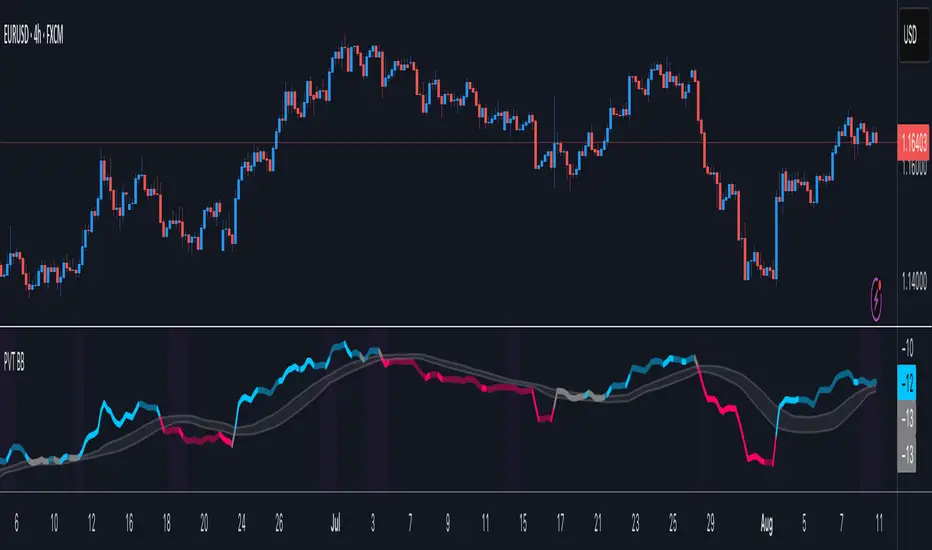
Price Volume Trend BBHey guys,
Ive been thinking about Price Volume Trend for a while and tried adding different moving averages to it, but seems its not as binary.
Therefore adding the bollinger bands as a no-trade-zone made it alot better. Indicator is pretty basic at the moment since I just implemented the idea but im planning to do some add-ons later on to make it easier to read.
Will keep you updated!

PVT OscillatorThis is the non-accumulating portion of the price-volume trend (PVT)--the amount by which PVT would change each bar--which I have turned into a zero-centered oscillator. The plot is a 9-day EMA of the PVT change, multiplied by 1000 for readability, with lime/red corresponding to whether the actual PVT increased or decreased for that bar.
As always, the length of this moving average is adjustable, as is the source of price(s) to use--open, close, high, low, HL2, HLC3, or OHLC4.