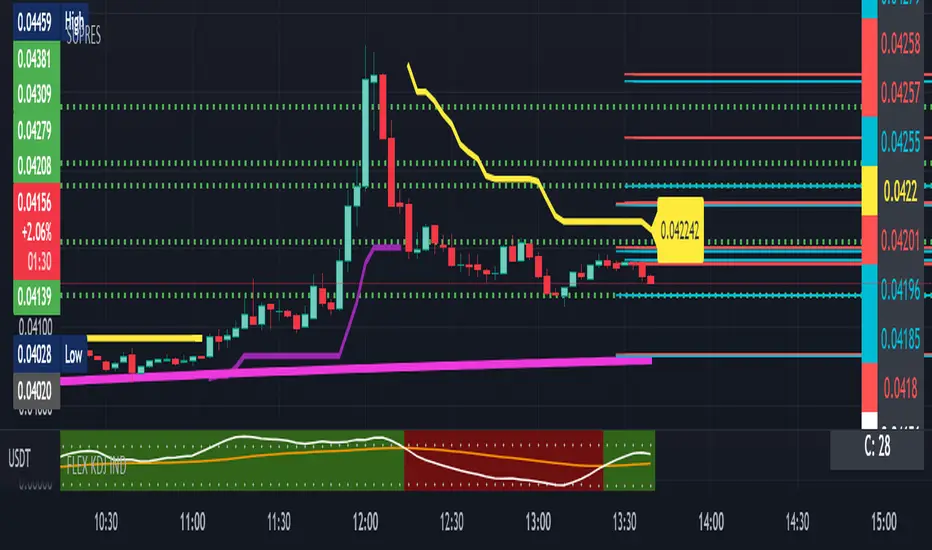
SUPRESHi Dears!
I hope that you enjoyed my "FLEX KDJ IND" till today!
Here, I want to publish one of my other golden indicators for you!
Contents:
+ SUPRES
+ SUPERTREND
+ T.O Line
- SUPRES (SUPPORT/RESISTANCE) is sensitive to trading volumes and with "BACHWARD" you can adjust the length of previous indices in investigation and "MEMORY" is an argument for calling maximum lines that have to be kept for "SUPPORT" and "RESIST".
- SUPERTREND is the normal prepared indicator which is defined in "TRADING VIEW"
-T.O is my suggestion instead of "EMA" to check the phase of session.
I hope that you enjoy this Indicator, please do not forgot to "Warm-It-UP"!
Happy trading,
Shakib
Resistence
SR StrengthThis indicator measures the strength of support and resistance. Purple bars show SR is increasing. Blue bars show SR strength is decreasing. White bars show the peak of SR strength. The threshold of the white bars can be adjusted in the settings. These extremes happen before a boom. This indicator is also very useful for picking up reversals. Sensitivity can be adjusted to 20 or 50 to find smaller booms and pushed all the way to 1000 or more to find stronger booms.
Next Gen Auto S/RThis indicator will automatically plot support and resistance levels and will also allow you to overlay multi time frame support and resistance on any time frame that you are currently conducting analysis on. In addition you can also set alerts when a support and resistance level is tested, fine tune how many levels you would like to view on your charts, option to input how many candlesticks minimum you would like between support and resistance levels. You can also select breakout mode which will turn old support into resistance by a colour change and turn old resistance into support. NEW you can now use extended levels and change your zones into lines.

Trendlines Boll Ichi S1 by GammaprodI. How to use this indicator :
------------------------------
I.1. Set your teadingview theme to dark theme.
I.2. Gammaprod indicator is valid for forex, stock and but more valid for crypto.
I.3. Use three timeframe for more validation (choose between those, that fit to your trading style) :
- Timeframe 1m, 5m, and 15m for Scalping
- Timeframe 30m, 1h and 4h for Intraday
- Timeframe 4h, 1D and 1W for Swing Trading
I.4 Always use THREE INDICATORS FROM GAMMAPROD, those three indicators is back to back each other, by the way, I only made those three indicators only (for now) :
- Trendlines Boll Ichi S1 by Gammaprod
- MACD Volume S2 by Gammaprod
- Stoch RSI Divs Zone S2 by Gammaprod
============================================================================
II. How to setting :
--------------------
II.1. Trendlines Boll Ichi Crypto by Gammaprod
II.1.A. Support and Resistance
- Well if you familiar with this indicator you can add it, but recommended for Timeframe 30m or more
II.1.B. Trendlines Primary or Trendlines Secondary
- Timeframe 1m you DON'T NEED Trendlines Primary or Trendlines Secondary
- Timeframe 5m you DON'T NEED Trendlines Secondary, but you CAN ADD Trendlines Primary if you fell it helpful (for me, it is helpful to find where the candles start or the end trend or a consolidation or where the candles will surpass a resistance or a support).
- Timeframe 15m you DON'T NEED Trendlines Secondary, DEFENITELY add Trendlines Primary it will help to find where the candles stop or a consolidation or where the candles will surpass a resistance or a support).
- Timeframe 30m or more, DEFENITELY NEED BOTH Trendlines Primary and Secondary Trendlines, it will help to find where the candle stop or consolidation or where the candle will surpass a resistance or support).
II.1.C. Bollinger, Ichimoku Cloud and Lagging Span
- Please DON'T CHANGE IT at all, it's really helpful to know when and where to make an entry decesion or a trend or a consolidation, if you don't understand how to read it, you better to learn it first (on "how to read" section and "How to OPEN position" the section below)
II.2. Stoch RSI Divs Zone Crypto by Gammaprod (DON'T CHANGE IT)
II.3. MACD Volume Crypto by Gammaprod (DON'T CHANGE IT)
============================================================================
III. How to read :
------------------
III.1. Sell or Buy Priority :
III.1.A. Sell Priority
- Color background on macd and stoch rsi is pink or purple sell is the priority, (if you're not sure to buy, just wait until the best moment to sell)
III.1.B. Buy Priority
- Color background on macd and stoch rsi Teal or light green buy is the priority, (if you're not sure to sell, just wait until the best moment to buy)
III.1.C. Indecision / Golden Moment
- Color background on stoch rsi yellow is indecision / golden moment of reversal pattern (wait until it formed background only on Stoch RSI), please be careful at this moment.
III.2. Trend / Consolidation :
III.2.A. BULLISH trend
- When Stoch RSI and MACD have teal or light green background that's means BULLISH trend, better to confirm by the candle is above green cloud and lagging span (red line) is also above the candle.
III.2.B. BEARISH trend
- When Stoch RSI and MACD have the Pink or purple background that's means BEARISH trend, better to confirm by the candle is above purple cloud and lagging span (red line) is also below the candle.
III.2.C. CONSOLIDATION
- When Stoch RSI have the mix background that's means CONSOLIDATION, better to confirm by the candle is in or near to green / purple cloud and lagging span (red line) is also on the candle.
III.3. Special Mark
III.3.A. Ideal Bullish :
- Near line 20 and green / teal background = When Stoch RSI have the char R / H on lime color label, that's means divergence or hidden divergence for buy position, if you not see this label that's means just a standard confirmation for buy
III.3.B. Not an Ideal Bullish :
- Near line 80 and green / teal background = if this happens make sure you know what happen, it could be a false signal or bullish continual pattern
III.3.C. Ideal Bearish :
- Near line 80 and pink / purple background = When Stoch RSI have the char R / H on lime color label, that's means divergence or hidden divergence for buy position, if you not see this label that's means just a standard confirmation for sell position.
III.3.D. Not an Ideal Bearish:
- Near line 20 and pink / purple background = if this happens make sure you know what happen, it could be a false signal or bearish continual pattern
III.3.E. The Beginning of Reversal (from BEARISH to BULLISH) :
- When Stoch RSI line shaping GREEN position is near 20.
- MACD lines still PINK, position lines is UNDER the HISTOGRAM, but the HISTOGRAM start to SHAPE FALL PINK (light pink) and the BACKGROUND still PINK / PURPLE.
- Position CANDLES NEAR BLUE line, NEAR PURPLE CLOUD, and lagging span (red line) STILL ON the area candle. (it used to be confirmed with the golden moment).
III.3.F. The Beginning of Reversal (from BULLISH to BEARISH) :
- When Stoch RSI line shaping PINK position is near 80.
- MACD lines still GREEN, position lines is ABOVE the HISTOGRAM, but the HISTOGRAM start to SHAPE FALL GREEN (light green) and the BACKGROUND still TEAL / GREEN.
- Position CANDLES NEAR WHITE line, NEAR TEAL CLOUD, and lagging span (red line) STILL ON the area candle. (it used to be confirmed with the golden moment).
III.3.G. False Signals, or It could be a Golden Moment (better to see it on TF 15 or bigger):
- Near line 20 or 80 and yellow background = When Stoch RSI have the char R / H on color label, that's means divergence or hidden divergence for buy / sell position, if you not see this label that's means just a standard confirmation for buy / sell depends on where the Stoch RSI line if near 20 that's means buy, near 80 means sell
============================================================================
IV. How to OPEN position:
-------------------------
IV.1. Bullish
IV.1.A. Trendlines Boll Ichi S1 by Gammaprod
- The candles above the green cloud.
- Lagging span (red line) above the candles.
- then open buy near yellow line (the first option) / blue line (the second option) (always confirm the position with two other indicators below).
IV.1.B. MACD Volume S2 by Gammaprod
- Teal or Green background.
- The lines is shaped or shaping green.
- Better if at the green histogram.
IV.1.C. Stoch RSI Divs Zone S3 by Gammaprod
- Teal or Green background.
- The lines is shaping green.
- Better if on the bottom (at a range 20).
IV.2. Bearish
IV.2.A. Trendlines Boll Ichi S1 by Gammaprod
- The candles below the purple cloud.
- Lagging span (red line) below the candles.
- then open buy near yellow line (the first option) / white line (the second option) (always confirm the position with two other indicators below).
IV.2.B. MACD Volume S2 by Gammaprod
- Pink or purple background.
- The lines are shaped or shaping green.
- Better if at the pink histogram.
IV.2.C. Stoch RSI Divs Zone S3 by Gammaprod
- Pink or purple background.
- The lines are shaping pink.
- Better if the line on the top (at a range 80).
IV.3. Consolidation
IV.3.A. Trendlines Boll Ichi S1 by Gammaprod
- The candles on the cloud (green or purple).
- Lagging span (red line) on the candles.
- then open buy near the white or blue line (always confirm the position with two other indicators below).
IV.3.B. MACD Volume S2 by Gammaprod
- Changing the background.
- The line is near the middle line.
- Have small Histogram.
IV.3.C. Stoch RSI Divs Zone S3 by Gammaprod
- Mix background specially on a timeframe 15m or more.
- The line move fast up and down.
- Better if on the bottom or the top of the lines (at a range 20 or 80).
============================================================================
>> The secret ingredient is comparing the timeframe :
The example scalping (Timeframe 1m, 5m and 15m)
- TF 1m is for making an open position.
- TF 5m is for making a judgement of the trend market.
- TF 15m is to confirm that judgement from TF 5m, be careful if it not similar then it used to be a consolidation or the beginning of the reversal.
There's a lot a way to open the position than above information that i gave it to you, but consider there are a limit chars on this column, I hope it will help your trading and make a more profit on it.

Disclosure of 'MACD-Total' indicator (MACD-T)hello?
Traders, welcome.
If you "follow", you can always get new information quickly.
Please also click "Like".
Have a good day.
-------------------------------------
A trend indicator has been added to the previously published MACD-Price indicator.
The added MS-Signal indicator is an indicator for viewing the trend and the strength of the trend.
Trading with a trend line is not easy.
Therefore, various MA lines or slanted lines drawn on the chart are used to see the flow of the chart.
Therefore, it is not recommended to trade with the added MS-Signal indicator as support and resistance points.
A trade requires support and resistance points.
To mark support and resistance points, you need a point or section on the horizontal line.
Therefore, it is necessary to utilize the 'Buy/Sell' indicator corresponding to the previously disclosed MACD-Price indicator.
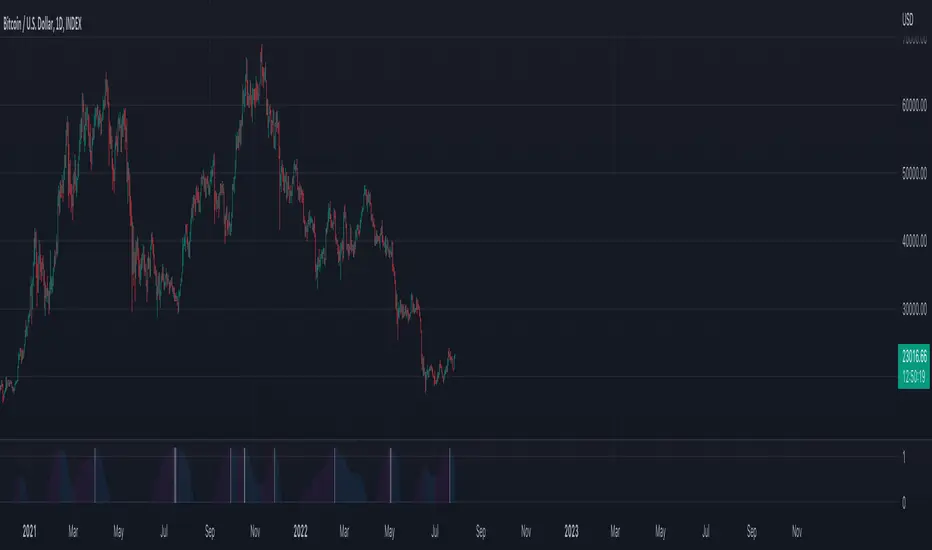
(1W chart)
The long horizontal point of the 'Buy/Sell' indicator serves as support and resistance.
It is possible to check in which section the trend reversal has changed by displaying the MS-Signal indicator.
(1D chart)
A move has emerged to show a reversal of the trend by breaking above the MS-Signal indicator.
Therefore, the MS-Signal indicator is about to change from a downtrend to an uptrend.
I numbered the horizontal line of the 'Buy/Sell' indicator.
The length is different in the order of No. 2 > No. 1 > No. 3.
Since horizontal line 2 is the longest, it indicates that support and resistance play the greatest role.
If you check the support at the first horizontal point, it can be interpreted that there is a high possibility of receiving resistance at the second horizontal point.
However, if you find support at the 2nd horizontal point, you can see that it will go up significantly with 3rd position.
Trading with indicators allows you to make quick choices and decisions.
However, more important than the use of indicators is your own trading strategy.
in other words,
- How much investment will you proceed with the purchase?
- How to proceed with installment purchases
- At what point will the Stop Loss be done?
- How long will the investment period be?
- Is it a long-term investment or a short-term investment?
As listed above, the most important trading strategy for trading should be established.
When conducting a trade, ignoring the above list and thinking about where to buy and where to sell is like sailing in the dark.
We disclose the indicators in the hope that it will become a faster and more objective indicator for trading with the trading strategy you have established.
thank you
------------------------------------------------------------ -----------------------------------------------------

Resistance/Support Indicator - FontiramisuIndicator showing resistances and support, based on pivots location
When a new pivot location is near from a resistance/support the latter gains weight.
You can modify multiple parameters :
Nb Max res/sup : Define the number max res/sup to keep in our res/sup history array. The greater it is the older bar index will be taken.
Nb show res/sup : Define the number of res/sup to be drawn.
Min weight shown : Define min res/sup weight to be shown. Weight is used to measure strengh of res/sup.
% range stack : Define price percentage change required to stack a pivot into an existing res/sup. Default is 0.015 = 1.5%.
Pivots are calculated with deviation parameter to validate with more precision.
Fontilab Library is used to code this indicator.

ATR and IV Volatility TableThis is a volatility tool designed to get the daily bottom and top values calculated using a daily ATR and IV values.
ATR values can be calculated directly, however for IV I recommend to take the values from external sources for the asset that you want to trade.
Regarding of the usage, I always recommend to go at the end of the previous close day of the candle(with replay function) or beginning of the daily open candle and get the expected values for movements.
For example for 26April for SPX, we have an ATR of 77 points and the close of the candle was 4296.
So based on ATR for 27 April our TOP is going to be 4296 + 77 , while our BOT is going to be 4296-77
At the same time lets assume the IV for today is going to be around 25% -> this is translated to 25 / (sqrt (252)) = 1.57 aprox
So based on IV our TOP is going to be 4296 + 4296 * 0.0157 , while our BOT is going to be 4296 - 4296 * 0.0157
I found out from my calculations that 80-85% of the times these bot and top points act as an amazing support and resistence points for day trading, so I fully recommend you to start including them into your analysis.
If you have any questions let me know !

Donchian Channels ModDONCHIAN FIBONACCI MODD VERSION
This indicator is based on a Donchian Channel with Fibonacci zones based on high and lows of certain period . As one can see it clearly identifies the trend and it only turns aqua when its above a spefic fib level and turns red when below specfic fib level , this help traders by not talking long or short position while its in no trade zone when the candle turns gray .This works on ALL TIMEFRAME & ANY SEGMENT
Aqua candle= Super Bullish
Red candle= Super Bearish
Gray Candle= NO TRADE ZONE (can take long or short in retracement coz the stop loss will be minimum )
Long condition = When the candle turns lime one can place the SL at the Low of the band and keep trailing , at time the trend is still long and candle turns gray one can re entry long just at support and place the SL just below the band .
Short condition = When the candle turns red one can place the SL at the High of the band and keep trailing, at time the trend is still short and candle turns gray one can re entry short just at the resistance and place the SL just below the band .
Hope this be helpful for my trading view family !
God Bless !

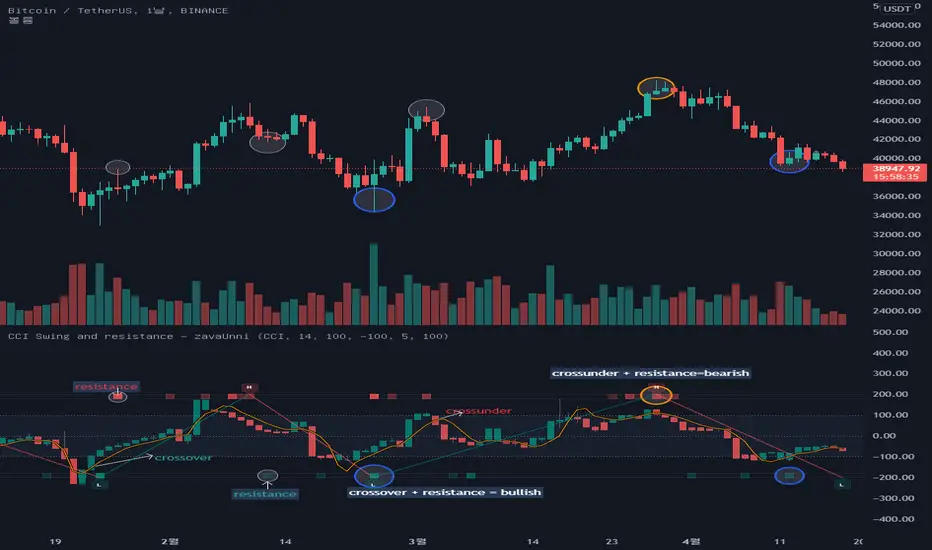
CCI Swing and resistance [zavaUnni] The candles you see on this indicator is the value open price, closing price, high, and low is converted to a selected index value.
Select from selectable settings: rsi , cci , mfi , or stochstic
The default indicator is set to cci .
O_ = ta. cci (open,i_length)
H_ = ta. cci (high,i_length)
L_ = ta. cci (low,i_length)
C_ = ta. cci (close,i_length)
Like the close, open, high, low price, the MA value is converted to the selected index and displayed as a yellow line
short_A = ta. sma (close, short_lenA)
short = ta. cci (short_A,i_length2)
The MA length can be converted from the set value and is defaulted to 5 days.
If C_ is above short, it looks like a teal color, and if C_ is below, it looks like a red color.
-High and low -
When the selected index reaches the oversold value, it finds a high value, and when it reaches the oversold value, it finds a low value.
Oversold and overbought values can be changed in the setting, and the default setting is 100 and -100.
The default setting is recommended unless otherwise noted.
The method of finding the low value is to find the lowest value (var) when the index crosses from 100 to reach -100, until it rises to 100.
The same is true of finding high values.
It was marked with a teal color when going from oversold to oversold, and red color when going down from oversold to oversold.
-os, ob and resistances-
The bar at the top and bottom of the index shows resistance, over-buying, and over-selling values
Over-buying and over-selling values are hidden, so you can change them to be seen if necessary.
1. The volume is large, but if the change rate of candlestic(spred_rate) is not large, resistance has occurred.
2. If thespred_rate is excessively large compared to the volume , oversold or oversold occurs.
Based on the above two basic theories, we created the following formula to derive the strength of the resistance.
Resistance Index = spred_rate / volume
We find the average value of the resistance Index,
If the spred_rate is higher than the predicted value, it is oversold or oversold.
If the spred_rate value is lower than the predicted value, the resistance was derived as the issuance signal.
The larger the deviation from the predicted value, the higher the saturation.
The presence of bright red can be seen as a result of greater resistance.
The same goes for over-buying and over-selling prices
The brighter the gray, the more spread without trading volume , and it can be judged that it is not a true bull or a true bear.
resistances and divergence[zavaUnni]
Select from selectable settings: rsi, cci, mfi, or stochstic
The default indicator is set to cci.
When you select an indicator in Settings, you can see the diversity that occurs in that indicator.
Resistance fills the histogram in yellow; the stronger the resistance, the higher the saturation.
If the volume is large but the change rate of candlestic(spred_rate) is not large, it means resistance has occurred.
It is a method of finding anomalies in the spred_rate and volume relationship.
After obtaining the accumulated spred_raterelative to the accumulatedvolume value,
we calculated that the larger the difference is, the larger the resistance value.
The formula with the resistanc
a_sma = ta.cum(spred_rate)/ta.cum(volume)
ifpricebull = open+(open*a_sma * volume)
ifpricebear = open-(open*a_sma * volume)
bullD = close>ifpricebull or closeifpricebull or close

PercentagefromEMAEMA (Exponential moving average) often acts as dynamic support and resistance and trend detector and the further price is away from ema the more it has chance to reverse, hence percentage levels gives a range to exit your trades.
*choose your favourite timeframe and EMA length , alter percentages as you wish to generate Take profit levels
thank you..
Happy Trading.

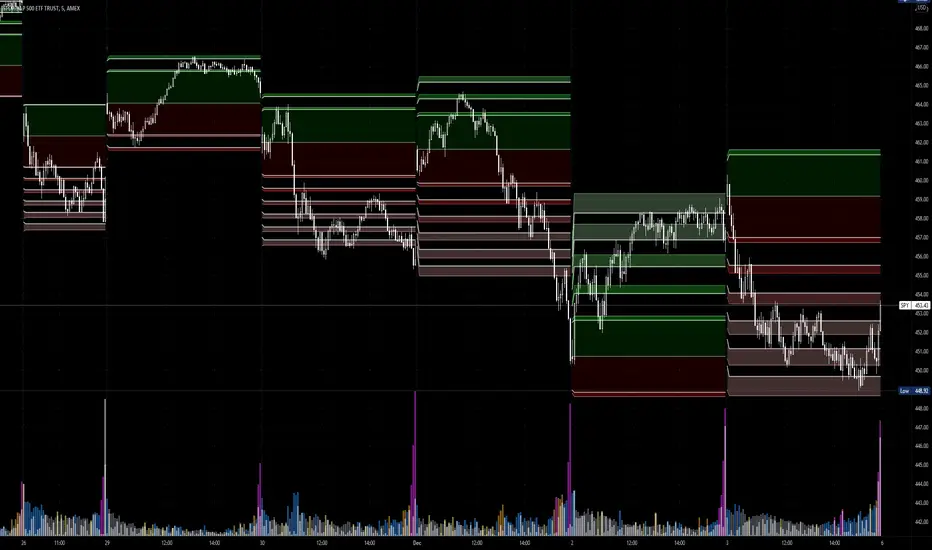
MTF S/R + PVSRAA simple tool to find Support and Resistance.
List of features:
-MTF Support and Resistance
-VWAP
-PVSRA Candles
Usage instructions:
There are 4 boxes, each individual box can be assigned a separate time. The lookback period setting is used to specify the number of candles that you want to look back.
The highesthigh and the lowestlow are now displayed as the support and resistance line of the respective lookback period.
In addition to the support and resistance lines, fibonacci levels are calculated from top to bottom (resistance) and from bottom to top (support). These levels can be switched on and off using the "Fibb Level" button.
PVSRA candle colors meaning:
Green (bull) and red (bear): Candles with volume >= 200% of the average volume of the 10 previous chart candles, and candles where the product of candle spread x candle volume is >= the highest for the 10 previous chart time candles.
Blue (bull) and blue-violet (bear): Candles with volume >= 150% of the average volume of the 10 previous chart candles
The PVSRA can be turned on and off using the "Vector Candle" button.
PVSRA "vector"/"climax" candles
example for the Fibb LvL

Chart Map[netguard] V1.0Chart map is a indicator that shows best levels of price.
on this indicator we divided ATH and ATL of chart to 16/32 levels that each one of them can control price and candles.
furthermore you can use weekly or daily map in this indicator.in weekly map we divide High to Low of last week candle to 8 levels that these levels can control candles too.
In general, these levels act as strong support and resistance.
you can trade on these levels with candle patterns.

Support and ResistanceOur Indicator “Support and Resistance” offers an insight into the structure of any given Instrument applied to. Understanding Support and Resistance is essential for using this Indicator. If you are familiar with the concept, then you will most likely find this indicator useful in your trading. If you are unfamiliar with the concept and are interested then continue reading a “Brief Concept of Support and Resistance” at the end of the description, where we will provide some informational Links.
This description will provide a High Level description of how our Indicator identifies and visualizes Support and Resistance, followed by how to use the Indicator in your trading. At the end we would like to introduce our team and experience.
High Level Description of “Support and Resistance”:
Our indicator searches for prices where the current Instrument has experienced a significant pivot point in the recent relative past. Our indicator identifies relevant Highs and Lows, and clusters theses pivots into levels.
Visualization:
What do the Lines mean:
Our Indicator visualizes Support and Resistance Levels with a dash Line. All the Support and Resistance displayed is a snapshot of the current Levels Identified. As price evolves the Support and Resistance levels evolve.
Important:
All Zones will REPAINTED. As previously mentioned, all levels are a snapshot of the current state. To view a history of Support and Resistance development please use the Replay function.
How to use it:
Approaching a Support and Resistance level:
When price is approaching a Support/Resistance Level, look for reversal patterns you are familiar with.
When price has penetrated/broke a Support/Resistance Level significantly, look for a retest and reversal structure at the level.
It is important that you have a tested method behind your entry and exit strategy. Please note, that the indicator itself just presents price areas where there is a potential for a price reversal, and that these levels should not be traded blindly.
Time frame:
This indicator is programmed to be used on all Timeframes.
Instruments:
This indicator aims to visualize areas of where Market price has the potential to reversal, hence this is a mean reverting Indicator.
Taking this statement to account, it is recommended to apply this Indicator to Instruments with a mean reverting character.
Examples of mean reverting markets could be for example …
...all FOREX instruments, as FOREX is considered a mean reverting Market.
...an instrument that is in a consolidation, or which you are expecting to enter a period of consolidation.
Indicator settings and configuration:
Please view “Tooltips” in the configuration for detailed setting information.
Brief concept of Support and Resistance:
Support and Resistance is a concept that has been around for a very long time. Following links are helpful to get a grasp of the concept:
en.wikipedia.org
www.investopedia.com
Our Team:
We are a team of 3 Traders with a combined experience of 40 years. We are using our experiences from the market to create Indicators to Visualize the most relevant Patterns to us in our trading today. Our goal is to reconstruct these patterns to match our understanding of the market and to simplify the process of creating reproducible trading Strategies.

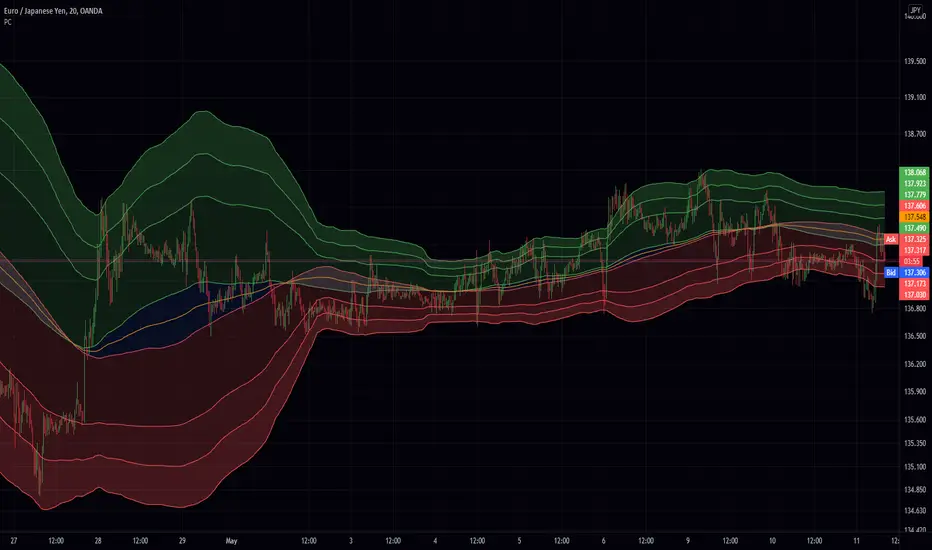
Price Clouds (PS)Price could shows you dynamic support resistance levels. It also displays two bands (ie clouds) that show you where the trend is. If the price hits the bottom of the high band thats a buy and if it hits the top of the high band its a sell. During times of volatility the price can break support but you will find that the opposite band will work as the next level. I added tool tips for every option to help explain what everything does and I also left suggestions for other settings.
This works great on everything! That being said I have this setup in a general way that works really well for 20m forex. If you are scalping you might want to speed up the indicator. This is also true if you want go to the daily chart or above. Adjust the Stdev to match the market.. and I mean really play around with.. dont be shy! With all that out of the way this really will work out of the box. If you like this indicator its actually the same thing as my (PBS) but this one is an overlay on the chart. (Also as of publishing this script the code for this version is way cleaner. In fact I plan on replacing PBS with this as its base)
If you find this indicator is useful to you, Star it, Follow, Donate, Like and Share.
Your support is a highly motivation for me.
Pivot Support & ResistanceHere signals are based on the pivot high and pivot lows. Factors taken into account in understanding the breakout or breakdown are:
volume
candle bar is not opening candle
must be near pivot high or low
Recommendation:
Use once candle closes else you might get trapped in certain cases so be careful

[MF] CURRENT AND NEXT CPR LEVELSThis is CPR with Monthly, Weekly and Daily time frames of the current and next* CPR levels.
* The following lines only become relevant at the end of the cycle.
CPR LEVELS:
P (pivot point) = (H + L + C) / 3
BC (Bottom Central) = (H + L) / 2
TC (Top Central) = (P - BC) + P
Resistance Levels
- Green = R1 Levels ( 2×P - L )
- Green = R2 Levels ( P + (H - L) )
- Green = R3 Levels ( H + 2 * (P - L) )
Support Levels
- Red = S1 Levels ( 2×P - H )
- Red = S2 Levels ( P - (H - L) )
- Red = S3 Levels ( L - 2 * (H- P) )
Description and Refrences:
en.wikipedia.org(technical_analysis)
Rules For BUY Setup with CPR
1) Today's Pivot Level Should be higher than Previous Day's Pivot Level
2) The previous day's close should be near day high.
Rules For SELL Setup with CPR
1) Today's Pivot Level Should be lower than Previous Day's Pivot Level
2) The previous day's close should be near day low.
CPR or central pivot range is the best tool available for the trader to see the price base indicator. You can use this tool i.e CPR (central pivot range) to check the price indicator in the stock market. You know the price of shares sometimes goes up or sometimes goes down in the stock market. So it will be best to stay updated and know it before the time the share market/stock market fall or rises.

Levels High LowEnglish:
Indicator for quickly identifying support and resistance levels. It is possible to use the parameter of the length of the upper and lower levels. The larger it is, the stronger the levels of the levels. The smaller it is, the less strong the levels are. It is possible to go back and turn off labels and lines. By default, the labels and lines are scale, and the length is 20.
Русский:
Индикатор предназначен для быстрого определения уровней поддержки и сопротивления. Есть возможность изменять параметр длинны верхних уровней и нижних. Чем он больше, тем более сильные уровни отображаются. Чем он меньше, тем менее сильные уровни отображаются. Есть возможность включать и отключать метки и линии. По умолчанию метки и линии отображаются, а длинна равна 20.

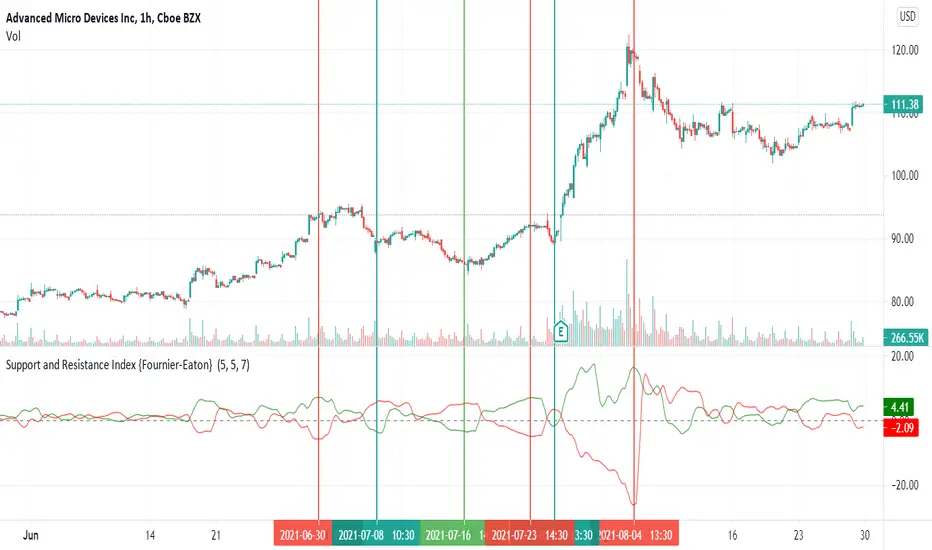
Support and Resistance Index {Fournier-Eaton} This algorithm quantifies the amount of pressure applied by support and resistance and helps confirm trend initiation as levels, relative to horizontal supports and resistances are broken.
Look for spread in the red and green lines
A low spread will usually indicate a rangebound stock as it is pressured on both sides equally by resistance and support
A high spread will typically indicate a stock prepared to make a new directional move.
A widening spread will indicate the continuation of a trend
A narrowing spread will indicate the beginning of a reversal.
More succinctly:
A large spread with RED OVER GREEN indicates a high probability of upward reversal -- think downtrend is exhausted.
A large spread with GREEN OVER RED indicates a high probability of downward reversal -- think uptrend is exhausted.
Shape and relative values (wide green over red etc), not indicator values are of importance, are the most important.
Feedback is always helpful and I hope you find this useful.
Average Daily Range ZonesThe Average Daily Range is a simple concept, calculated as the difference between daily highs and lows averaged over some period. This range is is overlaid and centered on the day's open, and tends to act as areas of support and resistance . This indicator provides two aggregation periods, creating a range that represents volatility in the ADR; a wider spread indicates greater recent volatility , and vice-versa.
Thanks to @Hank Hill for the original idea and ToS script this is based on, and TV for the feedback and support on the use of the security() function.
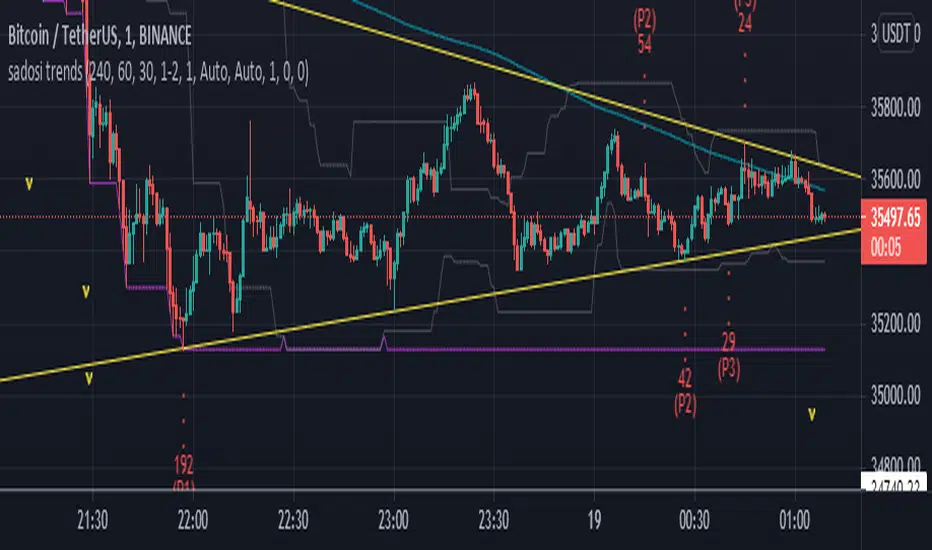
sadosi trends and barrierThis indicator should be used for give ideas.
what they can do?
draw up and down trend lines
draw support and resistance lines
to inform about the current price
signal for high and low prices
how can?
By analyzing the prices in the 3 selected periods, 3 highs and 3 lows prices are marked. With the marked points, trend and resistance lines are drawn. The current price is analyzed and useful calculations displayed in the info box. Finaly adding moving averages. After all these transactions, the trend and resistances become easily visible on the chart.
You can fine-tune the angle of the trend using high and low extensions
you can catch different trend lines by changing the high and low trend points
By changing the periods, you can set position the trend lines more accurately.
When the price is too low or too high, the information box will warn you by change color.
The trend lines to be created are for the purpose of giving an idea and convenience. It can be used on all timeframes, including horizontal trends.
Fibonacci and Ema Trend + Pullback alerts This indicator tells you what to do with supports and resistances based on fibonacci with signs and alarms
and Ema 200 with buy or sell fast pullback alarms
When 0.5 is bear the price will seek to break the lower supports
sell from 0.5 to bear zone and obtain profits below the supports
stop loss above resistence
When 0.5 is bull the price will seek to break the highest resistances
buy from 0.5 to bull zone and profit above the resistances
stop loss below support
you can edit the indicator to have slower or faster levels if you want
The alarms that the indicator has :
Resistence down
Resistence up
Bull zone UP
Buy 0.5 Bull
Sell 0.5 Bear
Bear zone DOWN
Bear zone UP sell to 5.0 bear
Bull zone DOWN Buy to 0.5 bull
Support zone DOWN
Support zone UP
ema 200 pullback alerts
when price is going up active the buy fast pullback alarm
stop loss below ema 200 or support
when price is going Down active the sell fast pullback alarm
stop loss above ema 200 or resistence

Crypto EMA Bands - Support and ResistanceEMA Bands for crypto markets shows support and resistance lines. Helps identify bull and bear market trends. SMA200 is white and turns yellow to signal pressure. Can also be useful for identifying Elliot waves and breakouts.
