Mutanabby_AI | Fresh Algo V24Mutanabby_AI | Fresh Algo V24: Advanced Multi-Mode Trading System
Overview
The Mutanabby_AI Fresh Algo V24 represents a sophisticated evolution of multi-component trading systems that adapts to various market conditions through advanced operational configurations and enhanced analytical capabilities. This comprehensive indicator provides traders with multiple signal generation approaches, specialized assistant functions, and dynamic risk management tools designed for professional market analysis across diverse trading environments.
Primary Signal Generation Framework
The Fresh Algo V24 operates through two fundamental signal generation approaches that accommodate different market perspectives and trading philosophies. The Trending Signals Mode serves as the primary trend-following mechanism, combining Wave Trend Oscillator analysis with Supertrend directional signals and Squeeze Momentum breakout detection. This mode incorporates ADX filtering that requires values exceeding 20 to ensure sufficient trend strength exists before signal activation, making it particularly effective during sustained directional market movements where momentum persistence creates profitable trading opportunities.
The Contrarian Signals Mode provides an alternative approach targeting reversal opportunities through extreme market condition identification. This mode activates when the Wave Trend Oscillator reaches critical threshold levels, specifically when readings surpass 65 indicating potential bearish reversal conditions or drop below 35 suggesting bullish reversal opportunities. This methodology proves valuable during overextended market phases where mean reversion becomes statistically probable.
Advanced Filtering Mechanisms
The system incorporates multiple sophisticated filtering mechanisms designed to enhance signal quality and reduce false positive occurrences. The High Volume Filter requires volume expansion confirmation before signal activation, utilizing exponential moving average calculations to ensure institutional participation accompanies price movements. This filter substantially improves signal reliability by eliminating low-conviction breakouts that lack adequate volume support from professional market participants.
The Strong Filter provides additional trend confirmation through 200-period exponential moving average analysis. Long position signals require price action above this benchmark level, while short position signals necessitate price action below it. This ensures strategic alignment with longer-term trend direction and reduces the probability of trading against major market movements that could invalidate shorter-term signals.
Cloud Filter Configuration System
The Fresh Algo V24 offers four distinct cloud filter configurations, each optimized for specific trading timeframes and market approaches. The Smooth Cloud Filter utilizes the mathematical relationship between 150-period and 250-period exponential moving averages, providing stable trend identification suitable for position trading strategies. This configuration generates signals exclusively when price action aligns with cloud direction, creating a more deliberate but highly reliable signal generation process.
The Swing Cloud Filter employs modified Supertrend calculations with parameters specifically optimized for swing trading timeframes. This filter achieves optimal balance between responsiveness and stability, adapting effectively to medium-term price movements while filtering excessive market noise that typically affects shorter-term analytical systems.
For active intraday traders, the Scalping Cloud Filter utilizes accelerated Supertrend calculations designed to capture rapid trend changes effectively. This configuration provides enhanced signal generation frequency suitable for compressed timeframe strategies. The advanced Scalping+ Cloud Filter incorporates Hull Moving Average confirmation, delivering maximum responsiveness for ultra-short-term trading while maintaining signal quality through additional momentum validation processes.
Specialized Assistant Functionality
The system includes two distinct assistant modes that provide supplementary market analysis capabilities. The Trend Assistant Mode activates advanced cloud analysis overlays that display dynamic support and resistance zones calculated through adaptive volatility algorithms. These levels automatically adjust to current market conditions, providing visual guidance for identifying trend continuation patterns and potential reversal areas with mathematical precision.
The Trend Tracker Mode concentrates on long-term trend identification by displaying major exponential moving averages with color-coded fill areas that clarify directional bias. This mode maintains visual simplicity while providing comprehensive trend context evaluation, enabling traders to quickly assess broader market direction and align shorter-term strategies accordingly.
Dynamic Risk Management System
The integrated risk management system automatically adapts across all operational modes, calculating stop loss and take profit targets using Average True Range multiples that adjust to current market volatility. This approach ensures consistent risk parameters regardless of selected operational mode while maintaining relevance to prevailing market conditions.
Stop loss placement occurs at dynamically calculated distances from entry points, while three progressive take profit targets establish at customizable ATR multiples respectively. The system automatically updates these levels upon trend direction changes, ensuring current market volatility influences all risk calculations and maintains appropriate risk-reward ratios throughout trade management.
Comprehensive Market Analysis Dashboard
The sophisticated dashboard provides real-time market analysis including volatility measurements, institutional activity assessment, and multi-timeframe trend evaluation across five-minute through four-hour periods. This comprehensive market context assists traders in selecting appropriate operational modes based on current market characteristics rather than relying exclusively on historical performance data.
The multi-timeframe analysis ensures mode selection considers broader market context beyond the primary trading timeframe, improving overall strategic alignment and reducing conflicts between different temporal market perspectives. The dashboard displays market state classification, volatility percentages, institutional activity levels, current trading session information, and trend pressure indicators with professional formatting and clear visual hierarchy.
Enhanced Trading Assistants
The Fresh Algo V24 includes specialized trading assistant features that complement the primary signal generation system. The Reversal Dot functionality identifies potential reversal points through Wave Trend Oscillator analysis, displaying visual indicators when crossover conditions occur at extreme levels. These reversal indicators provide early warning signals for potential trend changes before they appear in the primary signal system.
The Dynamic Take Profit Labels feature automatically identifies optimal profit-taking opportunities through RSI threshold analysis, marking potential exit points at multiple levels for long positions and corresponding levels for short positions. This automated profit management system helps traders optimize exit timing without requiring constant manual monitoring of technical indicators.
Advanced Alert System
The comprehensive alert system accommodates all operational modes while providing granular notification control for various signal types and risk management events. Traders can configure separate alerts for normal buy signals, strong buy signals, normal sell signals, strong sell signals, stop loss triggers, and individual take profit target achievements.
Cloud crossover alerts notify traders when trend direction changes occur, providing early indication of potential strategy adjustments. The alert system includes detailed trade setup information, timeframe data, and relevant entry and exit levels, ensuring traders receive complete context for informed decision-making without requiring constant chart monitoring.
Technical Foundation Architecture
The Fresh Algo V24 combines multiple proven technical analysis components including Wave Trend Oscillator for momentum assessment, Supertrend for directional bias determination, Squeeze Momentum for volatility analysis, and various exponential moving averages for trend confirmation. Each component contributes specific market insights while the unified system provides comprehensive market evaluation through their mathematical integration.
The multi-component approach reduces dependency on individual indicator limitations while leveraging the analytical strengths of each technical tool. This creates a robust analytical framework capable of adapting to diverse market conditions through appropriate mode selection and parameter optimization, ensuring consistent performance across varying market environments.
Market State Classification
The indicator incorporates advanced market state classification through ADX analysis, distinguishing between trending, ranging, and transitional market conditions. This classification system automatically adjusts signal sensitivity and filtering parameters based on current market characteristics, optimizing performance for prevailing conditions rather than applying static analytical approaches.
The volatility measurement system calculates current market activity levels as percentages, providing quantitative assessment of market energy and helping traders select appropriate operational modes. Institutional activity detection through volume analysis ensures signal generation aligns with professional market participation patterns.
Implementation Strategy Considerations
Successful implementation requires careful matching of operational modes to prevailing market conditions and individual trading objectives. Trending modes demonstrate optimal performance during directional markets with sustained momentum characteristics, while contrarian modes excel during range-bound or overextended market conditions where reversal probability increases.
The cloud filter configurations provide varying degrees of confirmation strength, with smoother settings reducing false signal occurrence at the expense of some responsiveness to price changes. Traders must balance signal quality against signal frequency based on their risk tolerance and available trading time, utilizing the comprehensive customization options to optimize performance for their specific requirements.
Multi-Timeframe Integration
The system provides seamless multi-timeframe analysis through the integrated dashboard, displaying trend alignment across multiple time horizons from five-minute through four-hour periods. This analysis helps traders understand broader market context and avoid conflicts between different temporal perspectives that could compromise trade outcomes.
Session analysis identifies current trading session characteristics, providing context for expected market behavior patterns and helping traders adjust their approach based on typical session volatility and participation levels. This geographic market awareness enhances strategic decision-making and improves timing for trade execution.
Advanced Visualization Features
The indicator includes sophisticated visualization capabilities through gradient candle coloring based on MACD analysis, providing immediate visual feedback on momentum strength and direction. This enhancement allows rapid market assessment without requiring detailed indicator analysis, improving efficiency for traders managing multiple instruments simultaneously.
The cloud visualization system uses color-coded fill areas to clearly indicate trend direction and strength, with automatic adaptation to selected operational modes. This visual clarity reduces analytical complexity while maintaining comprehensive market information display through professional chart presentation.
Performance Optimization Framework
The Fresh Algo V24 incorporates performance optimization features including signal strength classification, automatic parameter adjustment based on market conditions, and dynamic filtering that adapts to current volatility levels. These optimizations ensure consistent performance across varying market environments while maintaining signal quality standards.
The system automatically adjusts sensitivity levels based on selected operational modes, ensuring appropriate responsiveness for different trading approaches. This adaptive framework reduces the need for manual parameter adjustments while maintaining optimal performance characteristics for each operational configuration.
Conclusion
The Mutanabby_AI Fresh Algo V24 represents a comprehensive solution for professional trading analysis, combining multiple analytical approaches with advanced visualization and risk management capabilities. The system's strength lies in its adaptive multi-mode design and sophisticated filtering mechanisms, providing traders with versatile tools for various market conditions and trading styles.
Success with this system requires understanding the relationship between different operational modes and their optimal application scenarios. The comprehensive dashboard and alert system provide essential market context and trade management support, enabling systematic approach to market analysis while maintaining flexibility for individual trading preferences.
The indicator's sophisticated architecture and extensive customization options make it suitable for traders at all experience levels, from those seeking systematic signal generation to advanced practitioners requiring comprehensive market analysis tools. The multi-timeframe integration and adaptive filtering ensure consistent performance across diverse market conditions while providing clear guidelines for strategic implementation.
Riskmanagment

Mutanabby_AI | Ultimate Algo | Remastered+Overview
The Mutanabby_AI Ultimate Algo Remastered+ represents a sophisticated trend-following system that combines Supertrend analysis with multiple moving average confirmations. This comprehensive indicator is designed specifically for identifying high-probability trend continuation and reversal opportunities across various market conditions.
Core Algorithm Components
**Supertrend Foundation**: The primary signal generation relies on a customizable Supertrend indicator with adjustable sensitivity (1-20 range). This adaptive trend-following tool uses Average True Range calculations to establish dynamic support and resistance levels that respond to market volatility.
**SMA Confirmation Matrix**: Multiple Simple Moving Averages (SMA 4, 5, 9, 13) provide layered confirmation for signal strength. The algorithm distinguishes between regular signals and "Strong" signals based on SMA 4 vs SMA 5 relationship, offering traders different conviction levels for position sizing.
**Trend Ribbon Visualization**: SMA 21 and SMA 34 create a visual trend ribbon that changes color based on their relationship. Green ribbon indicates bullish momentum while red signals bearish conditions, providing immediate visual trend context.
**RSI-Based Candle Coloring**: Advanced 61-tier RSI system colors candles with gradient precision from deep red (RSI ≤20) through purple transitions to bright green (RSI ≥79). This visual enhancement helps traders instantly assess momentum strength and overbought/oversold conditions.
Signal Generation Logic
**Buy Signal Criteria**:
- Price crosses above Supertrend line
- Close price must be above SMA 9 (trend confirmation)
- Signal strength determined by SMA 4 vs SMA 5 relationship
- "Strong Buy" when SMA 4 ≥ SMA 5
- Regular "Buy" when SMA 4 < SMA 5
**Sell Signal Criteria**:
- Price crosses below Supertrend line
- Close price must be below SMA 9 (trend confirmation)
- Signal strength based on SMA relationship
- "Strong Sell" when SMA 4 ≤ SMA 5
- Regular "Sell" when SMA 4 > SMA 5
Advanced Risk Management System
**Automated TP/SL Calculation**: The indicator automatically calculates stop loss and take profit levels using ATR-based measurements. Risk percentage and ATR length are fully customizable, allowing traders to adapt to different market conditions and personal risk tolerance.
**Multiple Take Profit Targets**:
- 1:1 Risk-Reward ratio for conservative profit taking
- 2:1 Risk-Reward for balanced trade management
- 3:1 Risk-Reward for maximum profit potential
**Visual Risk Display**: All risk management levels appear as both labels and optional trend lines on the chart. Customizable line styles (solid, dashed, dotted) and positioning ensure clear visualization without chart clutter.
**Dynamic Level Updates**: Risk levels automatically recalculate with each new signal, maintaining current market relevance throughout position lifecycles.
Visual Enhancement Features
**Customizable Display Options**: Toggle trend ribbon, TP/SL levels, and risk lines independently. Decimal precision adjustments (1-8 decimal places) accommodate different instrument price formats and personal preferences.
**Professional Label System**: Clean, informative labels show entry points, stop losses, and take profit targets with precise price levels. Labels automatically position themselves for optimal chart readability.
**Color-Coded Momentum**: The gradient RSI candle coloring system provides instant visual feedback on momentum strength, helping traders assess market energy and potential reversal zones.
Implementation Strategy
**Timeframe Optimization**: The algorithm performs effectively across multiple timeframes, with higher timeframes (4H, Daily) providing more reliable signals for swing trading. Lower timeframes work well for day trading with appropriate risk adjustments.
**Sensitivity Adjustment**: Lower sensitivity values (1-5) generate fewer but higher-quality signals, ideal for conservative approaches. Higher sensitivity (15-20) increases signal frequency for active trading styles.
**Risk Management Integration**: Use the automated risk calculations as baseline parameters, adjusting risk percentage based on account size and market conditions. The 1:1, 2:1, 3:1 targets enable systematic profit-taking strategies.
Market Application
**Trend Following Excellence**: Primary strength lies in capturing significant trend movements through the Supertrend foundation with SMA confirmation. The dual-layer approach reduces false signals common in single-indicator systems.
**Momentum Assessment**: RSI-based candle coloring provides immediate momentum context, helping traders assess signal strength and potential continuation probability.
**Range Detection**: The trend ribbon helps identify ranging conditions when SMA 21 and SMA 34 converge, alerting traders to potential breakout opportunities.
Performance Optimization
**Signal Quality**: The requirement for both Supertrend crossover AND SMA 9 confirmation significantly improves signal reliability compared to basic trend-following approaches.
**Visual Clarity**: The comprehensive visual system enables rapid market assessment without complex calculations, ideal for traders managing multiple instruments.
**Adaptability**: Extensive customization options allow fine-tuning for specific markets, trading styles, and risk preferences while maintaining the core algorithm integrity.
## Non-Repainting Design
**Educational Note**: This indicator uses standard TradingView functions (Supertrend, SMA, RSI) with normal behavior patterns. Real-time updates on current candles are expected and standard across all technical indicators. Historical signals on closed candles remain fixed and unchanged, ensuring reliable backtesting and analysis.
**Signal Confirmation**: Final signals are confirmed only when candles close, following standard technical analysis principles. The algorithm provides clear distinction between developing signals and confirmed entries.
Technical Specifications
**Supertrend Parameters**: Default sensitivity of 4 with ATR length of 11 provides balanced signal generation. Sensitivity range from 1-20 allows adaptation to different market volatilities and trading preferences.
**Moving Average Configuration**: SMA periods of 8, 9, and 13 create multi-layered trend confirmation, while SMA 21 and 34 form the visual trend ribbon for broader market context.
**Risk Management**: ATR-based calculations with customizable risk percentage ensure dynamic adaptation to market volatility while maintaining consistent risk exposure principles.
Recommended Settings
**Conservative Approach**: Sensitivity 4-5, RSI length 14, higher timeframes (4H, Daily) for swing trading with maximum signal reliability.
**Active Trading**: Sensitivity 6-8, RSI length 8-10, intermediate timeframes (1H) for balanced signal frequency and quality.
**Scalping Setup**: Sensitivity 10-15, RSI length 5-8, lower timeframes (15-30min) with enhanced risk management protocols.
## Conclusion
The Mutanabby_AI Ultimate Algo Remastered+ combines proven trend-following principles with modern visual enhancements and comprehensive risk management. The algorithm's strength lies in its multi-layered confirmation approach and automated risk calculations, providing both novice and experienced traders with clear signals and systematic trade management.
Success with this system requires understanding the relationship between signal strength indicators and adapting sensitivity settings to match current market conditions. The comprehensive visual feedback system enables rapid decision-making while the automated risk management ensures consistent trade parameters.
Practice with different sensitivity settings and timeframes to optimize performance for your specific trading style and risk tolerance. The algorithm's systematic approach provides an excellent framework for disciplined trend-following strategies across various market environments.

ATR Stop-Loss with Fibonacci Take-Profit [jpkxyz]ATR Stop-Loss with Fibonacci Take-Profit Indicator
This comprehensive indicator combines Average True Range (ATR) volatility analysis with Fibonacci extensions to create dynamic stop-loss and take-profit levels. It's designed to help traders set precise risk management levels and profit targets based on market volatility and mathematical ratios.
Two Operating Modes
Default Mode (Rolling Levels)
In default mode, the indicator continuously plots evolving stop-loss and take-profit levels based on real-time price action. These levels update dynamically as new bars form, creating rolling horizontal lines across the chart. I use this mode primarily to plot the rolling ATR-Level which I use to trail my Stop-Loss into profit.
Characteristics:
Levels recalculate with each new bar
All selected Fibonacci levels display simultaneously
Uses plot() functions with trackprice=true for price tracking
Custom Anchor Mode (Fixed Levels)
This is the primary mode for precision trading. You select a specific timestamp (typically your entry bar), and the indicator locks all calculations to that exact moment, creating fixed horizontal lines that represent your actual trade levels.
Characteristics:
Entry line (blue) marks your anchor point
Stop-loss calculated using ATR from the anchor bar
Fibonacci levels projected from entry-to-stop distance
Lines terminate when price breaks through them
Includes comprehensive alert system
Core Calculation Logic
ATR Stop-Loss Calculation:
Stop Loss = Entry Price ± (ATR × Multiplier)
Long positions: SL = Entry - (ATR × Multiplier)
Short positions: SL = Entry + (ATR × Multiplier)
ATR uses your chosen smoothing method (RMA, SMA, EMA, or WMA)
Default multiplier is 1.5, adjustable to your risk tolerance
Fibonacci Take-Profit Projection:
The distance from entry to stop-loss becomes the base unit (1.0) for Fibonacci extensions:
TP Level = Entry + (Entry-to-SL Distance × Fibonacci Ratio)
Available Fibonacci Levels:
Conservative: 0.618, 1.0, 1.618
Extended: 2.618, 3.618, 4.618
Complete range: 0.0 to 4.764 (23 levels total)
Multi-Timeframe Functionality
One of the indicator's most powerful features is timeframe flexibility. You can analyze on one timeframe while using stop-loss and take-profit calculations from another.
Best Practices:
Identify your entry point on execution timeframe
Enable "Custom Anchor" mode
Set anchor timestamp to your entry bar
Select appropriate analysis timeframe
Choose relevant Fibonacci levels
Enable alerts for automated notifications
Example Scenario:
Analyse trend on 4-hour chart
Execute entry on 5-minute chart for precision
Set custom anchor to your 5-minute entry bar
Configure timeframe setting to "4h" for swing-level targets
Select appropriate Fibonacci Extension levels
Result: Precise entry with larger timeframe risk management
Visual Intelligence System
Line Behaviour in Custom Anchor Mode:
Active levels: Lines extend to the right edge
Hit levels: Lines terminate at the breaking bar
Entry line: Always visible in blue
Stop-loss: Red line, terminates when hit
Take-profits: Green lines (1.618 level in gold for emphasis)
Customisation Options:
Line width (1-4 pixels)
Show/hide individual Fibonacci levels
ATR length and smoothing method
ATR multiplier for stop-loss distance

Visual ATR StopThis indicator uses the Average True Range (ATR) to display a visual range for stop placement. Two multiplier values (example, 1 and 3) can be set to create a filled area below the price. This area represents the range between the two ATR levels, adjusted by subtracting the current price, providing a simple way to visualize stop-loss placement based on volatility.
The indicator is customizable; for example, negative values can place the area above the price for short positions. The filled color can also be removed, which allows precise levels to be marked above and below.

QTY@RISK VWAP based calculationVWAP Volatility-Based Risk Management Calculator for Intraday Trading
Overview
This script is an innovative tool designed to help traders manage risk effectively by calculating position sizes and stop-loss levels using the Volume Weighted Average Price (VWAP) and its standard deviation (StdDev). Unlike traditional methods that rely on time-based calculations, this approach is time-independent within the intraday timeframe, making it particularly useful for traders seeking precision and efficiency.
Key Concepts
VWAP (Volume Weighted Average Price): VWAP is a trading benchmark that represents the average price a security has traded at throughout the day, based on both volume and price. It provides insight into the average price level over a specific period, helping traders understand the market trend.
StdDev (Standard Deviation): In the context of VWAP, the standard deviation measures the volatility around the VWAP. It provides a quantifiable range that traders can use to set stop-loss levels, ensuring they are neither too tight nor too loose.
How the Script Works
1. VWAP Calculation: The script calculates the VWAP continuously as the market trades, integrating both price and volume data.
2. Volatility Measurement: It then computes the standard deviation of the VWAP, giving a measure of market volatility.
3. Stop-Loss Calculation: Using user-defined StdDev factors, the script calculates two stop-loss levels. These levels adjust dynamically based on market conditions, ensuring they remain relevant throughout the trading session.
4. Position Sizing: By incorporating your risk tolerance, the script determines the appropriate position size. This ensures that your maximum loss per trade does not exceed your predefined risk value.
How to Use the Calculator
1. Select Two VWAP StdDev Factors: Choose two standard deviation factors for calculating stop-loss levels. For example, you might choose 0.5 and 0.75 to set conservative and aggressive stop-losses respectively.
2. Set Your Trading Account Size: Enter your total trading capital. For example, $50,000.
3. Maximum Lot Size: Define the maximum number of shares you are willing to trade in a single position. For instance, 200 shares.
4. Risk Value per Trade: Input the maximum amount of money you are willing to risk on a single trade. For instance, $50.
5. Plotting Options: If you wish to visualize the stop-loss levels, enable the plot option and choose the price base for the plot, such as the closing price or the average of the high and low prices (hl2).
Example of Use
1. Initial Setup: After the market opens, wait for at least 15 minutes to ensure the VWAP has stabilized with sufficient volume data.
2. Parameter Configuration: Input your desired parameters into the calculator. For instance:
- VWAP StdDev Factors: 0.5 and 0.75
- Trading Account Size: $50,000
- Maximum Lot Size: 200 shares
- Risk Value per Trade: $50
- Plot Option: On, using "hl2" or "close" as the price base
3. Execution: Based on the inputs, the script calculates the position size and stop-loss levels. If the calculated stop-loss falls within the selected VWAP StdDev range, it will provide you with precise stop-loss prices.
4. Trading: Use the calculated position size and stop-loss levels to execute your trades confidently, knowing that your risk is managed effectively.
Advantages for Traders
- Time Independence: By relying on VWAP and its StdDev, the calculations are not dependent on specific time intervals, making them more adaptable to real-time trading conditions.
- Focus on Strategy: Novice traders can focus more on their trading strategies rather than getting bogged down with complex calculations.
- Dynamic Adjustments: The script adjusts stop-loss levels dynamically based on evolving market conditions, providing more accurate and relevant risk management.
- Flexibility: Traders can tailor the calculator to their risk preferences and trading style by adjusting the StdDev factors and risk parameters.
By incorporating these concepts and using this risk management calculator, traders can enhance their trading efficiency, improve their risk management, and ultimately make more informed trading decisions.
RSI Multi Strategies With Overlay SignalsHello everyone,
In this indicator, you will find 6 different entry and exit signals based on the RSI :
Entry into overbought and oversold zones
Exit from overbought and oversold zones
Crossing the 50 level
RSI cross RSI MA below or above the 50 level
RSI cross RSI MA in the overbought or oversold zones
RSI Divergence
With the signals identified, you can create your own strategy . (If you have any suggestions, please mention them in the comments).
Beyond these signals, you can set SL (Stop Loss) and TP (Take Profit) levels to better manage your positions.
SL Methods:
Percentage: The stop loss is determined by the percentage you specify.
ATR : The stop level is determined based on the Average True Range (ATR).
TP Methods:
Percentage: The take profit is determined by the percentage you specify.
RR ( Risk Reward ): The take profit level is determined based on the distance from the stop level.
You can mix and match these options as you like.
What makes the indicator unique and effective is its ability to display the RSI in the bottom chart and the signals, SL (Stop Loss), and TP (Take Profit) levels in the overlay chart simultaneously. This feature allows you to manage your trading quickly and easily without the need for using two separate indicators.
Let's try out a few strategies together.
My entry signal: RSI Entered OS (Oversold) Zone
My exit signal: RSI Entered OB (Overbought) Zone
I'm not using a stoploss for this strategy ("Fortune favors the brave").
Let's keep ourselves safe by adding a stop loss.
I'm adding an ATR-based stop loss.
I think it's better now.
If you have any questions or suggestions about the indicator, you can contact me.
Cheers

Risk Management Chart█ OVERVIEW
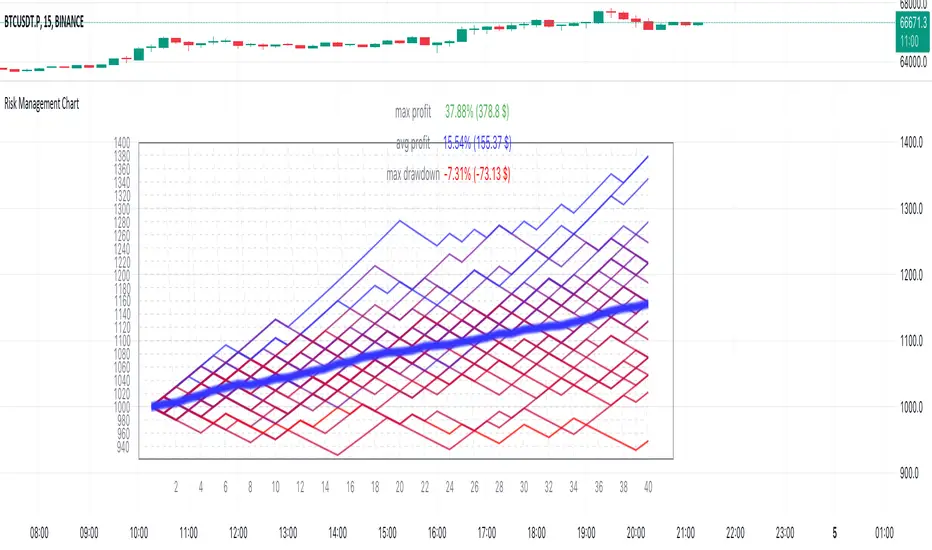
Risk Management Chart allows you to calculate and visualize equity and risk depend on your risk-reward statistics which you can set at the settings.
This script generates random trades and variants of each trade based on your settings of win/loss percent and shows it on the chart as different polyline and also shows thick line which is average of all trades.
It allows you to visualize and possible to analyze probability of your risk management. Be using different settings you can adjust and change your risk management for better profit in future.
It uses compound interest for each trade.
Each variant of trade is shown as a polyline with color from gradient depended on it last profit.
Also I made blurred lines for better visualization with function :
poly(_arr, _col, _t, _tr) =>
for t = 1 to _t
polyline.new(_arr, false, false, xloc.bar_index, color.new(_col, 0 + t * _tr), line_width = t)
█ HOW TO USE
Just add it to the cart and expand the window.
█ SETTINGS
Start Equity $ - Amount of money to start with (your equity for trades)
Win Probability % - Percent of your win / loss trades
Risk/Reward Ratio - How many profit you will get for each risk(depends on risk per trade %)
Number of Trades - How many trades will be generated for each variant of random trading
Number of variants(lines) - How many variants will be generated for each trade
Risk per Trade % -risk % of current equity for each trade
If you have any ask it at comments.
Hope it will be useful.
VaR Market Sentiment by TenozenHello there! I am excited to share with you my new trading concept implemented in the "VaR Market Sentiment" indicator. But before that, let me explain what VaR is. VaR, or Value at Risk, is an indicator that helps you identify the worst-case scenario of a market movement based on a percentile/confidence level. This means that it calculates the worst moves, whether it's a buy or sell, based on the timeframe you're using.
Now, let's discuss how VaR Market Sentiment works. It uses a historical VaR to calculate the worst move either if the market goes up or down based on a percentile/confidence level. The default setting is the 95th percentile, which means that the market is unlikely to hit your SL level within the day if you're using a daily timeframe, etc.
To determine the strength of a candle, it subtracts the value of both sides based on the returns of the current timeframe with the VaR value (Bullish VaR - Bullish Returns, Bearish VaR - Bearish Returns). If the result is above the mean, the current candle is potentially weak. Conversely, if the result is below the mean, the current candle is potentially strong. The deviation shows critical sentiments, where if the market is above the deviation, it means that the current candle is really weak. If it's below the deviation, it means that the current candle is really strong.
It's important to note that this indicator needs other supporting indicators such as trend-following or mean reversion indicators based on your trading style. Also, as a follow-up to my previous concept, I called out that the market has what's called "power." And for now, I conclude that VaR Market Sentiment is the "power."
I'm going to share more helpful indicators in the future! I hope this indicator will be helpful for you guys! Ciao!

QTY@RISKWhat it does:
This indicator calculates the amount of shares to take at a predefined risk according to market volatility based on ATR.
This should help novice traders focus more on their trades and strategies instead of spending too much time calculating parameters.
How it works:
You have some configuration parameters
1. Number of candles used to calculate the ATR
2. ATR calculation method (SMA, RMA, EMA, WMA)
3. How much you want to risk in $.
4. Safety factor on ATR, to get a buffer
5. Size of your capital to be able to calculate the maximum amount of shares
6. Shares limit, if you have a certain limit of shares to take
The formula is simple:
Is the RISK/ATR * price > Equity ? then take the Equity/price
otherwise: SHARES = RISK/(ATR * safety_factor)
How to use it:
This indicator is most useful for intraday timeframe. If you trade on 1m, then use it in this timeframe
Mason’s Line IndicatorThe Macon Strategy is an idea conceived by Didier Darcet , co-founder of Gavekal Intelligence Software. Inspired by the Water Level, an instrument used by masons to check the horizontality or verticality of a wall. This method aims to measure the psychology of financial markets and determine if the market is balanced or tilting towards an unfavorable side, focusing on the behavioral risk of markets rather than economic or political factors.
The strategy examines the satisfaction and frustration of investors based on the distance between the low and high points of the market over a period of one year. Investor satisfaction is influenced by the current price of the index and the path taken to reach that price. The distance to the low point provides satisfaction, while the distance to the high point generates frustration. The balance between the two dictates investors’ desire to hold or sell their positions.
To refine the strategy, it is important to consider the opinion of a group of investors rather than just one individual. The members of a hypothetical investor club invest successively throughout the past year. The overall satisfaction of the market on a given day is a democratic expression of all participants.
If the overall satisfaction is below 50%, investors are frustrated and sell their positions. If it is above, they are satisfied and hold their positions. The position of the group of investors relative to the high and low points represents the position of the air bubble in the water level. Market performance is measured day by day based on participant satisfaction or dissatisfaction.
In conclusion, memory, emotions, and decision-making ability are closely linked, and their interaction influences investment decisions. The Macon Strategy highlights the importance of the behavioral dimension in understanding financial market dynamics. By studying investor behavior through this strategy, it is possible to better anticipate market trends and make more informed investment decisions.
Presentation of the Mason’s Line Indicator:
The main strategy of this indicator is to measure the average satisfaction of investors based on the position of an imaginary air bubble in a tube delimited by the market’s highs and lows over a given period. After calculating the satisfaction level, it is then normalized between 0 and 1, and a moving average can be used to visualize trends.
Key features:
Calculation of highs and lows over a user-defined period.
Determination of the position of the air bubble in the tube based on the closing price.
Calculation of the average satisfaction of investors over a selected period.
Normalization of the average satisfaction between 0 and 1.
Visualization of normalized or non-normalized average satisfaction levels, as well as their corresponding moving averages.
User parameters:
Period for min and max (days) : Sets the period over which highs and lows will be calculated (1 to 365 days).
Period for average satisfaction (days) : Determines the period over which the average satisfaction of investors will be calculated (1 to 365 days).
Period for SMA : Sets the period of the simple moving average used to smooth the data (1 to 1000 days).
Bubble_value : Adjustment of the air bubble value, ranging from 0 to 1, in increments of 0.025.
Normalized average satisfaction : Option to choose whether to display the normalized or non-normalized average satisfaction.
Please note that the Mason’s Line Indicator is not a guarantee of future market performance and should be used in conjunction with proper risk management. Always ensure that you have a thorough understanding of the indicator’s methodology and its limitations before making any investment decisions. Additionally, past performance is not indicative of future results.

Basic Position Calculator (BPC)In trading, proper position sizing is essential to managing risk and maximizing returns. The script provided is a Basic Position Calculator that allows traders to quickly and easily calculate their position size, stop loss, take profit, and risk reward ratio for a given trade.
The script starts by defining several inputs for the user to customize the calculations. The first input is the "Account Size", which specifies the total amount of funds available for the trade. The next input is "Risk Amount %", which is the percentage of the account size that the trader is willing to risk per trade. The "Stop Loss" input specifies the maximum amount of loss that the trader is willing to accept, while the "Reward" input is the desired profit target for the trade. Finally, there is a "Position" input that allows the user to specify where on the chart the table of calculations will be displayed.
The script then calculates the position size, stop loss, take profit and risk reward ratio using the user-specified inputs. The position size is calculated by dividing the risk amount by the stop loss. The stop loss is calculated by multiplying the stop loss percentage by the close price, and the take profit is calculated by multiplying the stop loss percentage by the close price and the reward. Risk-reward ratio is the ratio of amount of profit potential to the amount of risk in a trade.
The script then creates a table and displays the calculated values on the chart at the specified location. The table includes the following information: account size, position size, account risk %, stop loss, stop loss %, take profit, take profit % and risk reward ratio. This allows the trader to quickly and easily see all the key calculations for their trade in one place.
Overall, the Basic Position Calculator script is a valuable tool for any trader looking to quickly and easily calculate their position size, stop loss, take profit, and risk reward ratio for a given trade. The ability to customize the inputs and display the calculations on the chart makes it a useful and user-friendly tool for managing risk and maximizing returns.

TrapulatorA position size, stop loss and take profit calculator to make forex trading easier.
Utilizes the symbol, payout rates, etc.
How to Use:
Go to the indicator's settings and change the "Settings" and "Entry" sections. After saving your settings, the values will be drawn in a table on the chart.
This has been republished, so that it has the correct name. You can't change the name of scripts once they've been published as far as I'm aware. So, this version of the script will receive updates, and the Trap Calculator will just be a 1.0 version, that's available.
There are default values within the calculator, so use at your own risk and do your own due diligence. This is public so that you can use it to make a calculator that better suits your needs if you want.

6 Multi-Timeframe Supertrend with Heikin Ashi as Source
This is a multiple multi-timeframe version of famous supertrernd only with Heikin Ashi as source. Atr which stands in the heart of supertrend is calculated based on heikin-ashi bars which omits a great deal of noises.
with 6 multiplication of the supertrend, its simply much easier to spot trend direction or use it as trailing stop with several levels available.
this is a great tool to assess and manage your risk and calculate your position volume if you use the heikin ashi supertrend as your stoploss.

Manual Stop Loss / Risk Management PanelHere is a panel where you enter the desired stop-loss price, the amount you would like to risk and it spits out what you should trade to only lose that amount if the stop-loss is hit.

Ultimate risk management toolHow to use:
Use the cursor to select the time, entry, stop loss, and target position. Then a window will pop up and type the trading fee or any other things you want to adjust to calculate the actual reward/risk ratio according to the price you selected.
Known error:
Settings of this script can't be saved as default might due to the interactive price selection function. If anyone knows how to fix it, please let me know.
feature:
1. Dynamic profit label can move up and down vertically on the right-hand side of the box.
2. The breakeven line can tell you you can move your stop loss to the entry price when the price reaches it.
3. Calculate the actual reward/risk ratio based on the trading fee. The calculator only calculates the actual Risk/Reward Ratio, which might be helpful for scalpers.
4. When the price touches sl or tp, that side of the box will be highlighted. Sometimes it doesn't work but I will try my best to fix it. Feel free to share your idea to help me to fix it.
5. Price alert. This tool compares with the alert function but reopens it if you want to change the alert price.
