Multi-Spectral RSI Deviations [AlgoAlpha]🌌 Multi-Spectral RSI Deviations by AlgoAlpha - Dive into Market Dynamics! 🌠
Dive deep into the essence of market trends with our 🚀 Multi-Spectral RSI Deviations indicator, a comprehensive tool designed by AlgoAlpha to enhance your trading strategy. By harnessing the power of multiple RSI lengths and innovative smoothing techniques, this indicator offers a unique perspective on market momentum and potential reversals.
🔍 Key Features:
🎨 Customizable up and down colors for immediate trend recognition.
🔢 Three RSI lengths for multi-layered market analysis.
🔄 Various Moving Average (MA) types including SMA, EMA, and more for tailored smoothing.
✅ Bullish and Bearish divergence plotting for spotting potential reversals.
🕵️♂️ Adjustable divergence sensitivity settings to fine-tune signal detection.
🔔 Built-in alerts for trend shifts and reversal conditions, ensuring you never miss a trading opportunity.
🚀 Quick Guide to Using the Multi-Spectral RSI Deviations Indicator
🛠 Add the Indicator: Search for "Multi-Spectral RSI Deviations" in TradingView's Indicators & Strategies. Adjust the RSI lengths and MA settings to suit your trading strategy.
🔍 Market Analysis: Keep an eye on the color changes for trend direction and use divergence plots to anticipate potential market reversals.
🔔 Alerts Setup: Activate the built-in alerts for trend shifts and reversals to stay ahead of the game without having to constantly monitor the charts.
🧠 How It Works:
At the core of the Multi-Spectral RSI Deviations indicator is its ability to analyze the market through various RSI lengths, providing a comprehensive view of momentum. The indicator calculates the Relative Strength Index (RSI) over three different periods, creating a spectrum of momentum insights. These RSI values are then compared to each other to identify the momentum shifts within the market.
To refine these insights, the differences between these RSI values are smoothed using a selected Moving Average type, such as SMA, EMA, etc., based on user preference. This smoothing process helps in highlighting the overall trend direction and potential reversal points with greater clarity.
Furthermore, the indicator employs a color-coding system, where the plotted line changes color based on the momentum's direction—shifting to an up color for positive momentum and a down color for negative momentum. This visual cue enables traders to quickly discern the market trend at a glance.
Divergences between the price action and the indicator's values are another cornerstone of this tool. By plotting potential bullish and bearish divergences, the indicator provides early signals of possible trend reversals, offering traders a strategic advantage.
Embrace the power of our 🌌 Multi-Spectral RSI Deviations and elevate your trading to stellar heights! 🌠✨
Rsi_divergence

Wiseball RSI Super Advanced Divergences | EssentialThis indicator is a cutting-edge tool designed to elevate your trading strategy by identifying both regular and hidden RSI divergences with unparalleled precision. Moreover, this indicator uniquely offers the capability to visualize divergences as they are forming ("anticipated"), a feature that stands out for its originality and innovation.
Unique Features and How They Work:
This tool distinguishes itself by leveraging its Divergences Detection System (DDS), which incorporates advanced algorithms to analyze market movements and oscillator behavior beyond the capabilities of existing open-source scripts. Here's a brief overview of what makes DDS uniquely effective:
Anticipated and Projected Divergences: DDS goes beyond mere detection of existing divergences. It offers insights into divergences that are currently forming and even projects potential future divergences by analyzing current trends and oscillator levels. This forward-looking feature empowers traders to anticipate market movements, offering a strategic advantage.
Comprehensive Pivot Analysis: Unlike typical divergence indicators, such as the "RSI Divergence Indicator," which only identifies divergences between two consecutive pivots, DDS is engineered to analyze as many previous pivots as the user's configuration allows (duration min/max). This capability ensures that no potential trend or extended divergence is overlooked, providing a more thorough market analysis.
Multiple Divergences Detection: Our system is capable of detecting multiple divergences within the same timeframe. For instance, it can identify a significant bearish divergence alongside a minor bullish divergence, offering a nuanced view of market dynamics that other indicators might miss.
Extensive Customization Options: DDS provides an array of configuration settings, allowing traders to tailor the detection system to their specific needs. Whether adjusting for sensitivity, timeframes, or specific divergence types, these customization options ensure that the tool can adapt to various trading strategies and preferences.
Our commitment to continuous development means that we regularly update the script based on user feedback, ensuring that it remains at the forefront of trading technology.
How to Use This Script:
Setup: Search for "Wiseball RSI Super Advanced Divergences" in the TradingView indicator library. Easily add the script to your TradingView chart and adjust the settings according to your trading preferences.
Analysis: The script automatically identifies divergences and highlights them on your chart, using color-coded lines and patterns for easy interpretation.
Action: Customize alerts to notify you of new divergences, enabling timely trading decisions based on the script's analysis.
Note: This indicator is best used on a dark background, as it has been optimized for this.
Divergence Style Coding:
Bullish Regular Divergence: Green
Bullish Hidden Divergence: Blue
Bearish Regular Divergence: Red
Bearish Hidden Divergence: Orange
Confirmed Divergence: Solid opaque line
Anticipated Divergence: Dotted line in the type's color
Projected Divergence: Dashed line in the type's color
Understand Technical and practical limitations:
This indicator is designed to facilitate ease of use, correspond to standard practices, and cover your essential needs. DDS options are limited to the essentials for simplicity and ease of use. Moreover, these limitations allow for reduced calculation time and a smooth display.
It is limited to displaying 100 divergences, and the number of bars analyzed is fixed at 960. Use the replay mode to view past divergences.
Divergences sharing the same endpoint are limited to the divergence with the longest duration.
Divergences of the same type that cross or share the same time space are filtered to display only one.
The maximum duration of divergences is set to 120 bars.
Anticipated divergences but not projected ones.
Note: As with all trading tools, it's crucial to use this indicator in conjunction with other indicators and fundamental analysis to validate your trading decisions. Our tools are designed to provide you with valuable insights, not to predict the future. Always conduct your research and trade responsibly.

Divergence Signal [TradingFinder] RSI & MACD Reversal On Swing🔵 Introduction
Sometimes in analyzing price charts using indicators, you may observe a discrepancy. For instance, while the price of stocks, currencies, or commodities is increasing, the indicator shows a decrease. Such a phenomenon in technical analysis is termed "divergence." Divergences are categorized into three types based on their formation and the prediction they make about the continuation of the price trend: "Regular Divergence," "Hidden Divergence," and "Time Divergence."
🟣 Important :
• This indicator exclusively identifies regular divergences since its primary function is to detect reversal points.
• This indicator identifies divergences using three indicators: "Moving Average Convergence Divergence" (MACD), "Relative Strength Index" (RSI), and "Awesome Oscillator" (AO). The user can choose each of these indicators in the settings using the "Divergence Detection Method" dropdown menu for identifying divergences. These settings are by default set to the MACD mode.
🔵Types of Divergence
Divergences, as mentioned, offer different predictions about the continuation of price trends. Hence, they have various types. We will focus on explaining regular divergences based on this indicator.
🟣 Regular Divergence(RD) :
Regular divergence is a situation arising from contradictory behavior between the indicator and the price chart at the end of a trend. By identifying regular divergences, we anticipate a change in trend direction resembling a reversal pattern.
Regular divergence has two types based on the trend and prediction:
Negative Regular Divergence (RD-) :
This type occurs between two price peaks at the end of an uptrend. Despite forming a new high, the indicator fails to recognize it, indicating a negative regular divergence. The likelihood of a subsequent downtrend is high. Negative divergence suggests strong selling pressure and weak buying power, portraying an unfavorable future for the stock.
Positive Regular Divergence (RD+) :
In contrast, positive regular divergence happens at the end of a downtrend and between two price troughs. As depicted in the chart, although the price forms a new low, the indicator doesn't acknowledge it. Positive regular divergence indicates robust buying pressure and weak selling power. Upon identifying positive divergence in the chart, we expect a price increase for the stock under review
🔵 How to Use
Information from the indicator is displayed in two ways: Table and Label.
🟣 Table : The table displays information about the latest divergence. This includes the type of divergence, existence or absence of divergence, consecutive divergences, divergence quality, and change in indicator phase.
Type Divergence : Indicates the type of divergence, which can be either "Bullish Divergence" or "Bearish Divergence."
Exist : Indicates the presence of divergence with a "+" sign and absence with a "-" sign. A green color is used for bullish divergence and red for bearish divergence.
Consecutive : Shows the number of consecutive divergences. For example, if there are 3 consecutive divergences, the number 3 is displayed.
Divergence Quality : Displays the quality of the divergence based on the number of consecutive divergences. If there is 1 divergence, the quality is "Normal"; for 2 divergences, it's "Good"; and for 3 or more divergences, it's "Strong."
Change Phase Indicator : Indicates whether a phase change in the indicator has occurred with "+" for yes and "-" for no.
🟣 Label : Unlike the table, which only shows information about the latest divergence, labels display information about each divergence at the point where it occurs. The information includes the type of divergence, detection method, divergence quality, consecutive divergences, and change in phase indicator. The selected method of detection is also displayed. For example, if the chosen method is the "AO" indicator, the label will show "Method: AO."
🔵 Settings
Fractal Period : Determines the period of swings. The minimum and default value is 2.
Divergence Detect Method : Selects the indicator (MACD, RSI, or AO) used for detecting divergences. The default indicator is MACD.
Show Fractal : Chooses whether to display fractals or not. The default is "No."
Show Table : Determines whether to display the table or not. The default is "Yes."
Show Label : Chooses whether to display labels or not. The default is "Yes."
Label Size : Adjusts the size of the labels from "Tiny" to "Large."

Economic Growth Index (XLY/XLP)Keeping an eye on the macroeconomic environment is an essential part of a successful investing and trading strategy. Piecing together and analysing its complex patterns are important to detect probable changing trends. This may seem complicated, or even better left to experts and gurus, but it’s made a whole lot easier by this indicator, the Economic Growth Index (EGI).
Common sense shows that in an expanding economy, consumers have access to cash and credit in the form of disposable income, and spend it on all sorts of goods, but mainly crap they don’t need (consumer discretionary items). Companies making these goods do well in this phase of the economy, and can charge well for their products.
Conversely, in a contracting economy, disposable income and credit dry up, so demand for consumer discretionary products slows, because people have no choice but to spend what they have on essential goods. Now, companies making staple goods do well, and keep their pricing power.
These dynamics are represented in EGI, which plots the Rate of Change of the Consumer Discretionary ETF (XLY) in relation to the Consumer Staples ETF (XLP). Put simply, green is an expanding phase of the economy, and red shrinking. The signal line is the market, a smoothed RSI of the S&P500. Run this on a Daily timeframe or higher. Check it occasionally to see where the smart money is heading.

Confluence Buy-Sell Indicator with Fibonacci The script is a "Confluence Indicator with Fibonacci" designed to work on the TradingView platform. This indicator combines multiple technical analysis strategies to generate buy and sell signals based on user-defined confluence criteria. Here's a breakdown of its features:
Confluence Criteria: Users can enable or disable various strategies like MACD, RSI, Bollinger Bands, Divergence, Fibonacci, and Moving Average. The number of strategies that need to align for a signal to be generated can be set by the user.
Strategies Included:
MACD Strategy: Uses the Moving Average Convergence Divergence method to identify buy/sell opportunities.
RSI Strategy: Utilizes the Relative Strength Index to detect overbought or oversold conditions.
Bollinger Bands Strategy: Incorporates Bollinger Bands to identify volatility and potential buy/sell signals.
Divergence Strategy: A basic implementation that detects bullish and bearish divergences using the RSI.
Fibonacci Strategy: Uses Fibonacci retracement levels to determine potential support and resistance levels.
Moving Average Strategy: Employs a crossover system between the 50-period and 200-period simple moving averages.
Additional Features:
Support & Resistance: Identifies major support and resistance levels from the last 50 bars.
Pivot Points: Calculates pivot points to determine potential turning points.
Stop Loss Levels: Automatically calculates and plots stop-loss levels for buy and sell signals.
NYC Midnight Level: Option to display the New York City midnight price level.
Visualization: Plots buy and sell signals on the chart with green and red markers respectively.
Adequate Category:
"Technical Analysis Indicators & Overlays" or "Strategy & Scripting Tools".

Volume-Weighted RSI [wbburgin]The Volume-Weighted RSI takes a new approach to the traditional calculation of the RSI in using a price::volume calculation. As some traders consider volume to be a leading indicator for price, the volume-weighted RSI can come in handy if you want to visualize volume easier.
Usage
This indicator builds the RSI from the square of the volume change and the price. If the volume decreases rapidly with the price, the volume-weighted RSI will fall; if the volume increases rapidly with the price, the volume-weighted RSI will rise.
You may notice crosses and circles appearing above and below the indicator. These indicate abnormal volume or price:
A green cross indicates abnormal upward price
A red cross indicates abnormal downward price
A green circle indicates abnormal positive volume
A red circle indicates abnormal negative volume
A green bar indicates both abnormal price and volume (positive), while a red bar indicates both abnormal price and volume (negative).
The thresholds of what are considered "normal" and "abnormal" are controlled by the "SD Multiple" in your settings (standard deviation). A higher multiple will make less of these signals occur, and you can turn them and the bars off at any time.
I have a built-in Light Style and Dark Style so that your preference of background won't affect seeing the indicator. You can also change the colors and the overbought/oversold lines in your settings.

Bollinger RSI BandsIndicator Description:
The "Bollinger RSI Bands" is an advanced technical analysis tool designed to empower traders with comprehensive insights into market trends, reversals, and overbought/oversold conditions. This multifaceted indicator combines the unique features of candle coloration and Bollinger Bands with the Relative Strength Index (RSI), making it an indispensable tool for traders seeking to optimize their trading strategies.
Purpose:
The primary purpose of the "Bollinger RSI Bands" indicator is to provide traders with a holistic view of market dynamics by offering the following key functionalities:
Candle Coloration: The indicator's signature candle colors - green for bullish and red for bearish - serve as a visual representation of the prevailing market trend, enabling traders to quickly identify and confirm market direction.
RSI-Based Moving Average: A smoothed RSI-based moving average is plotted, facilitating the detection of trend changes and potential reversal points with greater clarity.
RSI Bands: Upper and lower RSI bands, set at 70 and 30, respectively, help traders pinpoint overbought and oversold conditions, aiding in timely entry and exit decisions.
Bollinger Bands: In addition to RSI bands, Bollinger Bands are overlaid on the RSI-based moving average, offering insights into price volatility and highlighting potential breakout opportunities.
How to Use:
To maximize the utility of the "Bollinger RSI Bands" indicator, traders can follow these essential steps:
Candle Color Confirmation: Assess the color of the candles. Green candles signify a bullish trend, while red candles indicate a bearish trend, providing a clear and intuitive visual confirmation of market direction.
Overbought and Oversold Identification: Monitor price levels relative to the upper RSI band (70) for potential overbought signals and below the lower RSI band (30) for potential oversold signals, allowing for timely adjustments to trading positions.
Trend Reversal Recognition: Observe changes in the direction of the RSI-based moving average. A transition from bearish to bullish, or vice versa, can serve as a valuable signal for potential trend reversals.
Volatility and Breakout Opportunities: Keep a watchful eye on the Bollinger Bands. Expanding bands signify increased price volatility, often signaling forthcoming breakout opportunities.
Why Use It:
The "Bollinger RSI Bands" indicator offers traders several compelling reasons to incorporate it into their trading strategies:
Clear Trend Confirmation: The indicator's distinct candle colors provide traders with immediate confirmation of the current trend direction, simplifying trend-following strategies.
Precise Entry and Exit Points: By identifying overbought and oversold conditions, traders can make more precise entries and exits, optimizing their risk-reward ratios.
Timely Trend Reversal Signals: Recognizing shifts in the RSI-based moving average direction allows traders to anticipate potential trend reversals and adapt their strategies accordingly.
Volatility Insights: Bollinger Bands offer valuable insights into price volatility, aiding in the identification of potential breakout opportunities.
User-Friendly and Versatile: Despite its advanced features, the indicator remains user-friendly and versatile, catering to traders of all experience levels.
In summary, the "Bollinger RSI Bands" indicator is an indispensable tool for traders seeking a comprehensive view of market dynamics. With its unique combination of candle coloration and Bollinger Bands, it empowers traders to make more informed and strategic trading decisions, ultimately enhancing their trading outcomes.
Note: Always utilize this indicator in conjunction with other technical and fundamental analysis tools and exercise prudence in your trading decisions. Past performance is not indicative of future results.

Heuristic Bg Color Hodl/swing/scalp [Ox_kali]The "Heuristic BG Color Hodl/Swing/Scalp " is a multi-faceted technical indicator designed to aid traders across varying investment strategies such as long-term holding (Hodl), swing trading, and scalping. Optimized to run on a range of timeframes from seconds to months. Built upon an intricate layering of moving averages, market oscillators. The indicator displays a color range from light green to deep red, based on market conditions. This tool aims to provide an analytical edge by visualizing market conditions in a straightforward manner. Incorporating both trend-following and oscillatory components both trend-following and oscillating components to furnish a more rounded view of the market. Note that this indicator is best used in conjunction with other forms of market analysis and should not be solely relied upon for making trading decisions.
Key Features:
Multiple Moving Averages: Utilizes Fast and Slow MAs to identify trend momentum.
Modified RSI and MFI: Incorporates RSI and MFI to gauge overbought and oversold conditions.
Stoch RSI Indicator: Used to provide additional confirmation for trading signals.
Dynamic Background Color: Highlights potential Buy and Sell zones using background color for easier visual interpretation.
Alert Conditions: Trigger customizable alerts for Buy and Sell zones.
Functionality Analysis:
The script allows you to select the type and period for Fast and Slow moving averages. It uses these MAs to calculate an underlying trend momentum, further refined by a user-defined MA.
The RSI and MFI are used to identify overbought and oversold conditions calculated and smoothed over a user-defined period. The Stoch RSI gives an additional layer of confirmation, allowing traders to identify more reliable trading signals.
The script's main visual feature is the background color, which changes based on potential Buy and Sell zones. It provides two layers for each, enabling traders to understand the strength of the signal. Notably, the indicator is particularly optimized for identifying Buy Zones and is more functional for detecting Sell Zones when applied to larger timeframes.
Trading Application:
The "Heuristic BG Color Hodl/Swing/Scalp" indicator can adapt to various trading styles, from long-term investment to short-term trading. When the background turns green, it signifies a potential Buy Zone, ideal for entering long positions. Conversely, a red background indicates a Sell Zone, suggesting it may be a good time to exit positions or go short.
Traders can also utilize the alert conditions set within the script to receive real-time notifications, making it easier to capitalize on potential market opportunities.
Please note that the "Heuristic BG Color Hodl/Swing/Scalp" by Ox_kali is intended for educational purposes only and does not constitute financial advice. This indicator is not a guarantee of future market performance and should be used alongside proper risk management strategies. Ensure you fully understand the methodology and limitations of this indicator before making any trading decisions. Past performance is not indicative of future results.

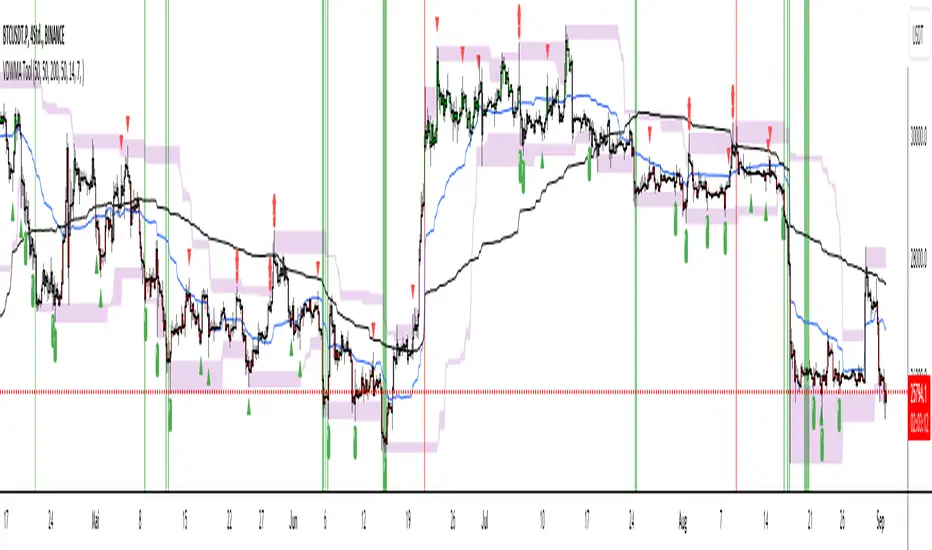
Trade Tool VDWMA + OI RSI BasedThis indicator works only for symbols where open interest data is available.
The idea was to create a combination of Volume Delta, Open Interest, RSI, Moving Average and Support / Resistance as a unified tool.
I created a Weighted Moving Average based on the Volume Delta (VDWMA). The idea behind this was to reflect the moving average on the difference between buy and sell volume.
There are two VDWMA to determine a trend. Fast and Slow. The principle is the same as with conventional moving averages. For visualization, the candles are colored based on the following logic:
up trend = Fast VDWMA is above the Slow VDWMA and the price is above the Fast VWDWMA.
down Trend = Fast VDWMA is below the Slow VDWMA and the Short is below the Fast VDWMA
Further, support and resistance zones were defined based on the close and high prices as well as close and low prices.
A simple logic looks for divergences between RSI and price to generate first signals for possible price reversals.
Another RSI was created based on the open interest.
In combination with the conventional RSI, oversold and overbought zones were defined based on the following logic, which are marked by vertical zones on the chart.
Oversold zone = RSI is below 30 and OI RSI is above 70 or below 30 and OI opening is not greater than OI closing price
Overbought zone = RSI is above 70 and OI RSI is above 70 or below 30 and OI opening is not smaller than OI closing price
Based on this, buy and sell signals were defined.
First, the support or resistance zone must remain the same for two candles, which signals that the zone has not been breached. In addition, a divergence must occur in the RSI and the price must bounce.
newsell = resistance == resistance and high >= resistance and close < resistance and bearishDiv
newbull = support == support and low <= support and close > support and bullishDiv
The OI signaling was deliberately not included as well as the trend function. The tool should be suitable for scalping as well as for swinging. Thus, depending on the tradestyle itself to decide which points you want to trade.
Have fun with it
Ultimate RSI [LuxAlgo]The Ultimate RSI indicator is a new oscillator based on the calculation of the Relative Strength Index that aims to put more emphasis on the trend, thus having a less noisy output. Opposite to the regular RSI, this oscillator is designed for a trend trading approach instead of a contrarian one.
🔶 USAGE
While returning the same information as a regular RSI, the Ultimate RSI puts more emphasis on trends, and as such can reach overbought/oversold levels faster as well as staying longer within these areas. This can avoid the common issue of an RSI regularly crossing an overbought or oversold level while the trend makes new higher highs/lower lows.
The Ultimate RSI crossing above the overbought level can be indicative of a strong uptrend (highlighted as a green area), while an Ultimate RSI crossing under the oversold level can be indicative of a strong downtrend (highlighted as a red area).
The Ultimate RSI crossing the 50 midline can also indicate trends, with the oscillator being above indicating an uptrend, else a downtrend. Unlike a regular RSI, the Ultimate RSI will cross the midline level less often, thus generating fewer whipsaw signals.
For even more timely indications users can observe the Ultimate RSI relative to its signal line. An Ultimate RSI above its signal line can indicate it is increasing, while the opposite would indicate it is decreasing.
🔹 Smoothing Methods
Users can return more reactive or smoother results depending on the selected smoothing method used for the calculation of the Ultimate RSI. Options include:
Exponential Moving Average (EMA)
Simple Moving Average (SMA)
Wilder's Moving Average (RMA)
Triangular Moving Average (TMA)
These are ranked by the degree of reactivity of each method, with higher ones being more reactive (but less smooth).
Users can also select the smoothing method used by the signal line.
🔶 DETAILS
The RSI returns a normalized exponential average of price changes in the range (0, 100), which can be simply calculated as follows:
ema(d) / ema(|d|) × 50 + 50
where d represent the price changes. In order to put more emphasis on trends we can put higher weight on d . We can perform this on the occurrence of new higher highs/lower lows, and by replacing d with the rolling range instead (the rolling period used to detect the higher highs/lower lows is equal to the length setting).
🔶 SETTINGS
Length: Calculation period of the indicator
Method: Smoothing method used for the calculation of the indicator.
Source: Input source of the indicator
🔹 Signal Line
Smooth: Degree of smoothness of the signal line
Method: Smoothing method used to calculation the signal line.

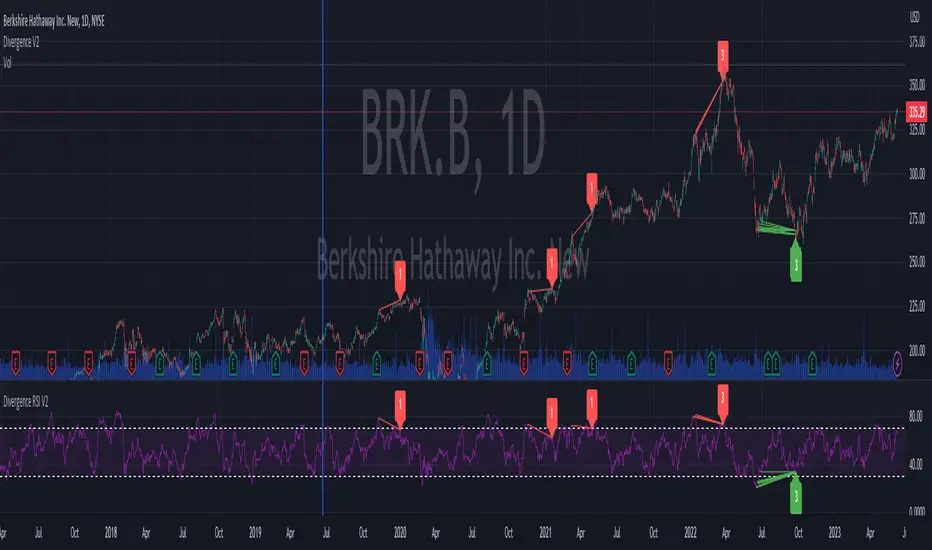
RSI + Divergences + Alerts [MisterMoTA]The indicator RSI + Divergences + Alerts by MisterMoTA is an RSI indicator that fills the RSI and RSI moving average with 4 different colors (growing up, falling up, falling down and rising down colors), users can customize colors from dashboard , also can be disabled the fill if the user want a standard RSI.
The dafault value of RSI is 14 and value of the moving average is 50 ( a dynamic 50 rsi line is better for trend identification than a standard 50 line) and users can change the values from indicator settings.
For detecting the divergences displayed in the indicator, I integrated in our script the default Divergences indicator from Tradingview, users can display, hide and change colors for regular and hidden divergences.
RSI indicator display also trend conditions for RSI and RSI MA, the RSI MA angle is calculated using ATR value, the slope of the RSI Noving Average can help to identify trend conditions too.
The script comes with 12 different alerts, if need different alerts please let me know in the comments and will update the script with your request:
Alert for Regular Bullish Divergence
Alert for Regular Bearish Divergence
Alert for Hidden Bullish Divergence
Alert for Hidden Bearish Divergence
Alert for RSI Overbought
Alert for RSI Extreme Overbought
"Alert for RSI Oversold
Alert for RSI Extreme Oversold
Alert for RSI Crossing Above RSI MA
Alert for RSI Crossing Bellow RSI MA
Alert for RSI Crossing Above 50
Alert for RSI Crossing Bellow 50
Please follow me for other script like this one.
Kind regards,
MisterMoTA

RSI with Close & Tail DivergencesRSI divergence is a cornerstone signal for both stock and cryptocurrency traders, renowned for its reliability.
The basis for measuring divergence can vary:
Historically, it's been determined by the candlestick's closing price.
However, a contemporary approach uses the tail values, specifically the high and low prices, of the candlestick.
Depending on the criteria selected, the resultant signals can be markedly different.
Our innovative indicator offers:
Divergence tracking based on the closing price of the candlestick.
Divergence tracking considering the candlestick's peak and trough values.
A unique convergence of both types of divergence signals.
With this tool, traders are empowered to make informed decisions, anchored in precise divergence cues.
This indicator boasts the following capabilities:
Displays divergence based on closing price, highs/lows, as well as a unique combined criterion.
Highlights pivot points.
Denotes divergence spots on the RSI chart with lines.
Offers a background color representation instead of labels.

RSI Screener Multi Timeframe [5ema]This indicator is the simple version of my indicator: RSI Screener and Divergence .
Only show table with values, signals at 5 custom timeframes.
-----
I reused some functions, made by (i believe that):
©paaax: The table position function.
@kingthies: The RSI divergence function.
@QuantNomad: The function calculated value and array screener for 40+ instruments.
I have commented in my code. Thanks so much!
-----
How it works:
1. Input :
Length of RSI => calculate RSI.
Upper/lower => checking RSI overbought/oversold.
Right bars / left bars => returns price of the pivot low & high point => checking divergence.
Range upper / lower bars => compare the low & high point => checking divergence.
Timeframe => request.security another time frame.
Table position => display screener table.
2. Input bool:
Regular Bearish divergence.
Hidden Bullish divergence .
Hidden Bearish divergence.
3. Basic calculated:
Make function for RSI , pivot low & high point of RSI and price.
Request.security that function for earch time frame.
Result RSI, Divergence.
4. Condition of signal:
Buy condition:
RSI oversold (1)
Bullish divergence (2).
=> Buy if (1) and (2), review buy (1) or (2).
Sell condition:
RSI overbought (3).
Bearish divergence (4).
=> Sell if (3) and (4), review sell (3) or (4).
-----
Table screener:
Time frame.
RSI (green - oversold, red - overbought)
Divergence (>> - regular bullish , << regular bearish , > - hidden bullish , < - hidden bearish ).
Signal (green ⦿ - Buy, red ⦿ - Sell, green 〇 - review buy, red 〇 - review sell).
- Regular Bearish divergence:
- Regular Bullish divergence:
- Regular Bullish divergence + RSI overSold
- Regular Bearish divergence + RSI overBought
-----
This indicator is for reference only, you need your own method and strategy.
If you have any questions, please let me know in the comments.

RSI-all in one_Pro[vn]👉Hello traders.
Introducing the " RSI all-in-one " Bot that includes the functions:
+ Automatically scan RSI divergence
+ Automatically scan RSI trendlines
+ Create an alert when there is a golden signal (RSI creates a divergence and then breaks its trendline, signaling a trend reversal)
Explain:
During trading when using the indicator "RSI - trendlines - div " in my library on TW web page:
- I have an idea to create a Bot indicator about "Automatically scan RSI divergences and trendlines". Because those are the top strengths when traders use the RSI to forecast trend reversals.
- On each chart of the trading pair, the RSI draws the trendline pair as: uptrendline and downtrendline (closest to the RSI)
- So when the statistics on "Bot" also shows the column of RSI trendlines up and the column of RSI trendlines down
- Column |════🡹 \ʀꜱɪ| - is the above RSI trendline
- Column |ʀꜱɪ \════🡻| - is the below RSI trendline
- When RSI approaches any one of its trendlines and the ratio is 10%, then:
+ in column |✎ \𝖙.𝖑𝖎𝖓𝖊| Red colored digits (downtrend)
+ in column |𝖙.𝖑𝖎𝖓𝖊 \✐| blue colored digits (uptrend)
Is the value of the RSI trendline for traders to pay more attention to when it can be the entry and exit points according to the resistance and support nature of the RSI trendlines.
- When the RSI breaks the above trendline, it shows is "🡹", if it is the first candle, at the column |════🡹 \ʀꜱɪ| it shows as "🡹1|1|1" the cell turns green , that's the RSI signal breaking the line. Its resistance to go up, wait for the candle to close, we can enter "Buy/Long" order.
- When the RSI line breaks below the trendline, it shows is "🡻", if it is the first candle, then at the column |ʀꜱɪ \════🡻| it displays as "🡻1|1|1" the cell turns red , that's the RSI signal breaking the line Support to continue down, wait for the candle to close, we can enter "Sell/Short" order
- The parameter when breaking shows 10|10|10, it means that the RSI has broken 10 candles (RSI candles), and the first 10 candles are colored green (bullish) red (bearish) then hidden. (can be changed in settings). In addition, when displaying the parameters of the cell as above, the column |✎ \𝖙.𝖑𝖎𝖓𝖊| and |𝖙.𝖑𝖎𝖓𝖊 \✐| will show the percentage from when the RSI break point to the current RSI (closed)
- Column |𝚍𝚒𝚟| is a divergence signal. When the price makes a new high, a new low, and the RSI signals a divergence, it will start to increase the base from the number 1. From here, the Trader will know which trading pair is starting to divergence RSI. Cell is Green bullish divergence, Cell is red bearish divergence
- Column|🆁🆂🅸| is the current RSI .{🟢} RSI above the cloud , {🔴} RSI below the cloud , {⚪️} RSI in the cloud(RSI clouds also indicate very well the support and resistance zone of RSI)
- There are 5 warning functions on this indicator
- The parameter {20:2} is the length of the RSI trendline and combines the same parameters with the "RSI - trendlines - div{vn}" indicator when analyzing
💥 Summary:
Trading methods with this indicator:
+ Trade when there is a divergence
+ Trade when the RSI approaches its trendline (it is the support and resistance line of the RSI)
+ Trade when the RSI breaks the trendline (definitively above or below)
+ Trade when there is a divergence then after a few candles, RSI breaks through its trendline, giving a golden signal.
1 . image
Later(sau đó)
2 . image
Later(sau đó)
Note: The indicator can create up to 40 trading pairs, so traders should choose a super nice signal to enter orders.
-----------------------------------------------------Vietnamese-------------------------------------------------------
👉Xin chào các nhà giao dịch VietNam.
xin giới thiệu Bot "RSI-Tất cả trong một " bao gồm các chức năng:
+ Tự động quét phân kì RSI
+ Tự động quét đường xu hướng RSI
+ Tạo cảnh báo khi có tín hiệu vàng(RSI tạo phân kì và sau đó phá vỡ đường xu hướng của nó báo hiệu đảo chiều xu hướng)
Diễn giải:
- Trong quá trình giao dịch khi dùng chỉ báo "RSI - trendlines - div " trong thư viện của tôi trên trang TW . Tôi có ý tưởng tạo chỉ báo Bot về " Tự động quét phân kì và đường xu hướng của RSI ". Vì đó là những điểm mạnh hàng đầu khi nhà giao dịch sử dụng chỉ báo RSI để dự báo đảo chiều xu hướng.
- Trên mỗi biểu đồ của cặp giao dịch, chỉ báo RSI vẽ cặp trendline là: trendline tăng và trendline giảm (gần với RSI nhất)
- Vì vậy khi thống kê trên " Bot " cũng hiển thị cột của RSI trendlines tăng và cột của RSI trendlines giảm
- Cột |════🡹 \ʀꜱɪ| - là trendline RSI bên trên
- Cột |ʀꜱɪ \════🡻|- là trendline RSI bên dưới
- Khi RSI phá đường xu hướng bên trên thì nó hiển thị là "🡹", nếu là cây nến đầu tiên thì tại cột |════🡹 \ʀꜱɪ| nó hiển thị là "🡹1|1|1" ô đổi màu xanh , đó là tín hiệu RSI phá vỡ đường kháng cự của nó để đi lên , chờ nến đóng cửa ta có thể vào lệnh "Buy/Long"
- Khi đường RSI phá đường xu hướng bên dưới thì nó hiển thị là "🡻", nếu là cây nến đầu tiên thì tại cột |ʀꜱɪ \════🡻| nó hiển thị là "🡻1|1|1" ô đổi màu đỏ , đó là tín hiệu RSI phá vỡ đường hỗ trợ để xuống tiếp , chờ nến đóng cửa ta có thể vào lệnh "Sell/Short "
-Khi RSI tiến gần đến 1 đường trendline bất kì của nó mà tỉ lệ còn 10% thì:
+ tại cột |✎ \𝖙.𝖑𝖎𝖓𝖊| chữ số tô màu đỏ (trend giảm)
+ tại cột |𝖙.𝖑𝖎𝖓𝖊 \✐| chữ số tô màu xanh (trend tăng)
Là giá trị của đường trendline RSI để trader chú ý hơn khi đó có thể là điểm vào lệnh và thoát lệnh theo tính chất kháng cự hỗ trợ của RSI trendlines.
-Thông số khi phá vỡ hiển thị 10|10|10 thì hiểu là RSI đã phá vỡ 10 nến(nến RSI), và 10 nến đầu tiên được tô màu xanh(tăng giá) màu đỏ (giảm giá) sau đó được ẩn(có thể thay đổi trong cài đặt). Ngoài ra khi hiện thông số của ô như trên thì cột |✎ \𝖙.𝖑𝖎𝖓𝖊| và |𝖙.𝖑𝖎𝖓𝖊 \✐| sẽ hiển thị được số phần trăm tính từ khi điểm RSI phá vỡ đến RSI hiện tại(đóng cửa)
Cột |𝚍𝚒𝚟| là tín hiệu phân kì . Khi giá tạo đỉnh mới, đáy mới mà RSI báo tín hiệu là phân kì thì nó sẽ bắt đầu cơ số đếm từ số 1 tăng dần lên.Từ đây Trader sẽ biết được cặp giao dịch nào đang bắt đầu phân kì RSI. Ô màu xanh là phân kì tăng, ô màu đỏ là phân kì giảm
- Cột| 🆁🆂🅸 | là RSI hiện tại .{🟢} RSI trên mây , {🔴} RSI dưới mây , {⚪️} RSI trong mây(Mây của RSI cũng cho biết rất tốt vùng hỗ trợ, kháng cự của RSI)
- Có 5 chức năng cảnh báo trên chỉ báo này
- Thông số {20:2} là độ dài đường trendline RSI và kết hợp cùng thông số với chỉ báo "RSI - trendlines - div{vn}" khi phân tích
💥 Tổng kết:
Các phương pháp giao dịch với chỉ báo này:
+ Giao dịch khi có phân kì.
+ Giao dịch khi RSI tiếp cận đến đường xu hướng của nó(nó là đường hỗ trợ, kháng cự của RSI).
+ Giao dịch khi RSI phá vỡ đường xu hướng(trên hoặc dưới cách dứt khoát).
+ Giao dịch khi có phân kì sau đó qua vài nến, RSI phá vỡ qua đường xu hướng của nó báo hiệu tín hiệu vàng.
Lưu ý : Chỉ báo tạo được tối đa 40 cặp giao dịch, nên AE trader Việt cứ chọn tín hiệu siêu đẹp để vào lệnh nhé.

RSI Supreme Multi-Method [MyTradingCoder]Introducing the "RSI Supreme Multi-Method" indicator, a powerful tool that combines the Relative Strength Index (RSI) with selectable manipulation methods to identify overbought and oversold conditions in the market, along with the ability to detect divergences for enhanced trading insights.
The indicator features four distinct manipulation methods for the RSI, each providing valuable insights into market conditions:
1. Standard RSI Method: The indicator uses the traditional RSI calculation to identify overbought and oversold areas.
2. Volatility Weighted RSI Method: This method applies a volatility formula to the RSI calculation, allowing for a more responsive indication of market conditions during periods of heightened volatility. Users can adjust the length of the volatility formula to fine-tune this method.
3. Smoothed RSI Method: The smoothed RSI method utilizes a smoothing algorithm to reduce noise in the RSI values, presenting a clearer representation of overbought and oversold conditions. The length of the smoothing can be adjusted to match your trading preferences.
4. Session Weighted RSI Method: With this innovative method, users can specify multipliers for different time sessions throughout the day to manipulate the base RSI. Each session can be customized with start and end times, enabling or disabling specific sessions, and specifying the multiplier for each session. This feature allows traders to adapt the RSI to different market sessions dynamically.
Additionally, the "RSI Supreme Multi-Method" indicator draws divergences on the oscillator, providing an extra layer of analysis for traders. Divergences occur when the direction of the RSI differs from the direction of the price movement, potentially signaling trend reversals.
Key Settings:
RSI Length: Adjust the length of the base RSI before applying any manipulation.
RSI Source: Determine the data source for the base RSI calculation.
Overbought Value: Set the RSI value at which overbought conditions are indicated.
Oversold Value: Set the RSI value at which oversold conditions are indicated.
RSI Type: Choose from four options: Standard, Smoothed, Volatility Manipulated, or Session Manipulated.
Volatility Manipulated Settings: Adjust the length of the volatility formula (applicable to Volatility Manipulated method).
Smoothed Settings: Adjust the length of the smoothing (applicable to Smoothed method).
Session Manipulated Settings: Customize six different time sessions with start and end times, enable or disable specific sessions, and specify multipliers for each session.
Divergence Color: Adjust the color of the drawn divergences to suit your chart's aesthetics.
Divergence Tuning: Fine-tune the sensitivity of the divergence detection for more accurate signals.
The "RSI Supreme Multi-Method" indicator is a versatile and comprehensive tool that can be used to identify overbought and oversold areas, as well as to spot potential trend reversals through divergences. However, like all technical analysis tools, it should be used in conjunction with other indicators and analysis methods to make well-informed trading decisions.
Enhance your trading insights with the "RSI Supreme Multi-Method" indicator and gain an edge in identifying critical market conditions and divergences with precision.

RSI Divergence Screener by zdmreThis screener tracks the following for up to 20 assets:
-All selected tickers will be screened in same timeframes (as in the chart).
-Values in table indicate that how many days passed after the last Bullish or Bearish of RSI Divergence.
For example, when BTCUSDT appears Bullish-Days Ago (15) , Bitcoin has switched to a Bullish Divergence signal 15 days ago.
Thanks to @QuantNomad and @MUQWISHI for building the base for this screener.
*Use it at your own risk
Note:
Screener shows the information about the RSI Divergence Scanner by zdmre with default settings.
Based indicator:

Custom Range Creator + Normalized Oscillators (Obv, Rsi, Mfi) Hello Traders!
Custom Range Creator is a specialized trading tool designed for traders who incorporate range analysis into their trading strategy.
Once you set the desired number of past candles or provide a manual input, the indicator will automatically draw a range for you. This unique feature allows you to customize the range based on the highest and lowest points within a specified number of bars, known as the "Dynamic Range." Furthermore, you have the flexibility to define up to three additional ranges manually using custom inputs. The lines and labels associated with these ranges can be fully customized in terms of style, color, and width to align with your personal preferences.
Dynamic Range Capabilities:
The indicator automatically generates a range by default, identifying the highest and lowest points within the last 200 bars. However, you have the ability to define the number of bars back by adjusting the setting in the menu. Moreover you can define the range based on either the wicks or the bodies of the candles.
The range includes the following components:
☀ Range High: The highest price point within the selected number of bars in the past
☀ Range Low: The lowest price point within the selected number of bars in the past
☀ Range Mid-Point: The calculated middle value between the Range High and Range Low
☀ First Quartile (Q1): The midpoint between the Range Low and the Range Mid-Point, effectively identifying the 25% level within the range
☀ Third Quartile (Q3): The midpoint between the Range Mid-Point and the Range High, identifying the 75% level within the range
By incorporating these critical levels within a price range, our Dynamic Range provides you with a comprehensive view of how the market evolves, enabling you to make more informed trading decisions.
Manual Ranges Capabilities:
In addition to the Dynamic Range, you can manually define up to three more ranges. By specifying your desired high and low price values as inputs, the system automatically draws the range based on your inputs. Once drawn, you can further adjust the range using the bar offset option, which allows you to shift the entire range backward or forward by a specified number of bars.
Each manually defined range includes the following components:
☀ Range High: Your user-defined highest price point
☀ Range Low: Your user-defined lowest price point
☀ Range Mid-Point: The calculated middle value between the Range High and Range Low
☀ First Quartile (Q1): The midpoint between the Range Low and the Range Mid-Point, identifying the 25% level within the range
☀ Third Quartile (Q3): The midpoint between the Range Mid-Point and the Range High, identifying the 75% level within the range
This allows you to precisely define your desired price range and visually represent it on the chart. The customizable manual ranges provide you with a powerful tool for analyzing price dynamics and identifying potential support and resistance levels.
Both Dynamic Range and Manual Ranges Capabilities:
a) Timeframe-Adaptive: This indicator dynamically adjusts to your selected timeframe. Whether you are a day trader or a long-term investor, this tool adapts to meet your needs.
b) Complete Customization: You have the flexibility to customize every aspect of "Custom Range Indicator". You can modify the color, style, and width of each of the five lines to seamlessly integrate them into your chart setup. Choose from various line styles, including solid, dashed, or dotted, and select colors that suit your visual preferences. Additionally, you can customize the color and text of the labels. Additionally, you can utilize the bar offset option to fine-tune the placement of the range within your analysis.
c) Hide Lines and Labels: You have the option to hide each line or label of the range individually, or hide the entire range with labels or without labels. This customization feature allows you to focus on specific aspects of the chart and declutter the visual representation of the ranges when needed.
Normalized Oscillators
Normalization is a process applied in data handling and statistics, and in the context of trading indicators, it can be incredibly useful. Trading indicators such as Volume, the Relative Strength Index (RSI), the Money Flow Index (MFI), and On Balance Volume (OBV), often vary in their range and scale.
Normalization adjusts these values to fit within a specific range, making different indicators directly comparable and aiding in the interpretation of their relationship and impact on price action. This can offer additional insights for traders, making it easier to identify trends, patterns, and potential trading signals across different indicators.
This indicator offers a selection of three oscillators to normalize and Volume Data:
☀Volume: The amount of a particular asset that is traded within a particular period.
☀Relative Strength Index (RSI): A momentum oscillator that measures the speed and change of price movements. It is typically used to identify overbought or oversold conditions in a market.
☀Money Flow Index (MFI): A momentum indicator that uses price and volume data to identify overbought or oversold signals in an asset.
☀On Balance Volume (OBV): A technical trading momentum indicator that uses volume flow to predict changes in price. It does this by cumulatively adding volume on days when the price increases, and subtracting volume on days when the price decreases.
This script also offers aesthetic customizations for the plot, which can enhance readability and visual appeal:
✔"Plot Color": This input lets users select the color of the plotted line on the chart, allowing for personalization and better visual differentiation when multiple indicators are used.
✔"Plot Width": Users can also adjust the thickness of the plotted line, enhancing visibility based on individual preference or screen resolution.
Why is useful the Normalization?
Normalization plays a crucial role in trading as it helps bring together diverse sets of information to support more informed decision-making. For instance, observing the correlation between the price chart and oscillators like On Balance Volume (OBV) near range levels can provide valuable insights.
Consider this example using a daily (1D) Ethereum (ETH) chart:
We observe that the price is at a Range Quarter, making a higher high while the OBV makes a higher low. This scenario presents a significant degree of confluence. The price is at a critical range level and there is a bearish divergence between the OBV and the price. Such confluence often indicates a potential shift in market dynamics, and as observed, the price trends lower subsequently.
Below is the same scenario represented on a linear chart, providing a clearer visualization:
Normalization enables us to make these comparisons more accurately, ultimately leading to more reliable trading signals and better trading outcomes. By adjusting the scale of various indicators to a standard range, traders can directly compare and correlate them to price action, making it easier to spot trends, divergences, and other key market patterns.
Keep attention!
It is important to note that no trading indicator or strategy is foolproof, and there is always a risk of losses in trading. While this indicator may provide useful information for making conclusions, it should not be used as the sole basis for making trading decisions. Traders should always use proper risk management techniques and consider multiple factors when making trading decisions.

RSI Chart LevelsThe RSI Chart Levels shows you in a simple way where Support/Resistance might be. You want to make sure all settings are the same in the RSI that you are using with this overlay to be accurate.
This is also good at spotting divergence in real-time. If price goes over the Higher High but the RSI hasn't gained a new Higher High it is showing divergence, vice versa for Lower Low.
This overlay was created with the idea of RSI Divergence Scanner by zdmre indicator. Add his RSI and match the settings to the chart overlay. The default Zigzag is set to 7 which zdmre settings is different so change to whatever you prefer.
Shoutout to zdmre original work!

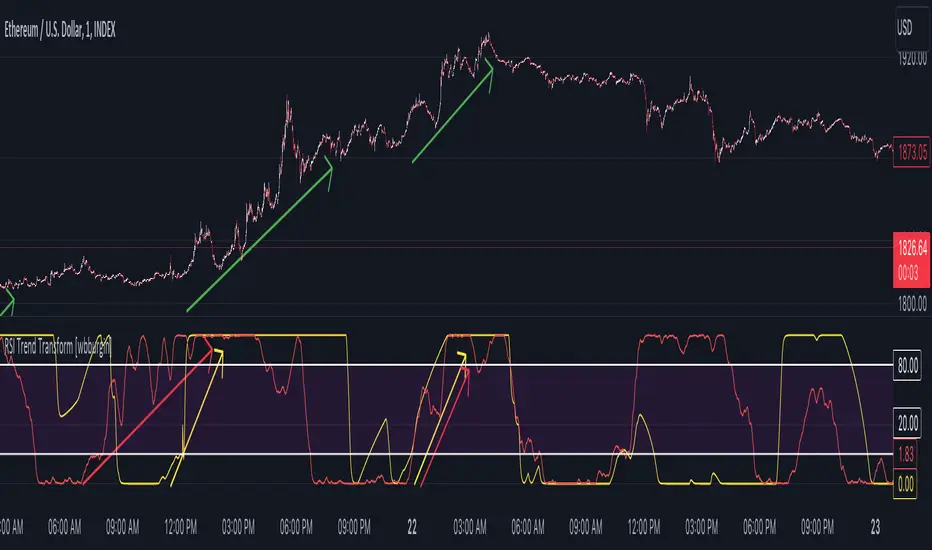
RSI Trend Transform [wbburgin]The RSI Trend Transform indicator is a dual-concept indicator that transforms volume data and price data into two different RSI values, which can then be used together to determine trend strength and momentum. The volume RSI does not use any price data in its calculation - it is purely a transform from nondirectional volume into a directional indicator.
The RSI for all three RSI values (price, volume,combined average) can be plotted as either stochastic or normal. The RSI calculation is adapted for use on volume, which is why the normal ta.rsi() function is not used for the price RSI calculation; both use the same formula for indicator consistency.
How to Use the Indicator
In the examples below, the Price RSI is plotted in yellow and the Volume RSI is plotted in red (length = 200, which is why the indicator is large in these examples). The indicator can be used on any timeframe and any asset, provided volume data is provided by the vendor to TradingView.
Identifying Bullish Trends
A rising volume RSI with a rising price RSI signifies a bullish trend. Example 1:
Example 2:
You can use the combined RSI (the average of the volume RSI and the price RSI) to help with the identification of these trends:
Identifying Bearish Trends
A falling volume RSI with a falling price RSI signifies a bearish trend:
Example 2:
Settings
Source is the source of the price RSI, the volume RSI will by default use volume in its calculations. If you have other indicators on-chart, you could even use the ATR, a volatility indicator, or any nondirectional or directional indicator and transform it into the "price" RSI.
Length is both the length of the RSI and the stochastic.
The next three rows are for each RSI you can plot on the indicator: price RSI, volume RSI, and combined RSI (average of price and volume). The first checkbox plots/removes them from the chart, you can subsequently choose the type of RSI (regular or stochastic), the color of the plot, and the length of the EMA smoothing applied afterward to the plot.
Upper Band and Lower Band refer to the overbought and oversold lines, respectively.
A note about the combined RSI- you will be unable to spot divergences if the combined RSI is the only plot on the indicator, so I encourage you to use the combined RSI as a way to confirm the overall trend if you notice the price RSI and the volume RSI and trending similarly.
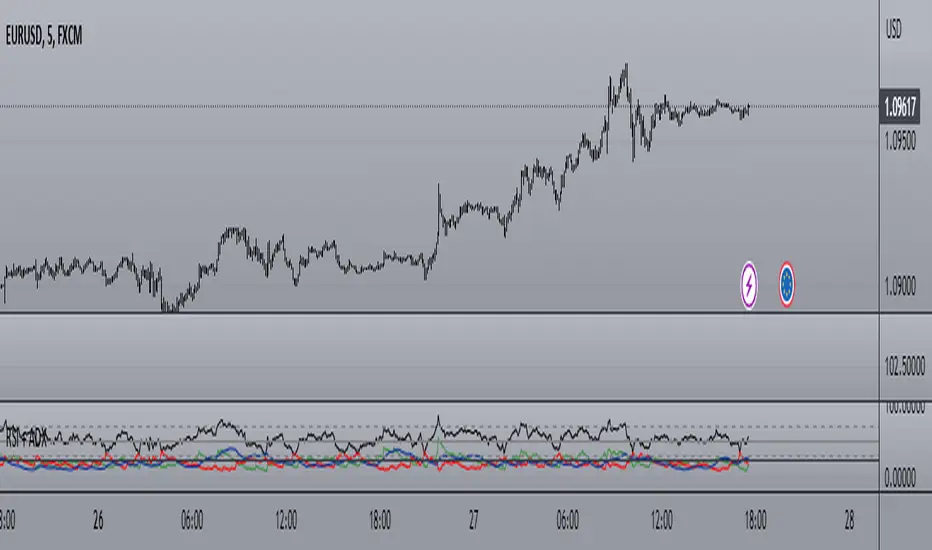
RSI + ADX + MACDINDICADOR COMBINADO DE RSI + ADX
Aprovecha las ventajas de cada indicador en uno solo.
Teniendo en un solo indicador el momentum de cada tendencia y la fuerza relativa con sus puntos de sobre compra y sobre venta.
También al poder analizar divergencias en el indicador oscilador RSI y poder crear estrategias de entrada con el ADX
-------------------------------------------------------------------------------------------------------------------------------------------------------------------------------
RSI + ADX COMBINED INDICATOR
Take advantage of each indicator in one.
Having in a single indicator the momentum of each trend and the relative strength with its points of overbought and oversold.
Also by being able to analyze divergences in the RSI oscillator indicator and being able to create entry strategies with the ADX
DERECHOS DEL CREADOR PARA: Dvd_trading
RSI MTF [Market Yogi]The Multi-Time Frame RSI with Money Flow Index and Average is a powerful trading indicator designed to help traders identify overbought and oversold conditions across multiple time frames. It combines the Relative Strength Index (RSI) with the Money Flow Index (MFI) and provides an average value for better accuracy.
The Relative Strength Index (RSI) is a popular momentum oscillator that measures the speed and change of price movements. It oscillates between 0 and 100 and is used to identify overbought and oversold conditions in an asset. By incorporating the RSI across multiple time frames, this indicator offers a broader perspective on market sentiment.
In addition to the RSI, this indicator also includes the Money Flow Index (MFI). The MFI is a volume-based oscillator that measures the inflow and outflow of money into an asset. It takes into account both price and volume, providing insights into the strength and direction of buying and selling pressure.
By combining the RSI and MFI across multiple time frames, traders gain a comprehensive understanding of market dynamics. The indicator allows for comparing the RSI and MFI values across different time frames, enabling traders to identify divergences and potential trend reversals.
Furthermore, this indicator provides an average value of the multi-time frame RSI, offering a consolidated signal that helps filter out noise and enhance the accuracy of trading decisions.
Key Features:
1. Multi-Time Frame RSI: Combines the RSI across different time frames to provide a comprehensive view of market sentiment.
2. Money Flow Index (MFI): Incorporates the MFI to gauge buying and selling pressure based on both price and volume.
3. Average Calculation: Computes the average value of the multi-time frame RSI to generate a consolidated trading signal.
4. Divergence Detection: Enables traders to spot divergences between the RSI and MFI values, indicating potential trend reversals.
5. Overbought and Oversold Levels: Highlights overbought and oversold levels on the RSI, aiding in timing entry and exit points.
The Multi-Time Frame RSI with Money Flow Index and Average is a versatile tool that can be applied to various trading strategies, including trend following, swing trading, and mean reversion. Traders can adjust the time frame settings to suit their preferences and trading style.
Note: It's important to use this indicator in conjunction with other technical analysis tools and indicators to validate signals and make informed trading decisions.

*Zig Zag Price, % Change w/RSI*With immense help from ©SimpleCryptoLife who reimagined this script for me, and to ©mmoiwgg and ©ocaptain who's ideas led to this updated version 5.
This indicator is fairly straight-forward and visually appealing because you get a running zig zag price, price % change with an added bonus - RSI. However you won't find zig zag lines but the script reacts the same by changing the inputs. The higher the value the less data points you'll see on the screen.
The main objective of this indicator is to be able to spot high and low prices easily with the price % change between the same 2 data sets. Additionally and arguably more importantly, with the RSI values associated with the high and low prices, you can spot divergences easily - meaning the price is making a higher high while conversely the RSI value at the next pop (around the same price as previous high) is lower which can mean that momentum has exhausted for the time being and a reversal could be imminent.
This script is meant only as a tool to try to enrich your trading journey and I hope it helps you become a more consistent and profitable trader. If you find it invaluable drop a like and comment. Good luck!

Divergence RSI V2This indicator is based on the concept of divergence. I recommend that you find out and study about this yourself as the concept of divergence will not be explained in depth in this description.
This indicator will show divergences between the asset price and the RSI oscillator. The indicator will look for divergent points between the rising highs and falling lows of the asset; and the rising lows and falling highs of the RSI.
The trend of the asset tends to follow the behavior of the oscillator when a divergence occurs. So if we find a divergence between the two, the price of the asset is likely to follow the trend of the oscillator.
This indicator looks for these types of divergences and will show (based on the RSI) if there is a bullish or bearish divergence.
If it is bullish, it will show a line joining those points in green and if it is bearish in red. In addition, it will show a label where you can see the number of occurrences that have been found from a certain point to another.
Note: this indicator can be complemented with the “Divergence V2” indicator which is also found in my library.
Settings
Backtesting Bars : is the number of bars back that the indicator will check. No more than 1000 is recommended as this will slow down the search.
Tolerance: number of times a divergent line can cross a bar. If you place 0, no bar can be crossed by a diverging line.
Min Bars To detect: will only search for divergences (or lines) that have the minimum number of bars selected in this option. Default option is 30.
Min Bars To detect: it will only search for divergences (or lines) that have the maximum number of bars selected in this option. Default option is 100.
Source Highs: The high points will be based on the close of each bar. You can use as another alternative.
Source Lows: The low points will be based on the close of each bar. You can use as another alternative.
Use squeeze parameter: only look for divergences (bullish or bearish) at times when such an indicator is in favor of the trend or coincides with the corresponding RSI divergence.