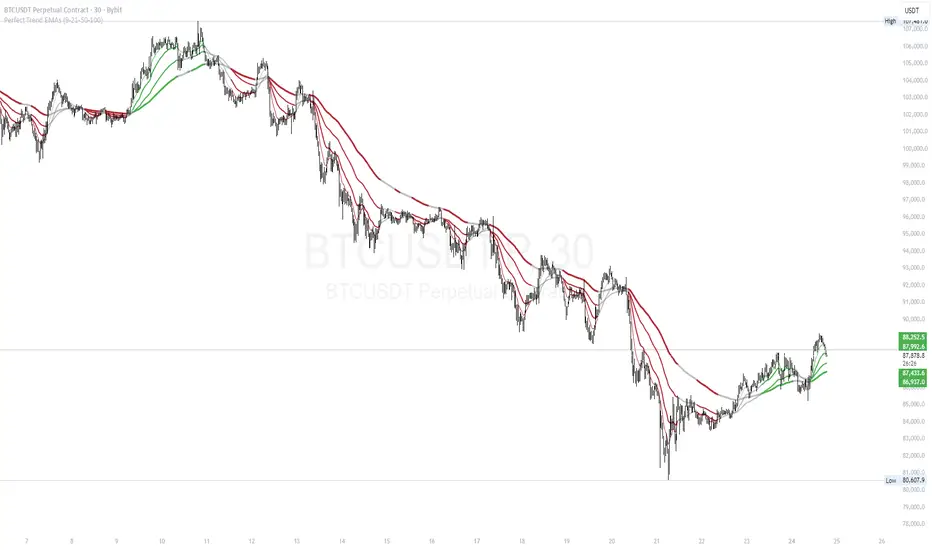
Perfect Trend EMAs (9-21-50-100)This indicator provides a clear, color-coded visual representation of trend strength based on the alignment of four Exponential Moving Averages (EMAs). It is designed to help traders identify "Perfect Trend" setups, where momentum is fully aligned across multiple timeframes, and filter out choppy or ranging markets.
How it Works (The Logic) The indicator plots four distinct EMAs (default lengths: 9, 21, 50, and 100). Instead of simply looking for crossovers, this script analyzes the hierarchical stacking of these averages to determine the market state.
The color coding follows these specific rules:
🟢 Bullish Alignment (Green): This occurs only when there is a "Perfect Bullish" stack.
Logic: EMA 9 > EMA 21 > EMA 50 > EMA 100
Interpretation: Short-term momentum is stronger than long-term momentum, indicating a strong uptrend.
🔴 Bearish Alignment (Red): This occurs only when there is a "Perfect Bearish" stack.
Logic: EMA 9 < EMA 21 < EMA 50 < EMA 100
Interpretation: Short-term momentum is weaker than long-term momentum, indicating a strong downtrend.
⚪ Consolidation / Transition (Gray):
Logic: Any other combination.
Interpretation: The moving averages are intertwined or not perfectly aligned. This usually signals a ranging market, a consolidation phase, or the early stages of a trend reversal before the alignment is confirmed.
Features
Dynamic Coloring: All EMA lines change color simultaneously to provide an instant visual signal of the market state.
Visual Fill: A soft background fill is applied between the fastest (9) and slowest (100) EMA to create a "Trend Cloud," making it easier to spot the expansion and contraction of the trend.
Customization: Users can adjust the lengths of all four EMAs in the settings menu to fit different trading styles (e.g., changing to 20/50/100/200).
How to Use
Trend Following: Traders can look for the lines to turn Green or Red to confirm a trend entry.
Filtering Noise: The Gray zones serve as a filter. If the lines are Gray, the trend is not fully established, suggesting caution or a "wait and see" approach.
Exits: A change from Green/Red back to Gray can act as an early warning sign that the trend momentum is fading.
Search in scripts for "科创50"
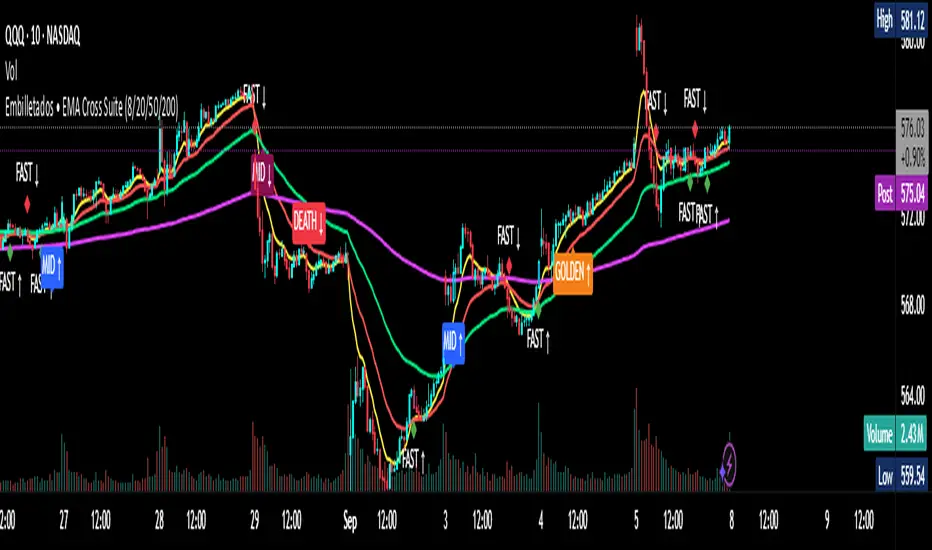
EMA Cross Suite (8/20/50/200) GOLDEN/DEATH by Carlos Chavez📜 Short Description (max 160 characters)
“Advanced EMA crossover system with FAST, MID, GOLDEN, and DEATH signals. Includes alerts, optimized visuals, and full customization.”
📄 Full Description (Paste in the box)
📌 Overview
The Embilletados • EMA Cross Suite is a professional trading indicator designed for intraday traders, scalpers, and swing traders.
It provides clear crossover signals using 4 EMAs combined with optimized visualization and built-in alerts to help you catch opportunities faster.
✨ Key Features:
🔹 4 configurable EMAs → 8, 20, 50, and 200.
🔹 Instant visual signals with colored labels:
FAST CROSS (8/20) → Quick momentum shifts.
MID CROSS (20/50) → Trend confirmation signals.
GOLDEN CROSS (50/200) → Strong bullish trend signals.
DEATH CROSS (50/200) → Strong bearish trend signals.
🔹 Built-in alerts → Get notified instantly for all crossover events.
🔹 Optimized visualization → Clean and easy-to-read interface.
🔹 Highly customizable → Enable/disable signals, labels, colors, and alerts according to your strategy.
📊 Recommended Timeframes:
10-minute charts → Best for intraday setups.
1-hour charts → Ideal for swing trading and trend confirmation.
🚀 How to Use:
Add the indicator to your chart.
Set up alerts for the desired crossovers: FAST, MID, GOLDEN, or DEATH.
Trade confidently using clear visual confirmations and real-time notifications.
🌟 Perfect for:
✅ Intraday traders
✅ Scalpers
✅ Swing traders
✅ Trend-following strategies
Advanced Pattern Detection System [50+ Patterns]【Advanced Pattern Detection System - Auto-detects 50+ Chart Patterns】
Introducing the most powerful pattern detection indicator for TradingView!
◆ What is this?
An automated tool that finds and displays over 50 chart patterns on your charts. It detects all the patterns professional traders use - Double Tops, Triangles, Head & Shoulders, and more - all in ONE indicator.
◆ Main Features
・Detects 50+ patterns in real-time
・Shows visual explanation of WHY each pattern was identified
・Automatically calculates theoretical target prices
・Displays confidence levels in % (60-95%)
・Choose panel position from 9 locations
・Works on all timeframes (1min to Monthly)
◆ Detectable Patterns
1. Classic Patterns (Double Top/Bottom, Head & Shoulders, etc.)
2. Triangle Patterns (Ascending, Descending, Symmetrical, Expanding)
3. Continuation Patterns (Flags, Pennants, Wedges, etc.)
4. Harmonic Patterns (Gartley, Butterfly, Bat, etc.)
5. Price Action (Pin Bar, Engulfing, Hammer, etc.)
6. Special Patterns (Cup & Handle, V-formations, etc.)
◆ What Makes It Different
・Not just detection - shows the reasoning behind it
・Auto-draws pivot points and necklines
・Displays target prices with % gain/loss from current price
・Detects multiple patterns simultaneously, sorted by confidence
・Available in both Japanese and English versions
◆ Perfect For
✓ Anyone tired of using multiple indicators
✓ Beginners wanting to learn pattern trading
✓ Traders who don't want to miss entry points
✓ Those looking to improve discretionary trading accuracy
◆ How to Use (Easy 3 Steps)
1. Open TradingView and paste code in Pine Editor
2. Click "Add to Chart"
3. Enable only the patterns you need in settings
◆ Color Meanings
Green → Bullish potential (Buy signal)
Red → Bearish potential (Sell signal)
Yellow → Neutral direction (Wait and see)
◆ Recommended Settings
Scalping: Detection period 20, Sensitivity 0.0025
Day Trading: Detection period 50, Sensitivity 0.002
Swing Trading: Detection period 100, Sensitivity 0.0015
◆ Real Trading Example
"Detects Double Bottom → 85% confidence → Enter on neckline break → Take profit at displayed target price"
This is how you can use it in practice.
◆ Important Notes
・This is an analysis tool, not investment advice
・Always combine with other indicators
・Always set stop losses
・Practice on demo account before live trading
◆ Performance
If running slow, turn OFF unused pattern categories. Reducing max display count to 3 also helps.
◆ Summary
This single tool provides functionality that would normally require multiple paid indicators (worth $100-200 total). It's the ultimate pattern detection system recommended for all traders, from beginners to professionals.
Give it a try if interested! Feel free to ask questions in the comments.

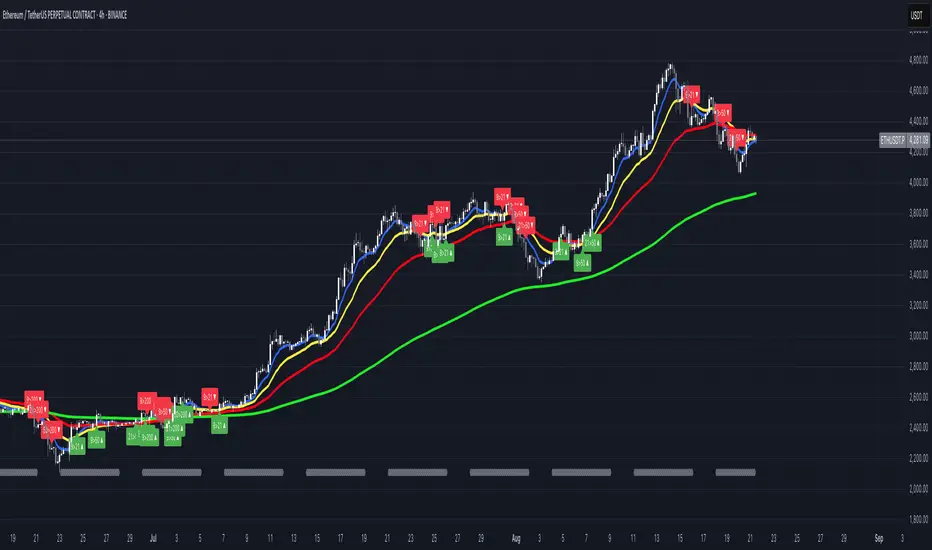
FUMO MA Cross Matrix 9/21/50/100/200 FUMO MA Cross Matrix is a flexible and advanced indicator designed for traders who rely on moving average crossovers as part of their strategy.
🔹 Key Features:
Supports 5 types of Moving Averages: EMA, SMA, SMMA (RMA), WMA, HMA.
Includes 5 standard MAs: 9, 21, 50, 100, 200 (toggle on/off individually).
Choose which MA crosses to monitor (9×21, 21×50, 50×100, 100×200, and 6 extended combinations).
On-chart signals (labels) when crosses occur.
Alerts system for every selected cross and also summary alerts (“Any Cross Up/Down”).
Option to trigger signals only on confirmed bars (no repaint).
Fully adjustable label visibility and signal style.
🔹 Use Cases:
Detect trend shifts (short-term vs long-term).
Build scalping, swing, or position trading strategies.
Combine with price action or volume analysis for stronger setups.
Quickly react to Golden Cross and Death Cross events.
🔹 How to Use:
Select your preferred MA type (EMA, SMA, etc.).
Enable the MAs (9, 21, 50, 100, 200) you want to plot.
Choose which crossovers to track in the settings.
Enable/disable on-chart labels for better visualization.
Set up alerts:
“CROSS UP/DOWN X>Y” for specific pairs.
“ANY CROSS UP/DOWN” for aggregated signals.
📌 Example Alerts
MA Cross UP 9>21 on BTCUSDT 15m @ 65432
Any selected MA cross DOWN on AAPL 1D @ 195.2
EMA 6/21/50 PROIndicator Description: EMAs 6/21/50 + MACD + AO + Panel + Alerts
This technical indicator combines several analysis tools to help identify opportunities to enter consolidated trends. It integrates Exponential Moving Averages (EMAs), the MACD, the Amazing Oscillator (AO), and an interactive information panel that allows you to visualize entry signals, trend direction, and potential exit levels (Take Profit and Stop Loss). It is designed for day or swing traders who want a quick and structured reading of the market.
What does the script do? The indicator does the following: It draws 6, 21, and 50-period EMAs on the chart to detect the direction of the trend. It generates LONG/SHORT entry signals based on EMA crossover, alignment with the overall trend (EMA50), and confirmation by indicators: MACD:
Momentum filter. AO: Impulse depletion filter. It visually displays the TP (Take Profit) and SL (Stop Loss) levels when there is a signal. It includes an informative graphical panel with icons and text summarizing the market status and entry conditions.
It issues customizable alerts for entry signals, allowing it to be used in automated strategies or as a manual guide. Allows you to enable/disable visual elements with buttons to customize the experience.
How does it do it?
EMAs and crossover signals: It uses three EMAs: 6 (fast), 21 (medium), and 50 (slow).
A LONG signal occurs when the 6-EMA crosses above the 21-EMA, the price is above the 50-EMA, the MACD confirms bullish momentum, and the AO shows no exhaustion.
A SHORT signal is given in reverse conditions, with the option to limit the system to long signals only (Long signals only).
Additional filters:
MACD: Entry is avoided if there is no favorable crossover between the MACD line and its signal.
AO: Entry is avoided if the OA shows signs of weakness or exhaustion. TP/SL Visual:
TP and SL levels are calculated based on user-defined pips, and are automatically drawn on the chart when there is a valid signal.
Information panel: Each bar is automatically updated. Samples: general trend, EMA crossover, MACD/AO filters, and presence of LONG/SHORT signal. It is possible to hide it with a button from the settings panel.
Alerts: Alerts are generated when the full LONG or SHORT entry conditions are met. They are useful for receiving automatic notifications or integrating them into automated systems.
How to use it?
Add to chart and configure options: Year of start of the analysis.
Activate only long signals if you wish.
Show/hide panel, EMAs, or TP/SL levels. Interpreting signals:
Green triangle under a candle = Possible LONG entry.
Red triangle above a candle = Possible SHORT entry.
Green Line = Suggested Take Profit. Red Line = Suggested Stop Loss. Trigger alerts from TradingView's alert settings to be notified in real-time.
Important Note
This script does not execute orders or represent an automated trading strategy.
It is a visual analysis tool that can support decision-making, but it is recommended to use it in conjunction with other elements of analysis and proper risk management.

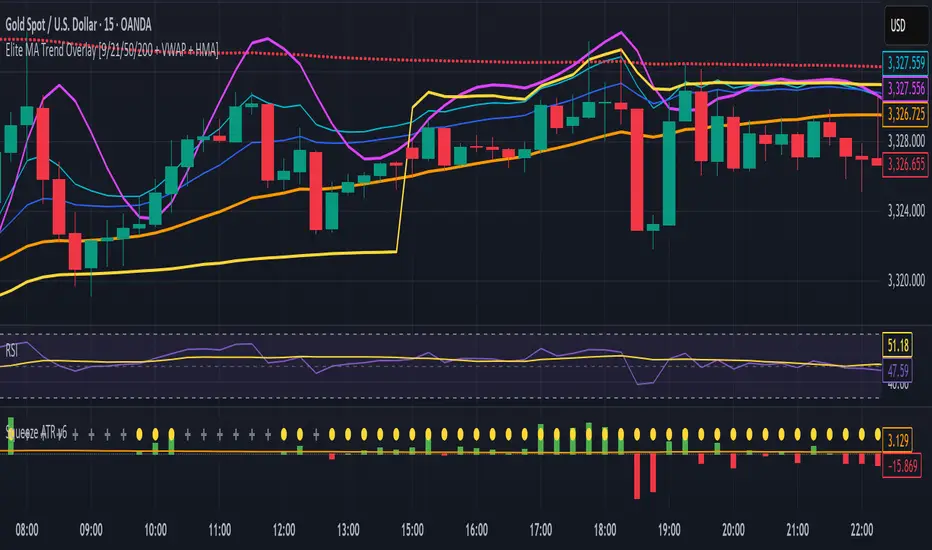
Elite MA Trend Overlay [9/21/50/200 + VWAP + HMA]🔍 What It Is:
The Elite MA Trend Overlay is a professional-grade moving average system built for day traders, scalpers, and swing traders who need clear, visual trend confirmation and precise entry zones across all timeframes.
This overlay combines 5 industry-proven tools into one compact indicator for sniper-level decision making:
EMA 9 – Entry momentum
EMA 21 – Microstructure guide
EMA 50 – Trend bias filter
EMA 200 – Institutional macro direction
VWAP – Intraday fair value (used by pros)
Hull MA (HMA) – Early shift detector
It also features auto-detected trend zones using color-coded background shading to help you instantly know if the market is in a bullish or bearish regime.
🧠 How It Works:
The script dynamically plots the short-term to long-term moving averages to reflect real-time market structure. When all EMAs are aligned in one direction, a colored background highlights the dominant trend:
✅ Green background = Bullish trend (9 > 21 > 50 > 200)
🔻 Red background = Bearish trend (9 < 21 < 50 < 200)
The VWAP line acts as a magnet and decision zone—traders use it for intraday entries or exits. The Hull Moving Average adapts quickly to price shifts, making it perfect for spotting early reversals before the EMAs cross.
🎯 Why It Helps Traders Succeed:
This indicator:
Removes guesswork: Know instantly if you’re in a strong trend or chop zone.
Filters bad trades: Avoid entering against structure or into volatility traps.
Improves timing: Use pullbacks to EMAs or Hull MA flips for sniper entries.
Works across timeframes: From scalping 1-minute to swing trading daily charts.
Whether you're trading gold, forex, stocks, or crypto — this overlay gives you clean, professional structure that keeps you disciplined and sharp.
⚙️ Features:
On/off toggles for VWAP & Hull MA
Minimalist, clutter-free plotting
Auto background color zones
Supports Pine Script v6 (latest version)
👑 Recommended Use:
Confirm trend with background + EMA alignment
Enter on pullbacks to EMA 21 or 50
Use Hull MA or RSI for early reversal detection
Exit at VWAP reversion or trend exhaustion
💬 “Structure is everything. Trade with the flow, not against it.”
Bollinger Bands + EMA 200 + EMA 50This indicator combines three technical analysis tools: the Bollinger Bands (BB), and two Exponential Moving Averages (EMA) with periods of 200 and 50.
Bollinger Bands (BB): This indicator consists of three lines—the middle line being a simple moving average (SMA), and the upper and lower bands representing two standard deviations above and below the SMA. The width of the bands indicates market volatility, with wider bands signifying higher volatility and narrower bands indicating lower volatility.
Exponential Moving Averages (EMA 200 and EMA 50): The EMA is a type of moving average that gives more weight to recent prices, making it more responsive to price changes than the simple moving average. The EMA 200 is considered a long-term trend indicator, often used to identify the overall direction of the market. The EMA 50 is a medium-term trend indicator, helping to spot more immediate market trends. Crossovers between these two EMAs (such as when EMA 50 crosses above EMA 200) are commonly used as buy or sell signals, with the idea that a short-term trend shift is occurring.
By combining these three indicators, this custom Pine Script aims to give a comprehensive view of the market conditions, helping traders to understand both the volatility (via BB), the long-term market trend (via EMA 200), and the medium-term trend (via EMA 50). The interaction between the price and these indicators, along with crossovers, can be used to identify potential entry and exit points.

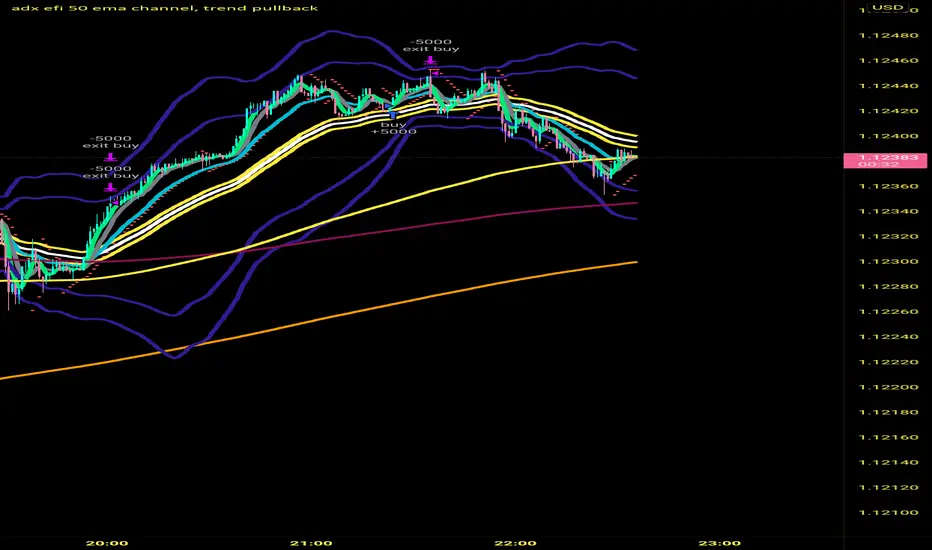
adx efi 50 ema channel, trend pullbackHi so this strategy is based off 50 ema channel and the 15 ma crossing it to generate signals. But with my adjusted strategy it's a 10 rma crossing 50 ema channels and a 5 and 9 wma to help see pullbacks. 50 period bollinger bands to gage volatility a0nd help during range markets. The strategy signals are generated when longer period efi is above 0 and shorter period efi is below zero and price has pulled back near 50 ema to buy long. And the reverse for shorts, I made this to help me trade more mechanically and to trade 1 minute time frame, that's where the strategy seems to Excell the most, I developed it on eur usd but a brief check seems like it still is profitable on gbp usd aud usd usd jpy I only trade the forex market so not sure about stocks and crypto. If you get signals I would place buy stops and sell stops above high and low of respective signal candle and let price take you into trade. Also adx 20 has to be greater than 20 to take trades. Let me know if this is helpful. I've only been coding for a month so it might look sloppy the way it's coded also there are a few other buy and sell conditions left in the source code if you want to switch between different buy and sell triggers, they all produce good results on 1 min timeframe
Big Picture 50/200Crazy as this may sound, it took 126 iterations to get something so simple sone right.
Big Picture helps offload some longer-term SMA lines off your chart so you can clutter it up again with some other stuff. It works by comparing SMAs 50 and 200 in histogram form. If the histogram is over the zero-line, 50 is over 200, and vice versa.
The histogram is green when the slope rises, suggesting that 50 is rising relative to 200. When the histogram turns red, 50 is falling.
Some Heikin-Ashi inspired averaging helps smooth the line just a little to help give a better idea as to overall trend.

MA Cross 50/100, 100/50 Moving Average Cross tool using MA 50 / MA 100 / MA 200
I have found these settings useful on Bitcoin & other markets
Alerts Added,
Breakout = MA 50 crossing above MA 100
Breakdown = MA 100 crossing under MA 50
MA 200 added as a useful area for overall support
No repaint.

SMA 20, 50, 200This Script provides the 50 and 200 day moving average to provide a way to keep track of the classic Death Cross and Golden Cross. The 20 day moving average is just used as an early prediction of what the 50 day may do so you can keep and eye on it. If you are the kind of person that freaks out at sudden changes in the graphs it is probably best to just turn the 20 day off.
A Golden Cross is when the 50 day MA raises above the 200 day MA. This indicates the start of a Bull Market. This is the best time to buy as the market commonly will increase over the next few months or even years.
A Death Cross is when the 50 day MA drops below the 200 day MA. This indicates the start of a Bear Market. This is the best time to sell as the market will commonly decrease at least 20 percent or more over the next couple months or more.
I am not a financial advisor and this is just a tool to help you make your own decisions with your investments. My information is just based on common knowledge.

Stage 2 Trend Signals (10/21/50/200) *Trend-following indicator designed to focus on **strong Stage 2 uptrends**, not bottom-fishing or chop.
* Plots **10 EMA, 21 EMA, 50 SMA, and 200 SMA** as core moving averages.
* Uses a **trend filter** so buy signals only occur when:
* Price is above the **50 SMA** (and optionally above the **200 SMA**), and
* The **50 SMA is above the 200 SMA**, reflecting classic Stage 2 alignment.
* Prints a **green “BUY” label** when the **10 EMA crosses above the 21 EMA** within this bullish environment, signaling momentum turning up in an established uptrend.
* Prints a **red “SELL” label** when the **10 EMA crosses below the 21 EMA** or when price is in a bearish context and closes below the 21 EMA, prompting risk reduction as trend/momentum weaken.
* Light **green background shading** highlights periods where the bullish Stage 2 conditions are active (“trend-on” zones).
* Works on **any timeframe**; commonly used on:
* **Weekly charts** for big-picture trend confirmation.
* **Daily charts** for swing entries, exits, and active trade management.

One-Time 50 SMA Trend Start//@version=5
indicator("One-Time 50 SMA Trend Start", overlay=true)
// ─── Inputs ──────────────────────────────────────────────
smaLength = input.int(50, "SMA Length")
// ─── Calculations ────────────────────────────────────────
sma50 = ta.sma(close, smaLength)
crossUp = ta.crossover(close, sma50)
// Track whether we've already fired today
var bool alerted = false
// Reset alert for new session
if ta.change(time("D"))
alerted := false
// Trigger one signal only
signal = crossUp and not alerted
if signal
alerted := true
// ─── Plots ───────────────────────────────────────────────
plot(sma50, color=color.orange, linewidth=2, title="50 SMA")
plotshape(
signal,
title="First Cross Above",
style=shape.triangleup,
color=color.new(color.green, 0),
size=size.large,
location=location.belowbar,
text="Trend"
)

Sniper 50: The Trend Master [Pure Signal]Overview Sometimes, the simplest strategies are the deadliest. This indicator brings the legendary "EMA 50 Strategy" to your chart in its purest form. It is designed to capture major market trends and reversals immediately as they happen, stripping away complex filters that often cause lag.
Why the EMA 50? The 50-period Exponential Moving Average is widely regarded by institutional traders as the primary divider between bullish and bearish territory. This tool automates the monitoring of this key level.
How It Works The logic is raw and direct:
BUY Signal: Triggered immediately when the candle closes ABOVE the EMA 50.
SELL Signal: Triggered immediately when the candle closes BELOW the EMA 50.
Key Features
Zero Noise Technology: Includes a built-in state machine that prevents repetitive signals. You will receive exactly ONE signal when the trend flips, and silence until the next reversal.
Dynamic Visuals: The EMA line changes color (Green for Bullish, Red for Bearish) to give you instant context.
Lag-Free: unlike other tools that wait for multiple confirmations, this tool prioritizes speed to catch sharp moves (like sudden crashes or rallies).
Best For
Trend Following
Swing Trading (Crypto & Stocks)
Catching rapid reversals that complex indicators might miss.

Quarter + 50 BandsThe indicator does two main things:
Draws a red quarter-point grid (every 25 points by default).
Draws green and blue “bands” that sit 50 points below and above each big 100-point figure.
Think of it like:
Red = your normal 25-point quarters
Green = “sweet spot” 50 points below each 100-pt handle
Blue = “sweet spot” 50 points above each 100-pt handle
It fully customizable.

Strategy: HMA 50 + Supertrend SniperHMA 50 + Supertrend Confluence Strategy (Trend Following with Noise Filtering)
Description:
Introduction and Concept This strategy is designed to solve a common problem in trend-following trading: Lag vs. False Signals. Standard Moving Averages often lag too much, while price action indicators can generate false signals during choppy markets. This script combines the speed of the Hull Moving Average (HMA) with the volatility-based filtering of the Supertrend indicator to create a robust "Confluence System."
The primary goal of this script is not just to overlay two indicators, but to enforce a strict rule where a trade is only taken when Momentum (HMA) and Volatility Direction (Supertrend) are in perfect agreement.
Why this combination? (The Logic Behind the Mashup)
Hull Moving Average (HMA 50): We use the HMA because it significantly reduces lag compared to SMA or EMA by using weighted calculations. It acts as our primary Trend Direction detector. However, HMA can be too sensitive and "whipsaw" during sideways markets.
Supertrend (ATR-based): We use the Supertrend (Factor 3.0, Period 10) as our Volatility Filter. It uses Average True Range (ATR) to determine the significant trend boundary.
How it Works (Methodology) The strategy uses a boolean logic system to filter out low-quality trades:
Bullish Confluence: The HMA must be rising (Slope > 0) AND the Close Price must be above the Supertrend line (Uptrend).
Bearish Confluence: The HMA must be falling (Slope < 0) AND the Close Price must be below the Supertrend line (Downtrend).
The "Choppy Zone" (Noise Filter): This is a unique feature of this script. If the HMA indicates one direction (e.g., Rising) but the Supertrend indicates the opposite (e.g., Downtrend), the market is considered "Choppy" or indecisive. In this state, the script paints the candles or HMA line Gray and exits all positions (optional setting) to preserve capital.
Visual Guide & Signals To make the script easy to interpret for traders who do not read Pine Script, I have implemented specific visual cues:
Green Cross (+): Indicates a LONG entry signal. Both HMA and Supertrend align bullishly.
Red Cross (X): Indicates a SHORT entry signal. Both HMA and Supertrend align bearishly.
Thick Line (HMA): The main line changes color based on the trend.
Green: Bullish Confluence.
Red: Bearish Confluence.
Gray: Divergence/Choppy (No Trade Zone).
Thin Step Line: This is the Supertrend line, serving as your dynamic Trailing Stop Loss.
Strategy Settings
HMA Length: Default is 50 (Mid-term trend).
ATR Factor/Period: Default is 3.0/10 (Standard for trend catching).
Exit on Choppy: A toggle switch allowing users to decide whether to hold through noise or exit immediately when indicators disagree.
Risk Warning This strategy performs best in trending markets (Forex, Crypto, Indices). Like all trend-following systems, it may experience drawdown during prolonged accumulation/distribution phases. Please backtest with your specific asset before using it with real capital.

MA 9/21/50/100/200//@version=5
indicator("MA 9/21/50/100/200", overlay=true)
ma9 = ta.sma(close, 9)
ma21 = ta.sma(close, 21)
ma50 = ta.sma(close, 50)
ma100 = ta.sma(close, 100)
ma200 = ta.sma(close, 200)
plot(ma9, color=color.new(color.yellow, 0), title="MA 9")
plot(ma21, color=color.new(color.orange, 0), title="MA 21")
plot(ma50, color=color.new(color.blue, 0), title="MA 50")
plot(ma100, color=color.new(color.green, 0), title="MA 100")
plot(ma200, color=color.new(color.red, 0), title="MA 200")

Strict Weekly 50/200 WMA Signals True Weekly Only-Strict Weekly 50/200 WMA Signals True Weekly Only => also on other time frames than weekly (like daily, etc.) always indicates the indicators based on the weekly chart
-especially useful for Crypto
-gives buy and sell signals when the 200 WMA or the 50 WMA are crossed
-typically above the 50 WMA indicates a bull market
-reaching below the 200 WMA indicates a bear market and typically for investors with a longer time frame (>2-4 years) a good entry point

EMA 50 y EMA 200 (simple)Madia de 50 y 200.
Ya creé un indicador simple y limpio que muchos estaban buscando: una herramienta que muestre únicamente la EMA 50 y la EMA 200, sin ruidos visuales ni configuraciones complicadas.
Perfecto para quienes quieren seguir la tendencia principal, detectar cambios de dirección mediante cruces de medias, o simplemente tener una referencia clara del comportamiento del precio.
I’ve created a clean and simple indicator that many traders have been looking for: a tool that shows only the EMA 50 and the EMA 200, with no visual clutter or unnecessary features.
Perfect for identifying the overall trend, spotting potential trend reversals through EMA crossovers, or simply keeping a clear reference of price direction.

dO / wO / mO + MA 50/200 + PrevDay H/L Description
This indicator plots key reference levels used by professional traders:
Daily Open (dO)
Weekly Open (wO)
Monthly Open (mO)
Previous Day High (pdH) and Previous Day Low (pdL)
Moving Averages: 50 & 200 SMA
Each level is drawn as a clean dotted white line with a fixed label directly on the price chart.
All levels can be individually toggled on or off via checkboxes in the settings panel.
The pdH/pdL lines start exactly from the candles that created them, providing clear structure for breakout, retracement, and liquidity analysis.
The 50/200 SMA are included for long-term trend context.
This tool is designed for traders who rely on multi-timeframe structure and precision levels for both intraday and swing strategies.
Features
Toggle visibility for dO, wO, mO, pdH, and pdL
Accurate placement of previous day levels
Lightweight and responsive
Clean minimal visual design
Supports any symbol and timeframe
Usage Notes
Perfect for confluence-based trading:
Combine pdH/pdL with session opens to identify key liquidity zones
Use SMA 50/200 for directional bias
Works on crypto, forex, indices, and equities

RSI with SMA + 70/60/50/40/30 LevelsIndicator Name:
RSI with SMA + 70/60/50/40/30 Levels
🧩 Concept Overview:
यह indicator दो popular tools को combine करता है:
RSI (Relative Strength Index) – momentum indicator जो market ke overbought aur oversold zones ko identify karta hai.
SMA (Simple Moving Average) – trend smoother jo RSI ke movement ko average karke lagging confirmation deta hai.
इन दोनों के साथ 70, 60, 50, 40, और 30 की multiple reference lines draw की जाती हैं, ताकि trader को RSI ke swings aur reversals easily samajh aaye.
⚙️ Indicator Components:
RSI Line:
Default Period: 14 (customize kar sakte ho).
Show karta hai price momentum – agar RSI 70 ke upar jaata hai to market overbought zone me hota hai; agar 30 ke niche jaata hai to oversold zone me.
SMA on RSI:
RSI ka smooth version (usually 9-period SMA).
Trend confirmation ke liye – jab RSI line SMA ke upar cross karti hai to bullish signal, aur neeche cross kare to bearish signal.
Horizontal Levels:
70: Overbought zone (potential sell area).
60: Strong bullish momentum line (trend confirmation).
50: Neutral / midline (trend direction flip area).
40: Weak bearish zone (trend losing strength).
30: Oversold zone (potential buy area).
💡 How to Use:
Trend Identification:
RSI > 60 aur SMA ke upar → Bullish trend.
RSI < 40 aur SMA ke neeche → Bearish trend.
Reversal Spotting:
RSI 70 ke upar jaake wapas niche aaye → Sell signal.
RSI 30 ke neeche jaake wapas upar aaye → Buy signal.
Confirmation Using SMA:
RSI cross SMA from below → Confirmed bullish reversal.
RSI cross SMA from above → Confirmed bearish reversal.

Goldencross & Deathcross Highlights (50/200 SMA) - Fixed dailyThis indicator visualizes major long-term trend shifts in the market
by tracking the daily 50-day and 200-day Simple Moving Averages (SMAs)
— regardless of your current chart timeframe.
🟩 A green flash (Golden Cross) appears when the 50-day SMA crosses
above the 200-day SMA — signaling potential long-term bullish momentum.
🟥 A red flash (Death Cross) appears when the 50-day SMA crosses
below the 200-day SMA — suggesting potential long-term bearish pressure.
Unlike typical SMA overlays, this script:
• Pulls daily data directly (fixed to daily timeframe)
• Works cleanly on any chart timeframe (5m, 1h, 4h, etc.)
• Avoids clutter by hiding moving average lines
• Shows only short, subtle flashes and one clean marker per event

SMA Cross 5/50 with Trend Filter & Risk Management by JuggiDThe basic SMA (5/50) crossover strategy can be enhanced to improve profitability by adding filters and risk management. For example, a long entry is triggered only when the fast SMA (5) crosses above the slow SMA (50) **and** the price is above the SMA (200), ensuring trades align with the major trend. Similarly, a short entry requires the crossover confirmation plus the price staying below the SMA (200). To reduce false signals and protect capital, stop-loss and take-profit levels can be set automatically (e.g., 2% loss, 5% gain), while additional confirmation tools such as volume spikes, RSI above 50, or MACD momentum can be applied to validate stronger signals. This approach helps avoid whipsaws in sideways markets and allows trades to capture larger moves while minimizing downside risk.
