Double CCIThe Commodity Channel Index (CCI) is a momentum oscillator used in technical analysis primarily to identify overbought and oversold levels by measuring an instrument's variations away from its statistical mean. Besides overbought/oversold levels, CCI is often used to find reversals as well as divergences. Originally, the indicator was designed to be used for identifying trends in commodities, however it is now used in a wide range of financial instruments.
There are several steps involved in calculating the CCI. The following example is for a typical 14 Period CCI:
CCI = (Typical Price - 14 Period SMA of TP) / (.015 x Mean Deviation)
Typical Price (TP) = (High + Low + Close)/3
Constant = .015
The Constant is set at .015 for scaling purposes. By including the constant, the majority of CCI values will fall within the 100 to -100 range.
Mean Deviation:
1) Subtract the most recent 14 Period Simple Moving from each typical price (TP) for the Period.
2) Sum these numbers strictly using absolute values.
3) Divide the value generated in step 2 by the total number of Periods (14 in this case).
Overbought and Oversold conditions can be used in their more traditional sense to identify future reversals . Remember true overbought/oversold thresholds values can and often do vary between instruments.
During a Bullish Trend , price crossing above the overbought threshold may indicate strong confidence in the move and price will continue to rise.
During a Bearish Trend , price crossing below the oversold threshold may indicate strong confidence in the move and price will continue to fall.
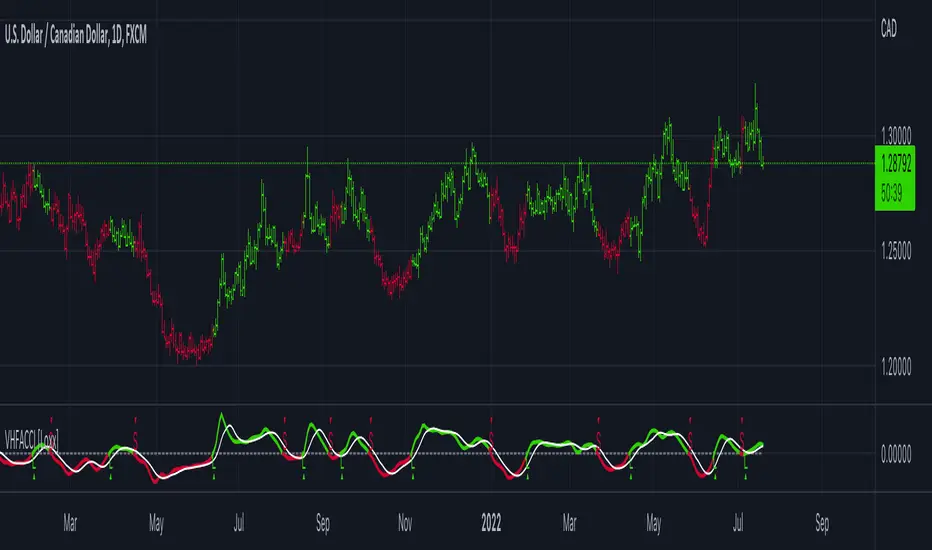
The first option is a modified CCI indicator that uses the "Arnaud Legoux Moving Average" instead of the SMA, and the source uses the VWAP instead of the HLC3. Added to this version an option to calculate CCI with different types of moving averages:
Green dots mean they are overbought
Orange dots mean they are oversold
Added a "SuperTrend Background" based on the modified CCI indicator:
Bull event = CCI crossing over the 0 line
Bear event = CCI crossing below the 0 line
Added a signal as EMA (modified CCI, signal length)
The second option is a standard CCI indicator that shows a coloured histogram of important levels, giving a good visual of the CCI levels. Added to this version is an extra coloured level +/-200 and an option to use Traditional CCI calculations according to user @JustUncleL
LEVELS:
Aqua: Greater than 200.
Lavender: Greater than 100 and less than 200.
Dark Lavender: Greater than 0 and less than 100.
Dark Coral: Less than 0 and greater than -100.
Coral: Less than -100 and greater than -200.
Light Red: Less than -200.
Search in scripts for "CCI"
Trinity CCI Pro PlusWhat It Is
Trinity CCI Pro Plus is an innovative overlay indicator that reimagines the classic Commodity Channel Index (CCI) by plotting its levels directly on the price chart. No more separate oscillator panel—instead, you get dynamic price-based bands and lines for instant momentum insights.
What You See on the Chart
Orange line: The CCI zero line (20-period SMA of typical price, hlc3)—acts as the baseline.
Aqua line: Dynamic upper band at CCI = +100 (overbought threshold).
Purple line: Dynamic lower band at CCI = -100 (oversold threshold).
Optional thick purple line: The extra SMA of CCI (14-period smooth) scaled back to price—serves as a signal line for crossovers.
Optional outer zones: ±200 bands (aqua/purple extensions) for extreme momentum levels, often added as dotted or filled areas to spot blow-off tops/bottoms.
Key Differences from Regular CCI
Standard CCI lives in a lower pane with fixed horizontal lines at +100, 0, and -100, forcing you to split your focus. This version overlays everything on price: the bands curve with market volatility, the zero line becomes a moving average, and the extra SMA/signal line integrates seamlessly for price-action trading. Plus, it naturally supports outer ±200 zones without extra coding, making extremes visually pop.
How Traders Use It
Momentum breakouts: Buy when price closes above the +100 aqua band (or +200 for aggressive entries); sell below -100 purple (or -200).
Mean reversion: Fade touches on the bands—take profits if price rejects the +100/-100 levels, or watch for exhaustion at ±200.
Trend bias: Price above orange zero = bullish filter; below = bearish. Use the extra SMA for confirmation (e.g., price crossing above it signals upside).
Crossover signals: Price vs. the thick purple SMA line—bullish above, bearish below—pairs perfectly with band breaks.
Range trading: Treat ±100 bands as dynamic support/resistance; outer ±200 zones highlight potential breakout setups.
This setup shines in trending markets (e.g., stocks or forex on 1H/daily charts), turning CCI into a one-glance channel system. Start with the defaults, add the ±200 and extra SMA via simple code tweaks, and backtest for your style—it's versatile and reduces screen clutter dramatically.
More Info
The 20 period MA is the original and still the most common setting for CCI, and it is exactly what the creator of the CCI, Donald Lambert, published it in 1980 with these exact parameters:
Length: 20 periods
Constant: 0.015 (to make CCI fall between +100 and –100 about 70–80 % of the time)
Typical Price: hlc3 (or sometimes (high + low + close)/3)
Deviation measure: Mean Deviation (not standard deviation)
So the “Trinity CCI Pro Plus” you are using is 100 % faithful to Lambert’s original design when the length is set to 20.

Enhanced CCI with Trend FiltersThis indicator combines the power of the Commodity Channel Index (CCI) with adaptive trend filters and divergence detection to identify high-probability trading opportunities. It's designed to reduce false signals by incorporating trend direction and divergence confirmation.
🔍 How It Works:
1. Trend Detection:
- Uses an adaptive Simple Moving Average (SMA) that automatically adjusts between daily and weekly timeframes
- Daily mode: Default 200 SMA for longer-term trend
- Weekly mode: Default 40 SMA for broader market perspective
- Trend direction is determined by comparing current SMA value to its previous value
2. CCI Component:
- Traditional CCI calculation with customizable length (default: 20)
- Adjustable overbought (default: +100) and oversold (default: -100) levels
- Color-coded CCI line for quick visual reference:
* Green: Overbought and rising
* Red: Oversold and falling
* Gray: Neutral zone
3. Signal Generation:
- Buy Signal (Green Background):
* CCI crosses above oversold level AND
* Main trend is confirmed bullish (rising SMA)
- Sell Signal (Red Background):
* CCI crosses below overbought level AND
* Main trend is confirmed bearish (falling SMA)
4. Divergence Detection:
- Automatically identifies bullish and bearish divergences
- Bullish Divergence: Price makes lower low while CCI makes higher low
- Bearish Divergence: Price makes higher high while CCI makes lower high
- Visualized with distinct markers on the CCI line
- Can be used to set up alerts for divergence confirmations
⚙️ Customization Options:
- CCI calculation length and price source
- Overbought/Oversold levels
- SMA lengths for daily and weekly modes
- Divergence lookback period
- Signal colors and visualization settings
🔔 Alert Capabilities:
- Set alerts for CCI crossovers of overbought/oversold levels
- Create divergence detection alerts
- Configure trend change notifications
- Combine multiple conditions for complex alert strategies
💡 Trading Tips:
- Combine divergence signals with trend direction for better accuracy
- Wait for signal confirmation before entering trades
- Use additional indicators or price action for exit decisions
This indicator helps traders identify potential trend reversals while keeping them aligned with the main market trend. Perfect for both trend following and counter-trend strategies when used appropriately.
Tags: CCI, trend following, divergence, momentum, signals, SMA, multi-timeframe, technical analysis, trend filter, oversold, overbought
Note: Past performance does not guarantee future results. Always combine with proper risk management.

MTF CCI + Realtime DivergencesMulti-timeframe Commodity Channel Index (CCI) + Realtime Divergences + Alerts
This version of the CCI includes the following features:
- Optional 2x sets of triple-timeframe overbought and oversold signals with fully configurable timeframes and overbought and oversold thresholds, can indicate where 3 selected timeframes are all overbought or all oversold at the same time, with alert option.
- Optional divergence lines drawn directly onto the oscillator in realtime, with alert options.
- Configurable pivot periods to fine tune the divergences drawn in order to suit different trading styles and timeframes, including the ability to enable automatic adjustment of pivot period per chart timeframe.
- Alternate timeframe feature allows you to configure the oscillator to use data from a different timeframe than the chart it is loaded on.
- 'Hide oscillator' feature allows traders to hide the oscillator itself, leaving only the background colours indicating the overbought and oversold periods and/or MTF overbought and oversold confluences, as seen in the chart image.
- Also includes standard configurable CCI options, including CCI length and source type. Defaults set to length 20, and hlc3 source type.
- Optional Flip oscillator feature, allows users to flip the oscillator upside down, for use with Tradingviews 'Flip chart' feature (Alt+i), for the purpose of manually spotting divergences, where the trader has a strong natural bias in one direction, so that they can flip both the chart and the oscillator.
- Optional 'Fade oscillator' feature, which will fade out all but the most recent period, reducing visual noise on the chart.
While this version of the CCI has the ability to draw divergences in realtime along with related alerts so you can be notified as divergences occur without spending all day watching the charts, the main purpose of this indicator was to provide the triple-timeframe overbought and oversold confluence signals, in an attempt to add more confluence, weight and reliability to the single timeframe overbought and oversold states, commonly used for trade entry confluence. It's primary purpose is intended for scalping reversal trades on lower timeframes, typically between 1-15 minutes, which can be used in conjunction with the regular divergences the indicator can highlight. The triple timeframe overbought can often indicate near term reversals to the downside, with the triple timeframe oversold often indicating neartime reversals to the upside. The default timeframes for this confluence are set to check the 1m, 5m and 15m timeframes together, ideal for scalping the < 15 minute charts. The default settings for the MTF #1 timeframes (1m, 5m and 15m) are best used on a <5 minute chart.
Its design and use case is based upon the original MTF Stoch RSI + Realtime Divergences found here .
Commodity Channel Index (CCI)
Investopedia has described the popular oscillator as follows:
“The Commodity Channel Index (CCI) is a momentum-based oscillator used to help determine when an investment vehicle is reaching a condition of being overbought or oversold.
Developed by Donald Lambert, this technical indicator assesses price trend direction and strength, allowing traders to determine if they want to enter or exit a trade, refrain from taking a trade, or add to an existing position. In this way, the indicator can be used to provide trade signals when it acts in a certain way.”
You can read more about the CCI, its use cases and calculations here .
How do traders use overbought and oversold levels in their trading?
The oversold level, that is traditionally when the CCI is above the 100 level is typically interpreted as being 'overbought', and below the -100 level is typically considered 'oversold'. Traders will often use the CCI at an overbought level as a confluence for entry into a short position, and the CCI at an oversold level as a confluence for an entry into a long position. These levels do not mean that price will necessarily reverse at those levels in a reliable way, however. This is why this version of the CCI employs the triple timeframe overbought and oversold confluence, in an attempt to add a more confluence and reliability to this usage of the CCI. While traditionally, the overbought and oversold levels are below -100 for oversold, and above 100 for overbought, he default threshold settings of this indicator have been increased to provide fewer, stronger signals, especially suited to the low timeframes and highly volatile assets.
What are divergences?
Divergence is when the price of an asset is moving in the opposite direction of a technical indicator, such as an oscillator, or is moving contrary to other data. Divergence warns that the current price trend may be weakening, and in some cases may lead to the price changing direction.
There are 4 main types of divergence, which are split into 2 categories;
regular divergences and hidden divergences. Regular divergences indicate possible trend reversals, and hidden divergences indicate possible trend continuation.
Regular bullish divergence: An indication of a potential trend reversal, from the current downtrend, to an uptrend.
Regular bearish divergence: An indication of a potential trend reversal, from the current uptrend, to a downtrend.
Hidden bullish divergence: An indication of a potential uptrend continuation.
Hidden bearish divergence: An indication of a potential downtrend continuation.
How do traders use divergences in their trading?
A divergence is considered a leading indicator in technical analysis , meaning it has the ability to indicate a potential price move in the short term future.
Hidden bullish and hidden bearish divergences, which indicate a potential continuation of the current trend are sometimes considered a good place for traders to begin, since trend continuation occurs more frequently than reversals, or trend changes.
When trading regular bullish divergences and regular bearish divergences, which are indications of a trend reversal, the probability of it doing so may increase when these occur at a strong support or resistance level . A common mistake new traders make is to get into a regular divergence trade too early, assuming it will immediately reverse, but these can continue to form for some time before the trend eventually changes, by using forms of support or resistance as an added confluence, such as when price reaches a moving average, the success rate when trading these patterns may increase.
Typically, traders will manually draw lines across the swing highs and swing lows of both the price chart and the oscillator to see whether they appear to present a divergence, this indicator will draw them for you, quickly and clearly, and can notify you when they occur.
Setting alerts.
With this indicator you can set alerts to notify you when any/all of the above types of divergences occur, on any chart timeframe you choose, and also when the triple timeframe overbought and oversold confluences occur.
Configurable pivot period.
You can adjust the default pivot period values to suit your prefered trading style and timeframe. If you like to trade a shorter time frame, lowering the default lookback values will make the divergences drawn more sensitive to short term price action. By default, this indicator has enabled the automatic adjustment of the pivot periods for 4 configurable timeframes, in a bid to optimise the divergences drawn when the indicator is loaded onto any of the 4 timeframes. These timeframes and the auto adjusted pivot periods on each of them can also be reconfigured within the settings menu.
Disclaimer: This script includes code adapted from the Divergence for Many Indicators v4 by LonesomeTheBlue . With special thanks.

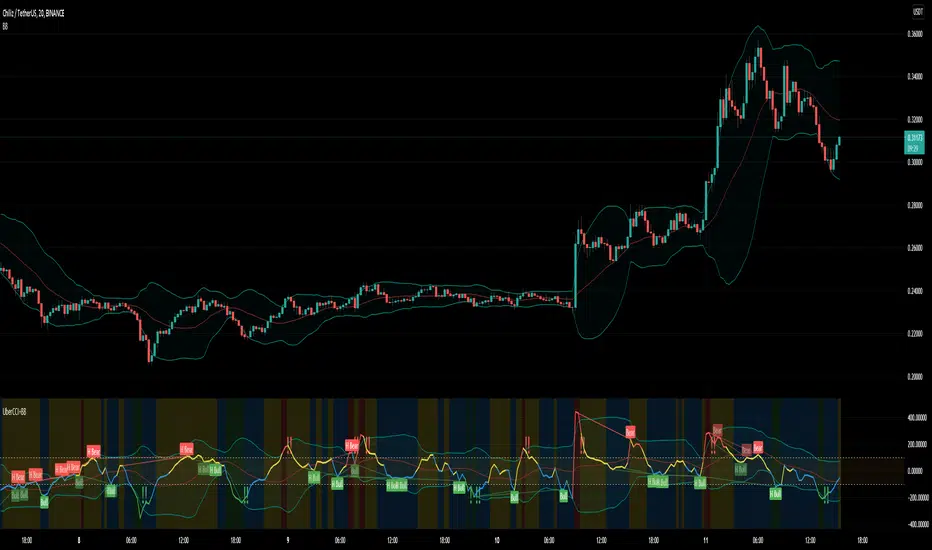
Uber Dank CCI + Captain Beefheart Bollinger Bands ExtraordinareIntroducing, the Uber Dank CCI + Captain Beefheart Bollinger Bands Extraordinaire
Its bollinger bands, CCI and CCI Bollinger Bands all in one.
The color of the CCI shows the condition of the bollinger band on chart.
Close > upper band = red
Close > basis = yellow
Close < basis = blue
Close < lower band = green
Then a bollinger band is printed on the CCI itself,
The background color displays the condition of the CCI bollinger band by the same logic as the CCI color.
CCI > upper band = red
CCI > basis = yellow
CCI < basis = blue
CCI < lower band = green
The exclamation marks tell you when the conditions are coming to an end. They check the last two bars to see if both the CCI and the closing price are under their bollinger bands at the same time for at least one of those bars, and they check the current bar that at least one of those conditions has ended. That is why they will most often print two exclamation marks in a row.
HTC peppermint_07 CCI w signal + s&r RSI
This CCI version enhances the traditional Commodity Channel Index (CCI) by integrating a dynamically calculated Relative Strength Index (RSI) that acts as support and resistance as shown in the screenshot, it can add as a confirmation to the divergence found in the CCI.
Key Features:
Enhanced CCI: The primary plot (black line but customizable) represents the standard CCI, providing insight into price momentum and potential overbought/oversold conditions.
Dynamic RSI Support/Resistance: The upper and lower bands (medium cyan line) are derived from a smoothed RSI, dynamically adjusting to the current market volatility. These bands serve as potential support and resistance levels for the CCI as additional confirmation for the divergence.
Overbought/Oversold Zones: The traditional overbought (+100) and oversold (-100) levels for CCI are marked with horizontal dotted lines.
Benefits:
Improved Entry/Exit Signals: Combining CCI with dynamic RSI support/resistance may offer more precise trading signals compared to using CCI alone.
Dynamic Adaptation: The RSI-based bands adapt to changing market conditions, potentially providing more relevant support and resistance levels.
Divergence Confirmation: dynamic s&r RSI adds confluence to potential trend reversals identified by the CCI.
Potential Usage:
Traders might use this indicator to:
Identify potential overbought/oversold conditions using the CCI and its relationship to the dynamic RSI bands.
Look for breakouts beyond the dynamic support/resistance levels as potential entry points.
Confirm potential trend reversals using RSI divergence (cyan and red label above divergence) signals.
Further Development Considerations:
Customizable Parameters: Allowing users to adjust the CCI length, RSI periods, and smoothing factors would enhance flexibility.
Alert Conditions: Adding alerts for breakouts, overbought/oversold conditions, and divergence signals would improve usability.
Backtesting: Thoroughly backtesting the indicator's performance across different assets and timeframes is essential before using it for live trading.
DISCLAIMER: !!
indicator is a custom technical analysis tool designed for educational and informational purposes only. It should not be construed as financial advice or a recommendation to buy or sell any security. Trading involves substantial risk of loss and may not be suitable for all investors.
Key Points to Consider:
No Guarantee of Profitability: The indicator's past performance is not indicative of future results. No trading strategy can guarantee profits or eliminate the risk of losses. You could lose some or all of your investment.
Use at Your Own Risk: Use of this indicator is solely at your own discretion and risk. You are responsible for your trading decisions. The developers and distributors of this indicator are not liable for any losses incurred as a result of using it.
Not Financial Advice: This indicator does not provide financial advice. Consult with a qualified financial advisor before making any investment decisions.
Backtesting Limitations: Backtested results, if presented, should be viewed with caution. Past performance may not reflect future results due to various factors, including changing market conditions and the limitations of backtesting methodologies.
Indicator Limitations: Technical indicators, including this one, are not perfect. They can generate false signals, and their effectiveness can vary depending on market conditions and the specific parameters used.
Parameter Optimization: Optimizing indicator parameters for past performance can lead to overfitting, which may not translate to future profitability.
No Warranty: The indicator is provided "as is" without any warranty of any kind, either express or implied, including but not limited to warranties of merchantability, fitness for a particular purpose, or non-infringement.
Changes and Updates: The developers may make changes or updates to the indicator without notice.
By using the "HTC peppermint_07 CCI w signal + s&r RSI" indicator, you acknowledge and agree to the terms of this disclaimer. If you do not agree with these terms, do not use the indicator.

[blackcat] L1 Multi-Component CCIOVERVIEW
The " L1 Multi-Component CCI" is a sophisticated technical indicator designed to analyze market trends and momentum using multiple components of the Commodity Channel Index (CCI). This script calculates and combines various CCI-related metrics to provide a comprehensive view of price action, offering traders deeper insights into market dynamics. By integrating smoothed deviations, normalized ranges, and standard CCI values, this tool aims to enhance decision-making processes. It is particularly useful for identifying potential reversal points and confirming trend strength. 📈
FEATURES
Multi-Component CCI Calculation: Combines smoothed deviation, normalized range, percent above low, and standard CCI for a holistic analysis, providing a multifaceted view of market conditions.
Threshold Lines: Overbought (200), oversold (-200), bullish (100), and bearish (-100) thresholds are plotted for easy reference, helping traders quickly identify extreme market conditions.
Visual Indicators: Each component is plotted with distinct colors and line styles for clear differentiation, making it easier to interpret the data at a glance.
Customizable Alerts: The script includes commented-out buy and sell signal logic that can be enabled for automated trading notifications, allowing traders to set up alerts based on specific conditions. 🚀
Advanced Calculations: Utilizes a combination of simple moving averages (SMA) and exponential moving averages (EMA) to smooth out price data, enhancing the reliability of the indicator.
HOW TO USE
Apply the Script: Add the script to your chart on TradingView by searching for " L1 Multi-Component CCI" in the indicators section.
Observe the Plotted Lines: Pay close attention to the smoothed deviation, normalized range, percent above low, and standard CCI lines to identify potential overbought or oversold conditions.
Use Threshold Levels: Refer to the overbought, oversold, bullish, and bearish threshold lines to gauge extreme market conditions and potential reversal points.
Confirm Trends: Use the standard CCI line to confirm trend direction and momentum shifts, providing additional confirmation for your trading decisions.
Enable Alerts: If desired, uncomment the buy and sell signal logic to receive automated alerts when specific conditions are met, helping you stay informed even when not actively monitoring the chart. ⚠️
LIMITATIONS
Fixed Threshold Levels: The script uses fixed threshold levels (200, -200, 100, -100), which may need adjustment based on specific market conditions or asset volatility.
No Default Signals: The buy and sell signal logic is currently commented out, requiring manual activation if you wish to use automated alerts.
Complexity: The multi-component approach, while powerful, may be complex for novice traders to interpret, requiring a solid understanding of technical analysis concepts. 📉
Not for Isolation Use: This indicator is not designed for use in isolation; it is recommended to combine it with other tools and indicators for confirmation and a more robust analysis.
NOTES
Smoothing Techniques: The script uses a combination of simple moving averages (SMA) and exponential moving averages (EMA) for smoothing calculations, which helps in reducing noise and enhancing signal clarity.
Multi-Component Approach: The multi-component approach aims to provide a more nuanced view of market conditions compared to traditional CCI, offering a more comprehensive analysis.
Customization Potential: Traders can customize the script further by adjusting the parameters of the moving averages and other components to better suit their trading style and preferences. ✨
THANKS
Thanks to the TradingView community for their support and feedback on this script! Special thanks to those who contributed ideas and improvements, making this tool more robust and user-friendly. 🙏

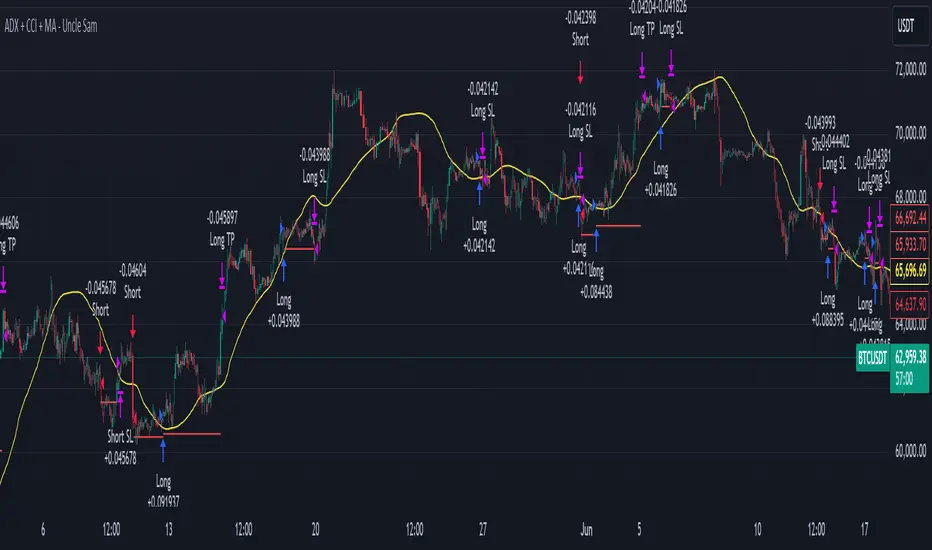
ADX + CCI + MA - Uncle SamStrategy Name: ADX + CCI + MA - Uncle Sam
Overview
This strategy aims to capitalize on trending markets by combining the Average Directional Index (ADX), Commodity Channel Index (CCI), and a customizable Moving Average (MA). It's designed for traders seeking a balanced approach to both long (buy) and short (sell) opportunities. Special thanks to the creators of the ADX and CCI indicators for their invaluable contributions to technical analysis.
Strategy Concept
The core idea is to identify strong trends with the ADX, confirm potential entry points with the CCI, and use the MA to filter trades in the direction of the broader trend. This approach seeks to avoid entering positions during periods of consolidation or when the trend is weak.
Indicator Logic
ADX (Average Directional Index): The ADX measures the strength of a trend, regardless of its direction. A value above the customizable adx_threshold (default 20) signals a strong trend, making it a prime environment for this strategy.
CCI (Commodity Channel Index): The CCI is a momentum oscillator that helps identify overbought (above 100) and oversold (below -100) conditions. We use CCI crossovers to time entries in the direction of the prevailing trend.
MA (Moving Average): The MA acts as a trend filter, ensuring we only enter trades aligned with the overall market direction. You have flexibility in choosing the MA type (SMA, EMA, etc.) and its length to suit your trading style and timeframe.
Entry Conditions
Long (Buy):
ADX is above the adx_threshold.
CCI crosses above 100.
Price is above the chosen Moving Average (if MA trend filtering is enabled).
Short (Sell):
ADX is above the adx_threshold.
CCI crosses below -100.
Price is below the chosen Moving Average (if MA trend filtering is enabled).
Exit Conditions
Stop Loss (SL): Each position has a customizable stop-loss percentage to manage risk. The default setting is 1%.
Take Profit (TP): Each position has a customizable take-profit percentage to secure gains. The default setting is 5%.
MA-Based Risk Management (Optional): This feature allows for early exits if the price closes against the MA trend for a specified number of candles. The default setting is 2 candles.
Default Settings
CCI Period: 15
ADX Length: 10
ADX Threshold: 20
MA Type: HMA
MA Length: 200
MA Source: Close
Commission Fee: $0.0
A commission fee is not added, add your trading/platform commission for realistic trading costs.
Backtest Results
The strategy has been backtested on with the default settings and a starting capital of $1000, with 0.0% commission fee. It shows promising results.
Disclaimer: Backtesting is hypothetical and does not guarantee future performance.
Important Considerations:
Customization: The strategy offers extensive customization to tailor it to your preferences. Experiment with different parameters and settings to find what works best for your trading style.
Risk Management: Always use proper risk management techniques, including position sizing and stop losses, to protect your capital.
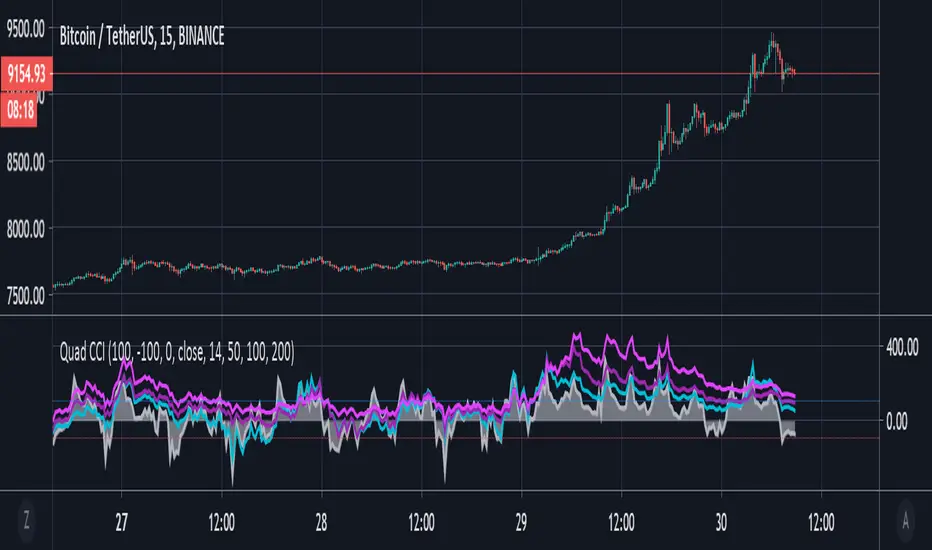
Quad CCI ContainmentThe Quad CCI is a trend identification indicator described by Mark Whistler in his book 'Volatility Illuminated'. The reason for using four separate CCI channels is so that we can:
Prevent ourselves from taking positions against momentum.
Time our trades with short-term 'wrist-rocket' thrust from the larger market momentum.
Clearly determine whether the trend is up, down, or sideways.
In his book, Whistler refers to four CCI channels as 'The Four Horsemen'. The 100 and 200 are like big burly swordsmen, which are hard to budge without significant force. The 50-period CCI is more like the guy who's fast on his feet, but still tough enough to take on the big dudes. And the 14-period is similar to the scout of the party. The fastest of the bunch, but also the first to turn-tail at any sign of danger.
Basically, this means that when we see the 100 and 200-CCI stay above the 0 line, we can infer there really isn't any reason for them to move out of their range. The 50-period CCI will sometimes venture over the 0-line, before the hefty battlers. However, the 14-period will often venture (quickly) way out into the yonder, and he will always return to tell his pals what he's found. Crossing back over the 100-line, traders can take 'rocket trend reentry' positions (usually on the median); however, we still want to keep an eye on the flighty 14-period CCI character. If he crosses back over the +100 or -100 level he was just scouting, it means the larger weighted CCI lines could soon to follow too, as the whole bunch runs from larger momentum on the way.
Traders seeking to take a position 'with the trend' can attempt to purchase pullbacks on the mean if:
Longer-term CCI (at least the 200 and 100) are above zero.
The 50-period CCI is not below -100.
The 14-period travels back up from underneath the -100 area.
AP_Ultimate CCI MTF v5**AP Ultimate CCI Multi-Timeframe Indicator**
*Track Commodity Channel Index trends across multiple timeframes in one view!*
**Overview:**
Adapted from ChrisMoody's popular RSI MTF concept, this enhanced version brings powerful multi-timeframe analysis to the CCI indicator. Perfect for traders who want to confirm trends across different time horizons without switching charts.
**Key Features:**
📈 **Dual CCI Analysis**
- Primary CCI (Default: 1H) + Secondary CCI (Default: 4H)
- Fully customizable timeframes for both indicators
- Independent length settings (14-50 periods recommended)
🚦 **Visual Trading Signals**
- Automatic Buy/Sell markers on crossovers
- 🟢 **B** Signals: When CCI crosses above -100 (Oversold reversal)
- 🔴 **S** Signals: When CCI crosses below +100 (Overbought reversal)
- Clean triangular markers at chart edges for clear visibility
🎨 **Customizable Visuals**
- Adjustable overbought/oversold levels (Default: ±100)
- Background highlights for extreme zones
- Modern color schemes with transparency control
- Optional zero line display
⚙️ **Technical Specs**
- Built in Pine Script v6
- Non-repainting calculations
- Timeframe-aware alerts support
- Optimized for all asset classes
**How to Use (my use case):**
1. Apply to 15M-4H charts for intraday trading
2. Default setup: Compare 1H vs 4H CCI
3. Look for confluence between timeframes:
- Strong trend = Both CCIs moving in same direction
- Reversal signal = Crossovers with volume confirmation
4. Combine with price action or support/resistance
**Why this Indicator:**
✅ Eliminates manual timeframe switching
✅ Identifies hidden divergences between time horizons
✅ Works equally well for stocks, forex, and crypto
✅ Perfect for momentum and mean-reversion strategies
*Pro Tip: Pair with volume indicators and moving averages for enhanced confirmation!*

Step-MA Filtered CCI [Loxx]Step-MA Filtered CCI is a CCI indicator that is filtered using a stepping moving average function. This produces a CCI that is much cleaner due to noise reduction.
What is CCI?
The Commodity Channel Index ( CCI ) measures the current price level relative to an average price level over a given period of time. CCI is relatively high when prices are far above their average. CCI is relatively low when prices are far below their average. Using this method, CCI can be used to identify overbought and oversold levels.
Included:
Bar coloring
3 signal variations w/ alerts
Loxx's Expanded Source Types

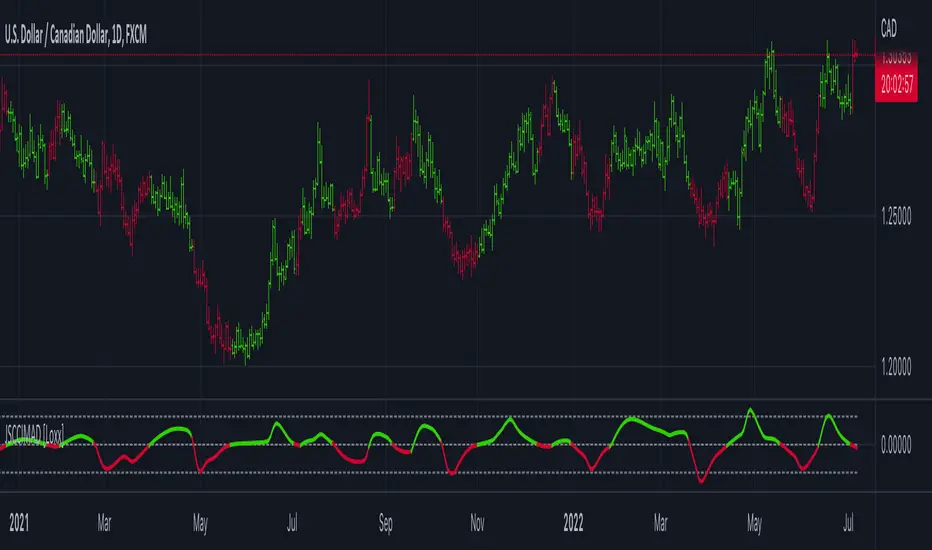
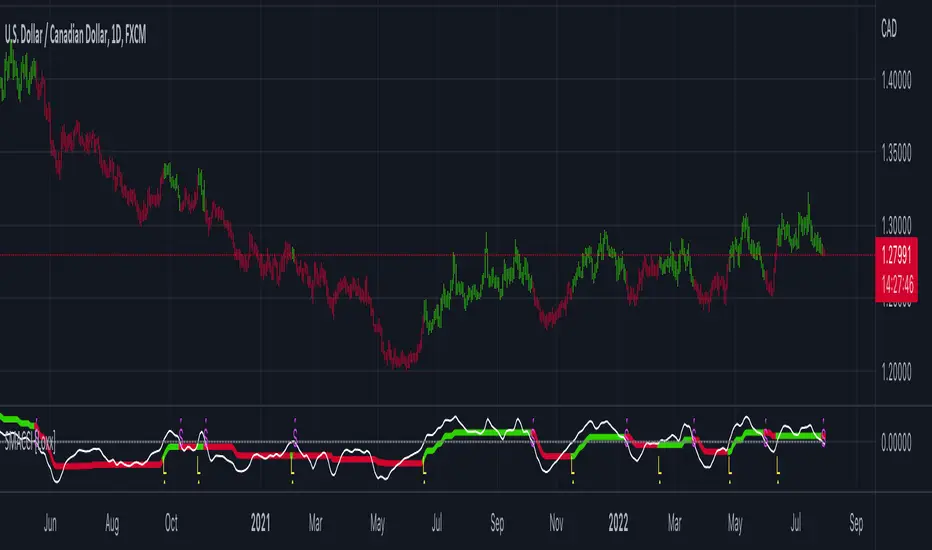
TMS CCI is based on Commodity Channel IndexThis indicator is based on CCI, but draws the CCI link green/red. If CCI line is above zero, then it is painted green. If CCI is lower than zero, then it is painted red.
How to trade:
Buy Side
1. When CCI crosses above zeroline from under, it is a bullish signal, Wait for the candle to close and place an order at the closing price. Exit when CCI crosses below zeroline.
Sell Side
2. When CCI crosses below zeroline from above, it is a bearish signal, Wait for the candle to close and place an order at the closing price. Exit when CCI crosses above zeroline.

Jurik-Smoothed CCI w/ MA Deviation [Loxx]Jurik-Smoothed CCI w/ MA Deviation is a spin on regular CCI. Usually CCI is calculated as using average (Simple Moving Average) and mean deviation. In this version, average is replaced with well known JMA (Jurik Moving Average) instead for the smoothing phase and the deviation is replaced with variety moving average deviation. The result in this one is responsive and fast (as expected) and also it is smoother than the original CCI (as expected).
What is CCI?
The Commodity Channel Index (CCI) measures the current price level relative to an average price level over a given period of time. CCI is relatively high when prices are far above their average. CCI is relatively low when prices are far below their average. Using this method, CCI can be used to identify overbought and oversold levels.
What is Jurik Volty used in the Juirk Filter?
One of the lesser known qualities of Juirk smoothing is that the Jurik smoothing process is adaptive. "Jurik Volty" (a sort of market volatility ) is what makes Jurik smoothing adaptive. The Jurik Volty calculation can be used as both a standalone indicator and to smooth other indicators that you wish to make adaptive.
What is the Jurik Moving Average?
Have you noticed how moving averages add some lag (delay) to your signals? ... especially when price gaps up or down in a big move, and you are waiting for your moving average to catch up? Wait no more! JMA eliminates this problem forever and gives you the best of both worlds: low lag and smooth lines.
Included:
Bar coloring
35+ moving averages
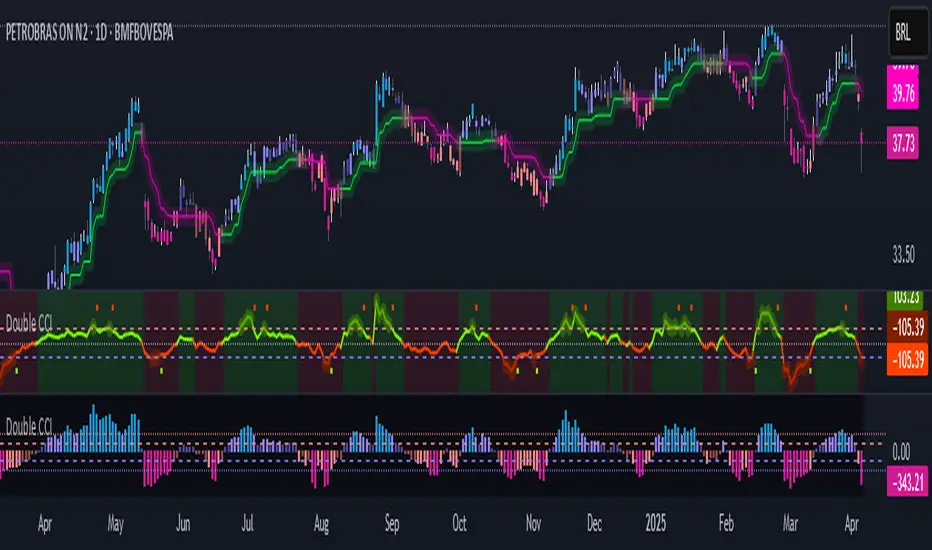
Double MA CCI"What is the Commodity Channel Index (CCI)?
Developed by Donald Lambert, the Commodity Channel Index (CCI) is a momentum-based oscillator used to help determine when an investment vehicle is reaching a condition of being overbought or oversold. It is also used to assess price trend direction and strength. This information allows traders to determine if they want to enter or exit a trade, refrain from taking a trade, or add to an existing position. In this way, the indicator can be used to provide trade signals when it acts in a certain way.
KEY TAKEAWAYS
• The CCI measures the difference between the current price and the historical average price.
• When the CCI is above zero it indicates the price is above the historic average. When CCI is below zero, the price is below the hsitoric average.
• High readings of 100 or above, for example, indicate the price is well above the historic average and the trend has been strong to the upside.
• Low readings below -100, for example, indicate the price is well below the historic average and the trend has been strong to the downside.
• Going from negative or near-zero readings to +100 can be used as a signal to watch for an emerging uptrend.
• Going from positive or near-zero readings to -100 may indicate an emerging downtrend.
• CCI is an unbounded indicator meaning it can go higher or lower indefinitely. For this reason, overbought and oversold levels are typically determined for each individual asset by looking at historical extreme CCI levels where the price reversed from." ----> 1
SOURCE
1: (SINCE IM NOT A "PRO" MEMBER I C'ANT POST THE SOUCRE URL..., webpage consulted at : 8:50 GMT -5 ; the 2020-01-18)
I- Added a 2nd MA length and changed the default values of the source type and switched the SMA to a MA.
II- In process to add analytic MACD histogram correlation and if possible, ploting a relative histogram between the CCI upper and lower band.
P.S.:
Don't set your moving averages lengths to far from each other... This could result in fewer convergence and divergence, also in fewer crossing MA's.
Have a good year 2020 !!
//----CODER----//
R.V.

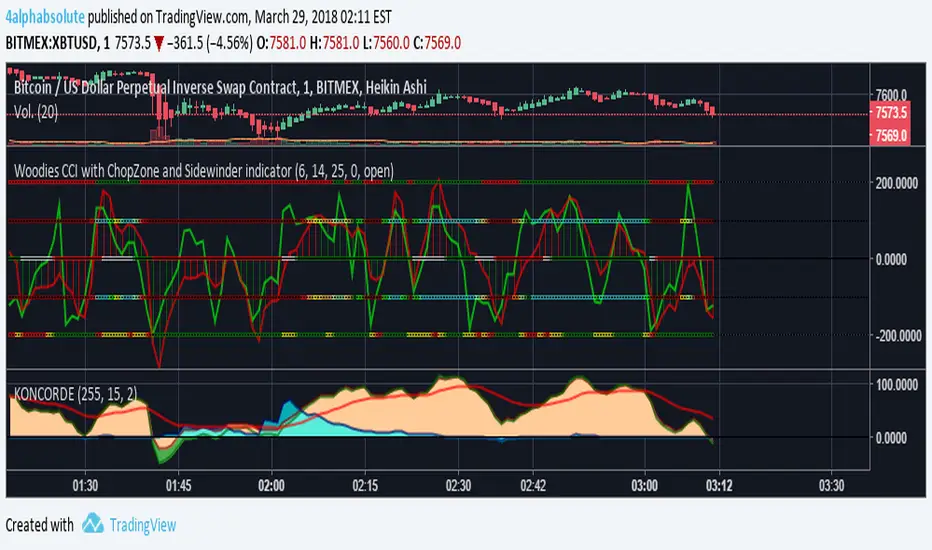
Woodies CCI with ChopZone and Sidewinder indicatorExcelente indicador a mi parecer, bastante complejo pero muy bien acoplado; dejo aquí las fuentes para aprender a utilizarlo:
www.x-trader.net
www.x-trader.net www.x-trader.net www.x-trader.net
RSI, CCI, ADX Panel (Custom TF for Each)RSI, CCI, and ADX Combined – Multi-Timeframe, Fully Customizable Panel Indicator for TradingView
Overview
This Pine Script indicator integrates the Relative Strength Index (RSI), Commodity Channel Index (CCI), and Average Directional Index (ADX) into a single, clean panel for effortless technical analysis. Each indicator operates independently, with customizable length, smoothing, and time frame for maximum flexibility. Traders can now monitor momentum, trend strength, and overbought/oversold conditions across different time frames—all in one place.
Key Features
Independent Controls: Set length, smoothing (ADX), and time frame individually for each indicator via the settings panel.
Multi-Timeframe Support: Each oscillator (RSI, CCI, ADX) can be calculated on its own time frame, enabling nuanced inter-timeframe analysis.
Customizable Visualization: Adjust line color and thickness for each indicator to match your chart style.
Clean, Non-Overlay Display: All three indicators are plotted in a dedicated panel beneath the price chart, reducing clutter.
Reference Levels: Includes standard reference lines for oversold/overbought (RSI, CCI) and trend threshold (ADX) for quick visual cues.
Usage Ideas
Swing Trading: Compare short- and long-term momentum using different time frames for RSI, CCI, and ADX.
Trend Confirmation: Use ADX to filter RSI and CCI signals—only trade overbought/oversold conditions during strong trends.
Divergence Hunting: Spot divergences between time frames for early reversal signals.
Scalping: Set RSI and CCI to lower time frames for entry, while monitoring higher timeframe ADX for trend context.
How to Install
Paste the script into the Pine Editor on TradingView.
Add to chart. Adjust settings as desired.
Save as a template for quick reuse on any chart—all your custom settings will be preserved.
Customization
Edit lengths and time frames in the indicator’s settings dialog.
Toggle reference lines on/off as needed.
Fine-tune line appearance (color, thickness) for clarity.
Note:
This indicator does not provide automated buy/sell signals. It is a customizable analytical tool for manual or semi-automated trading. Use in combination with other technical or fundamental analysis for best results.
Combine Momentum, Trend, and Volatility—Seamlessly and Visually—With One Indicator.

Matrix Series and Vix Fix with VWAP CCI and QQE SignalsMatrix Series and Vix Fix with VWAP CCI and QQE Signals
Short Title: Advanced Matrix
Purpose
This Pine Script combines multiple technical analysis tools to create a comprehensive trading indicator. It incorporates elements like support/resistance zones, overbought/oversold conditions, Williams Vix Fix, QQE (Quantitative Qualitative Estimation) signals, VWAP CCI signals, and a 200-period SMA for trend filtering. The goal is to provide actionable buy and sell signals with enhanced visualization.
Key Features and Components
1. Matrix Series
Smoothing Input: Allows customization of EMA smoothing for the indicator (default: 5).
Support/Resistance Zones: Based on CCI (Commodity Channel Index) values.
Dynamic zones calculated with customizable parameters (SupResPeriod, SupResPercentage, PricePeriod).
Candlestick Visualization: Custom candlestick plots with colors indicating trends.
Dynamic levels for overbought/oversold conditions.
2. Overbought/Oversold Signals
Overbought and oversold levels are adjustable (ob and os).
Plots circles on the chart to highlight extreme conditions.
3. Williams Vix Fix
Identifies potential reversal points by analyzing volatility.
Uses Bollinger Bands and percentile thresholds to detect high-probability entries.
Includes two alert levels (alert1 and alert2) with customizable criteria for signal filtering.
4. QQE Signals
Based on the smoothed RSI and QQE methodology.
Detects trend changes using adaptive ATR bands (FastAtrRsiTL).
Plots long and short signals when specific conditions are met.
5. VWAP CCI Signals
Combines VWAP and CCI for additional trade signals.
Detects crossovers and crossunders of CCI levels (-200 and 200) to generate long and short signals.
6. 200 SMA
A 200-period simple moving average is plotted to act as a trend filter.
The script rules recommend buying only when the price is above the SMA200.
Customizable Inputs
General:
Smoothing, support/resistance periods, overbought/oversold levels.
Williams Vix Fix:
Lookback periods, Bollinger Band settings, percentile thresholds.
QQE:
RSI length, smoothing factor, QQE factor, and threshold values.
VWAP CCI:
Length for calculating deviations.
Visual Elements
Dynamic candlestick colors to indicate trend direction.
Overbought/oversold circles for extreme price levels.
Resistance and support lines.
Labels and shapes for buy/sell signals from Vix Fix, QQE, and VWAP CCI.
Alerts
Alerts are configured for the Matrix Series (e.g., "BUY MATRIX") and other components, ensuring traders are notified when significant conditions are met.
Intended Use
This indicator is designed for traders seeking a multi-faceted tool to analyze market trends, identify potential reversal points, and generate actionable trading signals. It combines traditional indicators with advanced techniques for comprehensive market analysis.

Adaptive-Lookback CCI w/ Double Juirk Smoothing [Loxx]Adaptive-Lookback CCI w/ Double Juirk Smoothing is a CCI indicator with Adaptive period inputs. The adaptive calculation in this case is the count of pivots in historical bars. This indicator is also double smoothing using Jurik smoothing to reduce noise and refine the signal.
What is CCI?
The Commodity Channel Index ( CCI ) measures the current price level relative to an average price level over a given period of time. CCI is relatively high when prices are far above their average. CCI is relatively low when prices are far below their average. Using this method, CCI can be used to identify overbought and oversold levels.
What is Jurik Volty used in the Juirk Filter?
One of the lesser known qualities of Juirk smoothing is that the Jurik smoothing process is adaptive. "Jurik Volty" (a sort of market volatility ) is what makes Jurik smoothing adaptive. The Jurik Volty calculation can be used as both a standalone indicator and to smooth other indicators that you wish to make adaptive.
What is the Jurik Moving Average?
Have you noticed how moving averages add some lag (delay) to your signals? ... especially when price gaps up or down in a big move, and you are waiting for your moving average to catch up? Wait no more! JMA eliminates this problem forever and gives you the best of both worlds: low lag and smooth lines.
Included:
Bar coloring
3 signal variations w/ alerts

Stepped Moving Average of CCI [Loxx]Stepped Moving Average of CCI is a CCI that applies a stepping algorithm to smooth CCI. This allows for noice reduction and better identification of breakouts/breakdowns/reversals.
What is CCI?
The Commodity Channel Index ( CCI ) measures the current price level relative to an average price level over a given period of time. CCI is relatively high when prices are far above their average. CCI is relatively low when prices are far below their average. Using this method, CCI can be used to identify overbought and oversold levels.
Included:
Bar coloring
4 signal variations w/ alerts
Loxx's Expanded Source Types
Loxx's Moving Averages
VHF-Adaptive CCI [Loxx]VHF-Adaptive CCI is a CCI indicator with adaptive period inputs using vertical horizontal filtering.
What is CCI?
The Commodity Channel Index ( CCI ) measures the current price level relative to an average price level over a given period of time. CCI is relatively high when prices are far above their average. CCI is relatively low when prices are far below their average. Using this method, CCI can be used to identify overbought and oversold levels.
What is VHF Adaptive Cycle?
Vertical Horizontal Filter (VHF) was created by Adam White to identify trending and ranging markets. VHF measures the level of trend activity, similar to ADX DI. Vertical Horizontal Filter does not, itself, generate trading signals, but determines whether signals are taken from trend or momentum indicators. Using this trend information, one is then able to derive an average cycle length.
Included
Bar coloring
Signals
Alerts
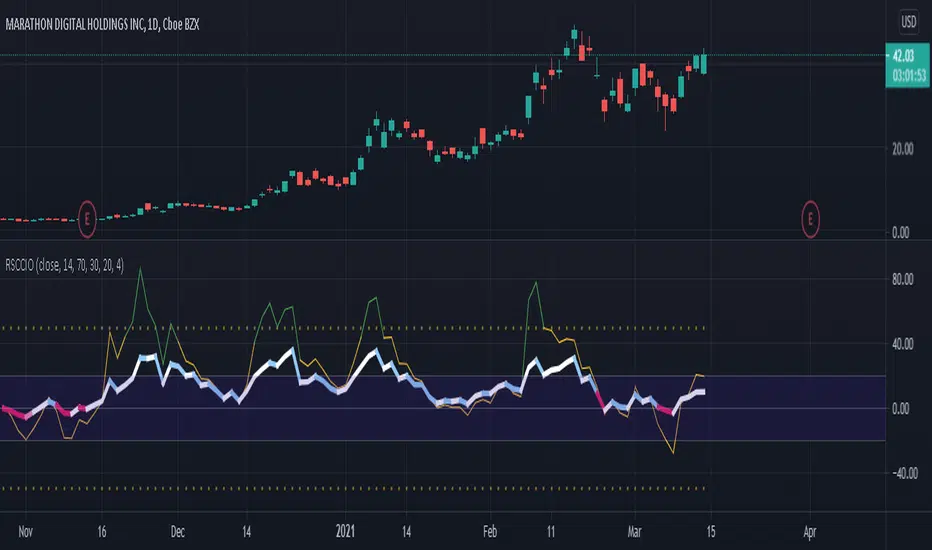
[SK] RSI/CCI Correlating OscillatorThe combination of RSI and CCI can be a powerful tool to efficiently signal the strength of the trend and upcoming reversals.
The magic comes when you're able to correlate both indicators correctly, this is the power I give you with the RSCCIO.
I've added additional features to each indicator that make signals more clear and easier to identify.
On the RSI
Directional color coding similar to what you can find on a MACD. This helps to identify the general trend ( above or below midline ) and the of the movement within.
For precise correlation the RSI is adjusted to a midline of 0. You can still enter the overbought/oversold levels as you'd expect on a regular RSI and it will be automatically adjusted.
On the CCI
Extreme strength / weakness color coding when the value exceeds the range makes signals more clear.
For precise correlation with the RSI, we need to scale down the value of the CCI with the Sensitivity Input. The default value works overall but feel free to play around to adjust the scale of the CCI movement.
---
RSI Relative Strength Index
The RSI is a momentum indicator that measures the magnitude of recent price changes. An asset is usually considered overbought when the RSI is above 70% and oversold when it is below 30%.
CCI Commodity Channel Index
The CCI was originally developed to spot trend changes. Use the CCI on the longer-term chart to establish the dominant trend and on the shorter-term chart to isolate pullbacks and generate trade signals.
[blackcat] L2 Ehlers AutoLength CCI VWAPLevel: 2
Background
John F. Ehlers introuced AutoLength CCI in Sep, 2016.
Function
In “Measuring Market Cycles” in Sep, 2016, John Ehlers described a method that he had developed to measure cycles in market data. Dr. Ehlers presented an indicator using this technique, which he referred to as an autocorrelation periodogram. He also described how this technique for determining the dominant market cycle could be used to help select the period used in other more traditional indicators such as the stochastic, the RSI, and the commodity channel index (CCI). Here, I am providing an example strategy using the concepts presented in the article with CCI and upgraded with CCI VWAP with my own idea.
Key Signal
CCIValue --> Ehlers AutoLength CCI VWAP signal
Pros and Cons
90% John F. Ehlers definition translation, even variable names are the same. This help readers who would like to use pine to read his book.
Remarks
The 87th script for Blackcat1402 John F. Ehlers Week publication.
I upgraded original Ehlers Autolength CCI to Autolength CCI VWAP
Readme
In real life, I am a prolific inventor. I have successfully applied for more than 60 international and regional patents in the past 12 years. But in the past two years or so, I have tried to transfer my creativity to the development of trading strategies. Tradingview is the ideal platform for me. I am selecting and contributing some of the hundreds of scripts to publish in Tradingview community. Welcome everyone to interact with me to discuss these interesting pine scripts.
The scripts posted are categorized into 5 levels according to my efforts or manhours put into these works.
Level 1 : interesting script snippets or distinctive improvement from classic indicators or strategy. Level 1 scripts can usually appear in more complex indicators as a function module or element.
Level 2 : composite indicator/strategy. By selecting or combining several independent or dependent functions or sub indicators in proper way, the composite script exhibits a resonance phenomenon which can filter out noise or fake trading signal to enhance trading confidence level.
Level 3 : comprehensive indicator/strategy. They are simple trading systems based on my strategies. They are commonly containing several or all of entry signal, close signal, stop loss, take profit, re-entry, risk management, and position sizing techniques. Even some interesting fundamental and mass psychological aspects are incorporated.
Level 4 : script snippets or functions that do not disclose source code. Interesting element that can reveal market laws and work as raw material for indicators and strategies. If you find Level 1~2 scripts are helpful, Level 4 is a private version that took me far more efforts to develop.
Level 5 : indicator/strategy that do not disclose source code. private version of Level 3 script with my accumulated script processing skills or a large number of custom functions. I had a private function library built in past two years. Level 5 scripts use many of them to achieve private trading strategy.
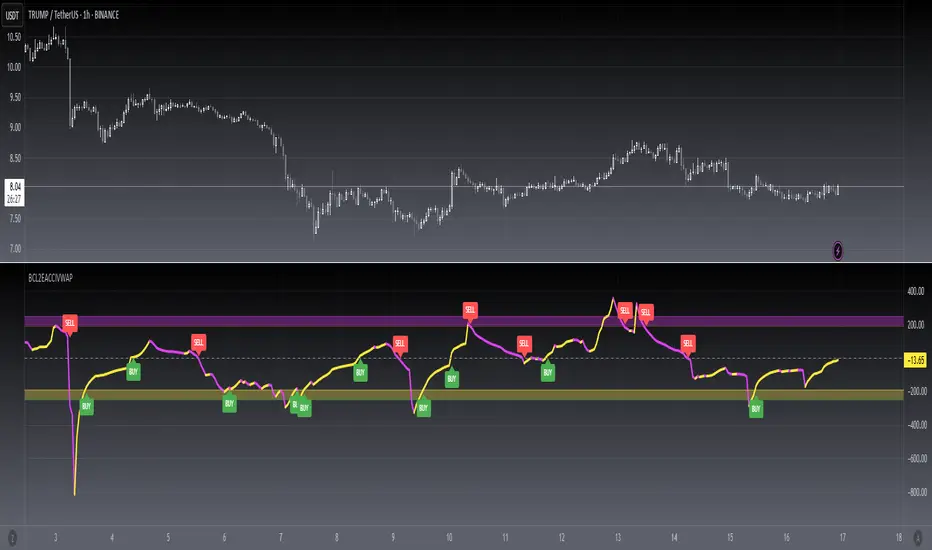
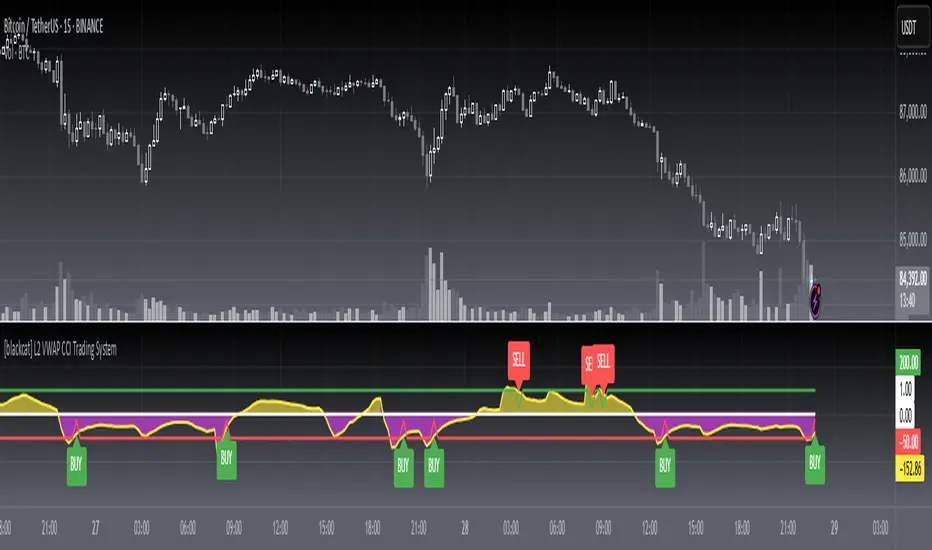
[blackcat] L2 VWAP CCI Trading SystemLevel: 2
Background
Volume-Weighted Average Price (VWAP) is a trading benchmark used by traders that indicates the average price that a security has traded for throughout the day based on volume and price. This is important as it gives traders insight into the trend and value of a security.
The Commodity Channel Index (CCI) indicator was created to identify bullish and bearish market cycles, as well as to define market turning points and the strongest and weakest market periods. CCI was developed for commodities and quickly found application in other markets, including forex.
Function
blackcat L2 VWAP CCI Trading System is an innovative indicator that combines vwap and cci indicator together. Not only long and short entries can be disclosed, but also the overbought and oversold zones are clearly observed.
Key Signal
cci ---> vwap cci indicator output
long --> long entry condition
short --> short entry condition
backtest --> indicator backtest scheme "NLX-L3 Backtest" required input source for strategy backtest
longentry --> visual long entry
shortentry --> visual short entry
Pros and Cons
Pros:
1. exact long and short entries are produced by overbought and oversold conditions
2. support "NLX-L3 Backtest" framework
Cons:
1. noise may be produced under extreme market condition
2. due to this is un-optimized version, time frame and trading pairs need to be selected
Remarks
Courtesy of @nilux "NLX-L3 Backtest" easy backtest framework for dummies.
Step by step backtest guide with "NLX-L3 Backtest" framework:
STEP1: Add this indicator into your chart
STEP2: Add "NLX-L3 Backtest" into your chart
STEP3: Click "Settings" gear icon of "NLX-L3 Backtest" to select "Select L2 Indicator" in the 1st line as "blackcat L2 VWAP CCI Trading System: backtest"
STEP4: Configure your backtest other settings under "NLX-L3 Backtest" framework
STEP5: Click "OK" and view the results in "Strategy Tester" tab
Readme
In real life, I am a prolific inventor. I have successfully applied for more than 60 international and regional patents in the past 12 years. But in the past two years or so, I have tried to transfer my creativity to the development of trading strategies. Tradingview is the ideal platform for me. I am selecting and contributing some of the hundreds of scripts to publish in Tradingview community. Welcome everyone to interact with me to discuss these interesting pine scripts.
The scripts posted are categorized into 5 levels according to my efforts or manhours put into these works.
Level 1 : interesting script snippets or distinctive improvement from classic indicators or strategy. Level 1 scripts can usually appear in more complex indicators as a function module or element.
Level 2 : composite indicator/strategy. By selecting or combining several independent or dependent functions or sub indicators in proper way, the composite script exhibits a resonance phenomenon which can filter out noise or fake trading signal to enhance trading confidence level.
Level 3 : comprehensive indicator/strategy. They are simple trading systems based on my strategies. They are commonly containing several or all of entry signal, close signal, stop loss, take profit, re-entry, risk management, and position sizing techniques. Even some interesting fundamental and mass psychological aspects are incorporated.
Level 4 : script snippets or functions that do not disclose source code. Interesting element that can reveal market laws and work as raw material for indicators and strategies. If you find Level 1~2 scripts are helpful, Level 4 is a private version that took me far more efforts to develop.
Level 5 : indicator/strategy that do not disclose source code. private version of Level 3 script with my accumulated script processing skills or a large number of custom functions. I had a private function library built in past two years. Level 5 scripts use many of them to achieve private trading strategy.