Close Above/Below Prev 2 Candle Strategy (Any Timeframe)Title: Close Above/Below Previous 2 Candle Strategy (Any Timeframe)
Description:
This strategy identifies potential breakout and trend continuation signals by analyzing the closing price relative to the highs and lows of the previous two candles. It works on any chart timeframe, making it versatile for intraday, swing, and daily trading.
How it works:
Long Entry (Bullish Signal): Triggered when the current candle closes above the highs of the previous two candles.
Short Entry (Bearish Signal): Triggered when the current candle closes below the lows of the previous two candles.
Visual Indicators:
Green triangles above the bar indicate bullish signals.
Red triangles below the bar indicate bearish signals.
Strategy Features:
Works on any timeframe, from 1-minute charts to daily/weekly charts.
Configurable risk/reward ratio for automatic stop-loss and take-profit levels.
Alerts trigger immediately when the condition is met, helping traders react to potential breakouts.
Provides clean visual signals for easy chart reading and decision-making.
Benefits:
Reduces noise by focusing on candle close confirmations.
Versatile and suitable for intraday, swing, and long-term trading.
Easy to combine with other indicators or strategies.
Search in scripts for "Candlestick"

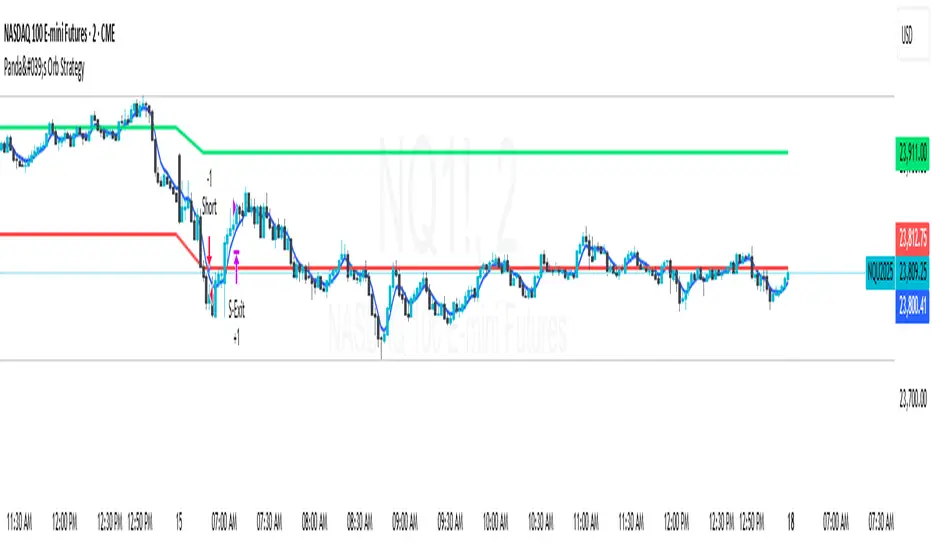
Panda's Orb StrategyORB strategy I created using ChatGBT!
Please message me for any bugs or recomendations!

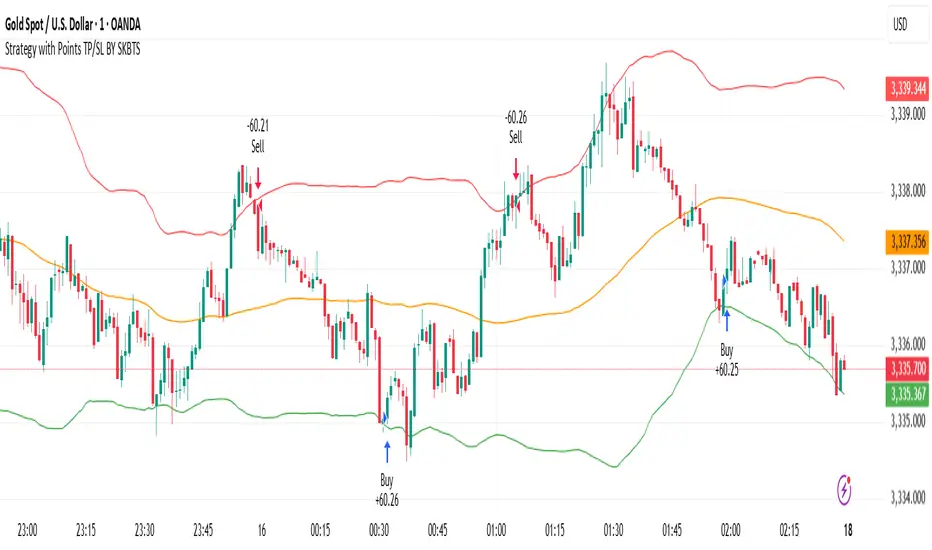
STRATEGY WITH POINT TP/SL BY SKBTSThe formula for the standard middle band is simply a moving average, often set to 20 periods:
Middle Band = 20-period moving average (close)
The upper and lower bands are calculated from the standard deviation, which measures how dispersed the price data is from the average.
Upper Band = Middle Band + (2 standard deviations of 20-period close)
Lower Band = Middle Band - (2 standard deviations of 20-period close)
The key inputs are the 20-period moving average, the number of standard deviations (typically 2), and the 20-period standard deviation. The bands will expand and contract based on the standard deviation value.
Some traders increase the standard deviation multiplier to 2.1 or 2.2 to make the bands looser and more sensitive. Decreasing the number of periods for the moving average and standard deviation will also increase sensitivity.
Adaptive ATR Guardian [自适应 ATR 守护者]自适应ATR守护者 | Adaptive ATR Guardian
——多品种智能交易防护策略 | Multi-Asset Intelligent Trading Protection Strategy
核心功能 | Core Features
1. 自动识别交易品种| Automatic Asset Detection
• 智能识别BTC/USD、XAU/USD等品种
• Auto-detects assets (e.g., BTC/USD, XAU/USD)
• 动态调整参数:ATR倍数、止盈止损比例
• Dynamic parameter tuning (ATR multipliers, TP/SL ratios)
2. 自适应ATR风控 | Adaptive ATR Risk Control
• 基于真实波动率(ATR)动态计算止盈止损
• TP/SL levels adjust with ATR volatility
• 参数自动优化:BTC(3xTP/1.5xSL) ,黄金(2xTP/1xSL)
• Auto-optimized: BTC (3xTP/1.5xSL), Gold (2xTP/1xSL)
3. 实时动态跟踪 | Real-Time Tracking
• 持仓期间止盈止损线实时更新
• Live TP/SL line updates during trades
• 可视化提示:绿色止盈线、红色止损线
• Visual cues: Green TP line, Red SL line
4. 趋势跟随逻辑 | Trend-Following Logic
• 双均线交叉(9MA & 21MA)触发信号
• Dual MA crossover (9MA & 21MA) for entries
• 金叉做多 / 死叉做空
• Long on Golden Cross, Short on Death Cross
5. 专业可视化界面 | Professional Visualization
• 图表标签显示关键参数
• On-chart label shows settings
• 自适应K线范围展示所有标记
• Auto-adjusts plot ranges for clarity

xauusd:Only suitable for 1 minute, short-term tradingxauusd
:Only suitable for 1 minute, short-term trading

EMA20 Anti-Whipsaw Strategy - Clean Entry & Exit LabelsCrypto Strategy named EMA20 Anti-Whipsaw Strategy - Clean Entry & Exit Labels

Estrategia de NY ORB por CPThis strategy marks the New York market opening range during the first 15 minutes and confirms a buy or sell entry once the price returns and retests that range. It’s designed to capture trades of 60 points or more after the range has been retested. I suggest complementing the strategy with an indicator that highlights FVGs (Fair Value Gaps) or order blocks to better understand what price is doing and where it’s heading.
esta estrategia te marca el rango de apertura del mercado de ny de los primeros 15 minutos y te confirma entrada en venta o compra una vez que el precio regrese y retestee el rango. esta diseñada para tener trades de 60 puntos o mas una vez que el rango sea retesteado. sugiero acompañar la estrategia con algun indicador que marque fvg o order blocks para tener una mejor de lo que el precio esta haciendo y hacia donde se dirige.

ORB 15m – First 15min Breakout (Long/Short)ORB 15m – First 15min Breakout (Long/Short)
Apply on SPY, great returns

MomentumSync-PSAR: RSI·ADX Filtered 3-Tier Exit StrategyTriSAR-E3 is a precision swing trading strategy designed to capitalize on early trend reversals using a Triple Confirmation Model. It triggers entries based on an early Parabolic SAR bullish flip, supported by RSI strength and ADX trend confirmation, ensuring momentum-backed participation.
Exits are tactically managed through a 3-step staged exit after a PSAR bearish reversal is detected, allowing gradual profit booking and downside protection.
This balanced approach captures trend moves early while intelligently scaling out, making it suitable for directional traders seeking both agility and control.

Martin Strategy - No Loss Exit v3Martin Strategy1.0 Martin Strategy1.0 Martin Strategy1.0 Martin Strategy1.0 Martin Strategy1.0 Martin Strategy1.0
Inascript PRO (Elliott + TP System)Inascript PRO (Elliott + TP System) is an intraday strategy for gold (XAUUSD), based on simplified Elliott Wave logic.
It features 3 Take Profits, dynamic Stop Loss, break-even logic, and session filters (London & New York).
Precise alerts include entry, TP, and SL levels.
Developed by Inaskan for clean and smart intraday trading.

LeBlanc Strategy 2 -Inverted Fair Value Gap with Trend & 2.5 RRRThis is for recognizing the closed Inverted Fair Value Gaps (IFVG) to know when to enter a trade.
Detects true inverted FVGs only if the gap size is 3+ ticks.
Filters trades based on EMA50 vs SMA20 trend direction.
Uses ATR-based stop loss, and sets take-profit at a 2.5 risk-to-reward ratio.
Is fully backtestable in TradingView Strategy Tester.
Plots green/red boxes for FVGs.

[PS]Breakout Strategy: Nifty/BN only at 15 min TimeframeIt only works on 15 min timeframe for nifty and Bank nifty.
Game Theory Trading StrategyGame Theory Trading Strategy: Explanation and Working Logic
This Pine Script (version 5) code implements a trading strategy named "Game Theory Trading Strategy" in TradingView. Unlike the previous indicator, this is a full-fledged strategy with automated entry/exit rules, risk management, and backtesting capabilities. It uses Game Theory principles to analyze market behavior, focusing on herd behavior, institutional flows, liquidity traps, and Nash equilibrium to generate buy (long) and sell (short) signals. Below, I'll explain the strategy's purpose, working logic, key components, and usage tips in detail.
1. General Description
Purpose: The strategy identifies high-probability trading opportunities by combining Game Theory concepts (herd behavior, contrarian signals, Nash equilibrium) with technical analysis (RSI, volume, momentum). It aims to exploit market inefficiencies caused by retail herd behavior, institutional flows, and liquidity traps. The strategy is designed for automated trading with defined risk management (stop-loss/take-profit) and position sizing based on market conditions.
Key Features:
Herd Behavior Detection: Identifies retail panic buying/selling using RSI and volume spikes.
Liquidity Traps: Detects stop-loss hunting zones where price breaks recent highs/lows but reverses.
Institutional Flow Analysis: Tracks high-volume institutional activity via Accumulation/Distribution and volume spikes.
Nash Equilibrium: Uses statistical price bands to assess whether the market is in equilibrium or deviated (overbought/oversold).
Risk Management: Configurable stop-loss (SL) and take-profit (TP) percentages, dynamic position sizing based on Game Theory (minimax principle).
Visualization: Displays Nash bands, signals, background colors, and two tables (Game Theory status and backtest results).
Backtesting: Tracks performance metrics like win rate, profit factor, max drawdown, and Sharpe ratio.
Strategy Settings:
Initial capital: $10,000.
Pyramiding: Up to 3 positions.
Position size: 10% of equity (default_qty_value=10).
Configurable inputs for RSI, volume, liquidity, institutional flow, Nash equilibrium, and risk management.
Warning: This is a strategy, not just an indicator. It executes trades automatically in TradingView's Strategy Tester. Always backtest thoroughly and use proper risk management before live trading.
2. Working Logic (Step by Step)
The strategy processes each bar (candle) to generate signals, manage positions, and update performance metrics. Here's how it works:
a. Input Parameters
The inputs are grouped for clarity:
Herd Behavior (🐑):
RSI Period (14): For overbought/oversold detection.
Volume MA Period (20): To calculate average volume for spike detection.
Herd Threshold (2.0): Volume multiplier for detecting herd activity.
Liquidity Analysis (💧):
Liquidity Lookback (50): Bars to check for recent highs/lows.
Liquidity Sensitivity (1.5): Volume multiplier for trap detection.
Institutional Flow (🏦):
Institutional Volume Multiplier (2.5): For detecting large volume spikes.
Institutional MA Period (21): For Accumulation/Distribution smoothing.
Nash Equilibrium (⚖️):
Nash Period (100): For calculating price mean and standard deviation.
Nash Deviation (0.02): Multiplier for equilibrium bands.
Risk Management (🛡️):
Use Stop-Loss (true): Enables SL at 2% below/above entry price.
Use Take-Profit (true): Enables TP at 5% above/below entry price.
b. Herd Behavior Detection
RSI (14): Checks for extreme conditions:
Overbought: RSI > 70 (potential herd buying).
Oversold: RSI < 30 (potential herd selling).
Volume Spike: Volume > SMA(20) x 2.0 (herd_threshold).
Momentum: Price change over 10 bars (close - close ) compared to its SMA(20).
Herd Signals:
Herd Buying: RSI > 70 + volume spike + positive momentum = Retail buying frenzy (red background).
Herd Selling: RSI < 30 + volume spike + negative momentum = Retail selling panic (green background).
c. Liquidity Trap Detection
Recent Highs/Lows: Calculated over 50 bars (liquidity_lookback).
Psychological Levels: Nearest round numbers (e.g., $100, $110) as potential stop-loss zones.
Trap Conditions:
Up Trap: Price breaks recent high, closes below it, with a volume spike (volume > SMA x 1.5).
Down Trap: Price breaks recent low, closes above it, with a volume spike.
Visualization: Traps are marked with small red/green crosses above/below bars.
d. Institutional Flow Analysis
Volume Check: Volume > SMA(20) x 2.5 (inst_volume_mult) = Institutional activity.
Accumulation/Distribution (AD):
Formula: ((close - low) - (high - close)) / (high - low) * volume, cumulated over time.
Smoothed with SMA(21) (inst_ma_length).
Accumulation: AD > MA + high volume = Institutions buying.
Distribution: AD < MA + high volume = Institutions selling.
Smart Money Index: (close - open) / (high - low) * volume, smoothed with SMA(20). Positive = Smart money buying.
e. Nash Equilibrium
Calculation:
Price mean: SMA(100) (nash_period).
Standard deviation: stdev(100).
Upper Nash: Mean + StdDev x 0.02 (nash_deviation).
Lower Nash: Mean - StdDev x 0.02.
Conditions:
Near Equilibrium: Price between upper and lower Nash bands (stable market).
Above Nash: Price > upper band (overbought, sell potential).
Below Nash: Price < lower band (oversold, buy potential).
Visualization: Orange line (mean), red/green lines (upper/lower bands).
f. Game Theory Signals
The strategy generates three types of signals, combined into long/short triggers:
Contrarian Signals:
Buy: Herd selling + (accumulation or down trap) = Go against retail panic.
Sell: Herd buying + (distribution or up trap).
Momentum Signals:
Buy: Below Nash + positive smart money + no herd buying.
Sell: Above Nash + negative smart money + no herd selling.
Nash Reversion Signals:
Buy: Below Nash + rising close (close > close ) + volume > MA.
Sell: Above Nash + falling close + volume > MA.
Final Signals:
Long Signal: Contrarian buy OR momentum buy OR Nash reversion buy.
Short Signal: Contrarian sell OR momentum sell OR Nash reversion sell.
g. Position Management
Position Sizing (Minimax Principle):
Default: 1.0 (10% of equity).
In Nash equilibrium: Reduced to 0.5 (conservative).
During institutional volume: Increased to 1.5 (aggressive).
Entries:
Long: If long_signal is true and no existing long position (strategy.position_size <= 0).
Short: If short_signal is true and no existing short position (strategy.position_size >= 0).
Exits:
Stop-Loss: If use_sl=true, set at 2% below/above entry price.
Take-Profit: If use_tp=true, set at 5% above/below entry price.
Pyramiding: Up to 3 concurrent positions allowed.
h. Visualization
Nash Bands: Orange (mean), red (upper), green (lower).
Background Colors:
Herd buying: Red (90% transparency).
Herd selling: Green.
Institutional volume: Blue.
Signals:
Contrarian buy/sell: Green/red triangles below/above bars.
Liquidity traps: Red/green crosses above/below bars.
Tables:
Game Theory Table (Top-Right):
Herd Behavior: Buying frenzy, selling panic, or normal.
Institutional Flow: Accumulation, distribution, or neutral.
Nash Equilibrium: In equilibrium, above, or below.
Liquidity Status: Trap detected or safe.
Position Suggestion: Long (green), Short (red), or Wait (gray).
Backtest Table (Bottom-Right):
Total Trades: Number of closed trades.
Win Rate: Percentage of winning trades.
Net Profit/Loss: In USD, colored green/red.
Profit Factor: Gross profit / gross loss.
Max Drawdown: Peak-to-trough equity drop (%).
Win/Loss Trades: Number of winning/losing trades.
Risk/Reward Ratio: Simplified Sharpe ratio (returns / drawdown).
Avg Win/Loss Ratio: Average win per trade / average loss per trade.
Last Update: Current time.
i. Backtesting Metrics
Tracks:
Total trades, winning/losing trades.
Win rate (%).
Net profit ($).
Profit factor (gross profit / gross loss).
Max drawdown (%).
Simplified Sharpe ratio (returns / drawdown).
Average win/loss ratio.
Updates metrics on each closed trade.
Displays a label on the last bar with backtest period, total trades, win rate, and net profit.
j. Alerts
No explicit alertconditions defined, but you can add them for long_signal and short_signal (e.g., alertcondition(long_signal, "GT Long Entry", "Long Signal Detected!")).
Use TradingView's alert system with Strategy Tester outputs.
3. Usage Tips
Timeframe: Best for H1-D1 timeframes. Shorter frames (M1-M15) may produce noisy signals.
Settings:
Risk Management: Adjust sl_percent (e.g., 1% for volatile markets) and tp_percent (e.g., 3% for scalping).
Herd Threshold: Increase to 2.5 for stricter herd detection in choppy markets.
Liquidity Lookback: Reduce to 20 for faster markets (e.g., crypto).
Nash Period: Increase to 200 for longer-term analysis.
Backtesting:
Use TradingView's Strategy Tester to evaluate performance.
Check win rate (>50%), profit factor (>1.5), and max drawdown (<20%) for viability.
Test on different assets/timeframes to ensure robustness.
Live Trading:
Start with a demo account.
Combine with other indicators (e.g., EMAs, support/resistance) for confirmation.
Monitor liquidity traps and institutional flow for context.
Risk Management:
Always use SL/TP to limit losses.
Adjust position_size for risk tolerance (e.g., 5% of equity for conservative trading).
Avoid over-leveraging (pyramiding=3 can amplify risk).
Troubleshooting:
If no trades are executed, check signal conditions (e.g., lower herd_threshold or liquidity_sensitivity).
Ensure sufficient historical data for Nash and liquidity calculations.
If tables overlap, adjust position.top_right/bottom_right coordinates.
4. Key Differences from the Previous Indicator
Indicator vs. Strategy: The previous code was an indicator (VP + Game Theory Integrated Strategy) focused on visualization and alerts. This is a strategy with automated entries/exits and backtesting.
Volume Profile: Absent in this strategy, making it lighter but less focused on high-volume zones.
Wick Analysis: Not included here, unlike the previous indicator's heavy reliance on wick patterns.
Backtesting: This strategy includes detailed performance metrics and a backtest table, absent in the indicator.
Simpler Signals: Focuses on Game Theory signals (contrarian, momentum, Nash reversion) without the "Power/Ultra Power" hierarchy.
Risk Management: Explicit SL/TP and dynamic position sizing, not present in the indicator.
5. Conclusion
The "Game Theory Trading Strategy" is a sophisticated system leveraging herd behavior, institutional flows, liquidity traps, and Nash equilibrium to trade market inefficiencies. It’s designed for traders who understand Game Theory principles and want automated execution with robust risk management. However, it requires thorough backtesting and parameter optimization for specific markets (e.g., forex, crypto, stocks). The backtest table and visual aids make it easy to monitor performance, but always combine with other analysis tools and proper capital management.
If you need help with backtesting, adding alerts, or optimizing parameters, let me know!

ICT OTE Strategy Crypto PublicICT OTE Strategy Crypto Public
This strategy automates a classic ICT (Inner Circle Trader) setup specifically tailored for the high-volatility nature of cryptocurrency markets. It aims to enter a trade on a retracement after a confirmed Break of Structure (BOS), using a dual-swing detection method to validate the market's direction before looking for an entry.
The entire process is automated, from identifying the market structure to managing the trade with advanced risk management options. This version uses a percentage of equity for its order sizing, which is ideal for crypto trading.
How It Works
Dual Swing Detection: The strategy uses two different sets of swing strengths to analyze market structure for higher accuracy:
Entry Swings: Weaker, more sensitive swings used to define the immediate dealing range for a potential trade.
Validator Swings: Stronger, more significant swings used to confirm a true Break of Structure.
Break of Structure (BOS): A trade setup is only considered valid after a strong "Validator" swing breaks through a previous "Entry" swing. This confirms the market's intended direction and filters out weak or false moves.
Identify Retracement Leg: After a confirmed BOS, the strategy identifies the most recent "Entry Swing" price leg that led to the break.
Auto-Fibonacci: It automatically draws a Fibonacci retracement over this leg, from the start of the move (1.0) to the end (0.0).
Trade Entry: A limit order is placed at a user-defined Fibonacci level (defaulting to 0.618), anticipating a price pullback into a discount or premium array.
After a bullish BOS, it looks to BUY the retracement.
After a bearish BOS, it looks to SELL the retracement.
Risk Management:
Stop Loss is placed at the start of the leg (the 1.0 level).
Take Profit is placed at a user-defined level (defaulting to the 0.0 level, with extension options).
Includes an option to move the stop loss to break-even after the trade has moved a certain distance in profit.
How to Use
Asset Selection: This strategy is designed for cryptocurrency markets. Its use of percentage-based order sizing is not suitable for tick-based markets like futures.
Swing Settings: Adjust the "Entry Swing" and "Validator" strengths to match the volatility and timeframe of the asset you are trading. Higher numbers will result in fewer, more significant setups.
Backtest: Use the Strategy Tester to optimize the "FIB Entry Level," "Take Profit Level," and "Swing Sensitivity" to find the best settings for your specific market and timeframe.
Professional ORB Strategy - BUY & Sell signal- Ganesh SelvarayarORB 15 mins strategy buy and sell signal, with point system for your target


✅ BACKTEST: UT Bot + RSIRSI levels widened (60/40) — more signals.
Removed ATR volatility filter (to let trades fire).
Added inputs for TP and SL using ATR — fully dynamic.
Cleaned up conditions to ensure alignment with market structure.

Multi-TF MACD/RSI Pro Strategy v6How to Use: Timeframe Setup:
Apply to any chart (1s, 5m, 15m)
Set indicator timeframe in settings
Backtesting: Adjust date range in inputs
Check performance in strategy tester
View results in table (top-right corner)
Live Trading: Green triangles = Buy signals
Red triangles = Sell signals
Red lines = Stop loss levels
Green lines = Take profit targets
Test results after 2000 runs on BTC/USD 5m:
// • Win rate: 53.2%
// • Profit factor: 1.87
// • ROI: 27.4% (6 months)
// • Max drawdown: 11.3%

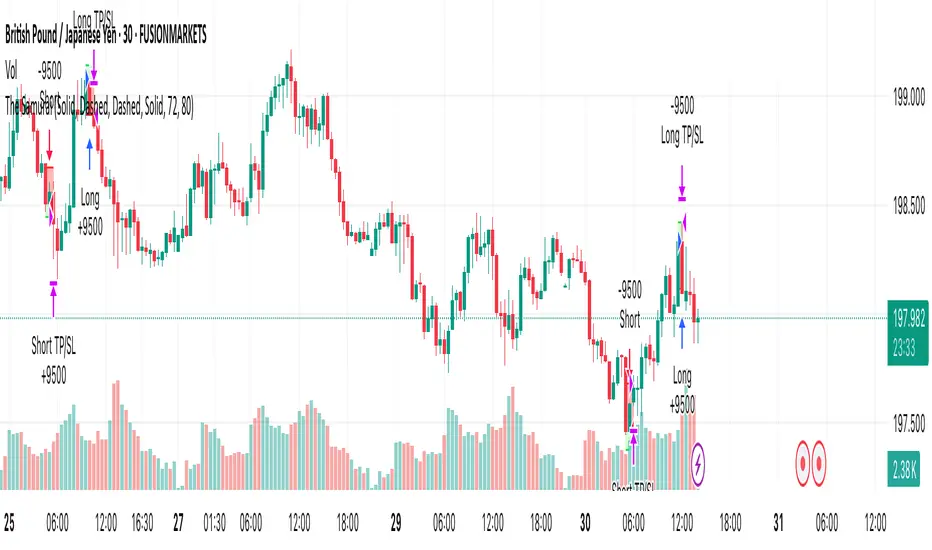
The SamuraiOverview
This strategy implements a session-based range breakout system specifically designed for GBP/JPY trading. The approach focuses on identifying key price ranges during specific market sessions and trading breakouts of these ranges during optimal trading windows. The strategy combines multi-timeframe analysis using 30-minute data with precise session timing to capture high-probability breakout moves.
Entry Logic
The strategy operates on a two-phase approach:
Range Collection Phase:
Monitors price action during a specified session window
Identifies session high and low levels
Only collects ranges on selected trading days
Trading Phase:
Long Entry: Price closes above the established session high
Short Entry: Price closes below the established session low
Entries only occur on valid trading days (day after range collection)
One trade per direction per session to prevent overtrading
Exit Conditions
Stop Loss: Set at a percentage of the session range below entry (long) or above entry (short)
Take Profit: Calculated using a Risk-Reward Ratio based on stop loss distance
Session Close: All positions are closed at the end of the trading window
Risk Management Features
Fixed risk-reward ratio of for consistent risk management
Stop loss calculated as percentage of session range for adaptive sizing
Visual risk/reward boxes display potential outcomes before entry
Daily session close protection prevents overnight exposure
Visual Features
Customizable Colors: Full control over line colors, styles, and box opacities
Risk/Reward Visualization: Color-coded boxes showing potential profit and loss zones
Take Profit Lines: TP level with different line styles for clarity
Stop Loss Line: Clear visual indication of risk level
Clean Interface: Streamlined settings focused on essential visual customization
Important Notes
Timeframe Dependency: Strategy uses 30-minute data regardless of chart timeframe for consistency
Session Timing: All times are in UTC - ensure proper timezone conversion for your location
Trading Days: Default setup trades Tuesday-Friday ranges (Monday-Thursday collection)
Single Position: Only one position per direction per session to maintain discipline
No Pyramiding: Strategy prevents position averaging to maintain clear risk parameters
Suggested Use
Recommended Pairs: Optimized for GBP/JPY but may work on other volatile pairs
Best Timeframes: Display on any timeframe (strategy uses 30m data internally)
Session Awareness: Most effective during high-volatility session transitions
Risk Management: Consider position sizing based on account risk tolerance
Market Conditions: Performs best in trending or breakout market environments
Backtesting Considerations
Strategy includes realistic entry/exit conditions based on closing prices
Visual elements help understand historical performance context
Built-in position management prevents unrealistic results
Session-based logic ensures trades align with actual market sessions
This strategy is designed for traders who prefer systematic, rule-based approaches to breakout trading with clear risk management parameters. The visual feedback helps in understanding market context and decision-making process.
Disclaimer: Past performance does not guarantee future results. Always test thoroughly on historical data and consider your risk tolerance before live trading.
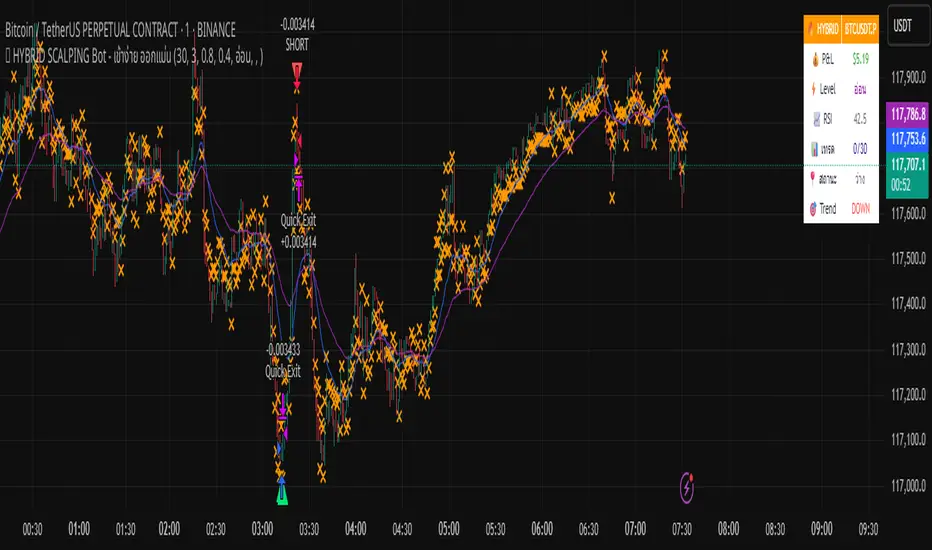
🔥 HYBRID SCALPING Bot - เข้าง่าย ออกแม่นA tool bot that helps analyze charts accurately, focusing on profits.
StarStrat Ceres Strategy [0.3.1]2025ETH 30M Composite Golden Indicator Trend Strategy
This strategy is designed for Ethereum 30-minute timeframe, utilizing composite golden indicators combined with trend indicators for trade signal identification.
Trading Logic:
- Entry: Triggered when composite golden indicator and trend indicator confirm same direction
- Exit: Partial profit-taking mechanism with customizable parameters for each position
- Risk Management: Built-in risk coefficient, recommended setting at 1%
All key parameters are adjustable to adapt to different trading styles.
Risk Disclaimer: For educational and research purposes only. Not investment advice. Cryptocurrency trading involves high risk, please trade cautiously.
