Wick Detection (1 and 0) - AYNETDetailed Scientific Explanation
1. Wick Detection Logic
Definition of a Wick:
A wick, also known as a shadow, represents the price action outside the range of a candlestick's body (the region between open and close).
Upper Wick: Occurs when the high value exceeds the greater of open and close.
Lower Wick: Occurs when the low value is lower than the smaller of open and close.
Upper Wick Detection:
pinescript
Kodu kopyala
bool has_upper_wick = high > math.max(open, close)
This checks if the high price of the candle is greater than the maximum of the open and close prices. If true, an upper wick exists.
Lower Wick Detection:
pinescript
Kodu kopyala
bool has_lower_wick = low < math.min(open, close)
This checks if the low price of the candle is less than the minimum of the open and close prices. If true, a lower wick exists.
2. Binary Representation
The presence of a wick is encoded as a binary value for simplicity and computational analysis:
Upper Wick: Represented as 1 if present, otherwise 0.
pinescript
Kodu kopyala
float upper_wick_binary = has_upper_wick ? 1 : 0
Lower Wick: Represented as 1 if present, otherwise 0. This value is inverted (-1) for visualization purposes.
pinescript
Kodu kopyala
float lower_wick_binary = has_lower_wick ? 1 : 0
3. Visualization with Histograms
The plot function is used to create histograms for visualizing the binary wick data:
Upper Wicks: Plotted as positive values with green columns:
pinescript
Kodu kopyala
plot(upper_wick_binary, title="Upper Wick", color=color.new(color.green, 0), style=plot.style_columns, linewidth=2)
Lower Wicks: Plotted as negative values with red columns:
pinescript
Kodu kopyala
plot(lower_wick_binary * -1, title="Lower Wick", color=color.new(color.red, 0), style=plot.style_columns, linewidth=2)
Features and Applications
1. Wick Visualization:
Upper wicks are displayed as positive green columns.
Lower wicks are displayed as negative red columns.
This provides a clear visual representation of wick presence in historical data.
2. Technical Analysis:
Wick formations often indicate market sentiment:
Upper Wicks: Sellers pushed the price lower after buyers drove it higher, signaling rejection at the top.
Lower Wicks: Buyers pushed the price higher after sellers drove it lower, signaling rejection at the bottom.
3. Signal Generation:
Traders can use wick detection to build strategies, such as identifying key price levels or market reversals.
Enhancements and Future Improvements
1. Wick Length Measurement
Instead of binary detection, measure the actual length of the wick:
pinescript
Kodu kopyala
float upper_wick_length = high - math.max(open, close)
float lower_wick_length = math.min(open, close) - low
This approach allows for thresholds to identify significant wicks:
pinescript
Kodu kopyala
bool significant_upper_wick = upper_wick_length > 10 // For wicks longer than 10 units.
bool significant_lower_wick = lower_wick_length > 10
2. Alerts for Long Wicks
Trigger alerts when significant wicks are detected:
pinescript
Kodu kopyala
alertcondition(significant_upper_wick, title="Long Upper Wick", message="A significant upper wick has been detected.")
alertcondition(significant_lower_wick, title="Long Lower Wick", message="A significant lower wick has been detected.")
3. Combined Wick Analysis
Analyze both upper and lower wicks to assess volatility:
pinescript
Kodu kopyala
float total_wick_length = upper_wick_length + lower_wick_length
bool high_volatility = total_wick_length > 20 // Combined wick length exceeds 20 units.
Conclusion
This script provides a compact and computationally efficient way to detect candlestick wicks and represent them as binary data. By visualizing the data with histograms, traders can easily identify wick formations and use them for technical analysis, signal generation, and volatility assessment. The approach can be extended further to measure wick length, detect significant wicks, and integrate these insights into automated trading systems.
Search in scripts for "Candlestick"

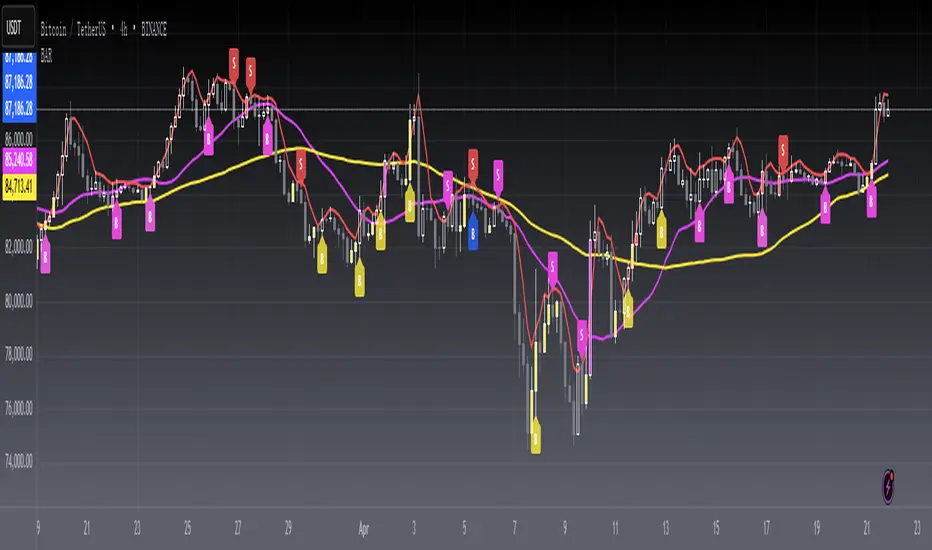
Bullish/Bearish Reversal Bars Indicator [Skyrexio]Introduction
Bullish/Bearish Reversal Bars Indicator leverages the combination of candlestick reversal bar pattern and the Williams Alligator indicator to help traders in understanding where there is a high probability of market reversal or correction. Indicator works for both bearish and bullish cases. It visualizes the bearish and bullish reversal bars with red and green dots and also plots the Alligator's lips to make it more convenient for traders to understand if price is above or below lips line (more information in "Methodology and it's justification" paragraph).
Features
Market Facilitation Index(MFI) filter: with the specified parameter in settings user can choose to filter bullish and bearish reversal bars which passed the MFI condition.
Awesome Oscillator(AO) filter: with the specified parameter in settings user can choose to filter bullish and bearish reversal bars which passed the AO condition.
Alerts: user can set up the alert and have notifications when bullish/bearish reversal bar has been printed.
Methodology and it's justification
In the script’s methodology, we apply the concepts of bullish and bearish reversal bars introduced by Bill Williams in his book Trading Chaos. So, what exactly is a bullish or bearish reversal bar? At its core, it’s a candlestick pattern. A bullish reversal bar is a bar that closes in its upper half, while a bearish reversal bar closes in its lower half.
Why is this type of bar significant? Let’s look at the bullish reversal bar as an example. When the price is trending upward, forming higher highs with each candle, and we suddenly see a bullish bar that makes a new high but ultimately closes in its lower half, it signals a shift in control. Bears have taken control toward the end of that candle's period, pushing the price back down. This can be interpreted as a sign of trend weakness and a potential reversal (or at least a correction).
An additional key point is that a reversal bar often indicates a possible end to the trend. Therefore, for a reversal bar to be valid, several preceding candles should show lower highs (for bullish bars) or higher lows (for bearish bars), reinforcing the likelihood of a trend change.
The second step on methodology is the location of the bar related to Williams Alligator. The Williams Alligator Indicator, developed by Bill Williams, is a technical analysis tool that helps traders identify trends and potential turning points in the market. It consists of three lines, often called the jaw, teeth, and lips of the alligator, each representing different moving averages:
Jaw (Blue Line): A slower moving average, typically a 13-period smoothed moving average shifted 8 bars into the future.
Teeth (Red Line): A medium moving average, typically an 8-period smoothed moving average shifted 5 bars into the future.
Lips (Green Line): A faster moving average, usually a 5-period smoothed moving average shifted 3 bars into the future.
When the three lines are spread out and moving in the same direction, it suggests a strong trend (the "alligator" is "awake and feeding"). When they intertwine, the indicator suggests that the market is moving sideways, or in a range, signaling a lack of clear trend (the "alligator" is "sleeping"). Traders use the Alligator Indicator to enter trades in trending markets and avoid trades in choppy, non-trending markets.
If bullish reversal bar's high is not below and bearish reversal bar's low is not above all three Alligator's lines (jaw, lips, teeth) they cannot be interpreted as these types of bars. It can be explained as following: if we are waiting for the bullish reversal bar it shall be reversal from downtrend. If price is not below all three lines it can't be interpret as the downtrend according to this method. The opposite is true for the bearish reversal bar.
All described above are obligatory conditions for reversal bar, now let's discuss two not obligatory conditions. The first one is Market Facilitation Index (MFI) restriction. Let's briefly look what is MFI. The Market Facilitation Index (MFI) is a technical indicator that measures the price movement per unit of volume, helping traders gauge the efficiency of price movement in relation to trading volume. Here's how you can calculate it:
MFI = (High−Low)/Volume
MFI can be used in combination with volume, so we can divide 4 states. Bill Williams introduced these to help traders interpret the interaction between volume and price movement. Here’s a quick summary:
Green Window (Increased MFI & Increased Volume): Indicates strong momentum with both price and volume increasing. Often a sign of trend continuation, as both buying and selling interest are rising.
Fake Window (Increased MFI & Decreased Volume): Shows that price is moving but with lower volume, suggesting weak support for the trend. This can signal a potential end of the current trend.
Squat Window (Decreased MFI & Increased Volume): Shows high volume but little price movement, indicating a tug-of-war between buyers and sellers. This often precedes a breakout as the pressure builds.
Fade Window (Decreased MFI & Decreased Volume): Indicates a lack of interest from both buyers and sellers, leading to lower momentum. This typically happens in range-bound markets and may signal consolidation before a new move.
For our purposes we are interested in squat bars. This is the sign that volume cannot move the price easily. This type of bar increases the probability of trend reversal. In this indicator we added to enable the MFI filter of reversal bars. If potential reversal bar or two preceding bars have squat state this bar can be interpret as a reversal one.
The second additional filter is Awesome Oscillator. The Awesome Oscillator (AO), developed by Bill Williams, is a momentum indicator that measures market momentum by comparing recent price action to a longer historical context. It helps traders identify potential trend reversals and the strength of trends. Formula:
AO = SMA5(Median Price) − SMA34(Median Price)
where:
Median Price = (High + Low) / 2
SMA5 = 5-period Simple Moving Average of the Median Price
SMA 34 = 34-period Simple Moving Average of the Median Price
If AO is decreasing momentum is bearish, if increasing - bullish. According to Bill Williams approach reversal bars are the potential trades against the trend. As a result we added second filter for bullish reversal bars AO shall be decreasing, for bearish increasing.
How to use indicator
Apply it to desired chart and time frame. It works on every time frame.
Setup the filters with the "Enable MFI" and "Enable AO" checkboxes in the settings. By default they are turned on.
Analyze the price action. Indicator plotted the white line, this is the lips of an Alligator. It will help you to understand how price is moving in comparison to lips line. Indicator will print the green dot and text "BULL" below it current bar is bullish reversal. It will print the red dot and text "BEAR" above it if current bar is interpreted by algorithm as a bearish reversal.
Set up the alerts if it's needed. Indicator has two custom alerts called "Bullish reversal bar has been printed" and "Bearish reversal bar has been printed"
Disclaimer:
Educational and informational tool reflecting Skyrex commitment to informed trading. Past performance does not guarantee future results. Test indicators before live implementation.

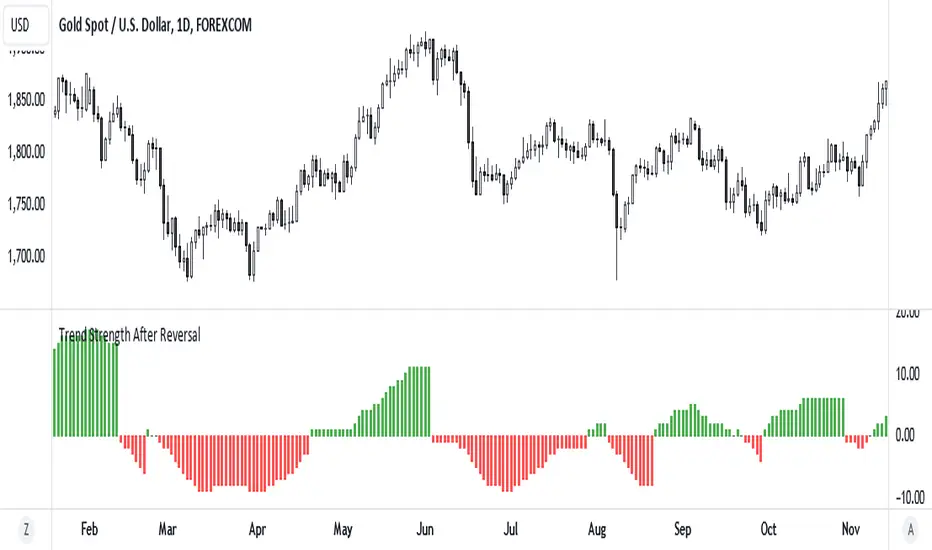
Trend Strength After Reversal
This indicator measures trend strength after the reversal.
It can catch early reversal based on engulfing candlestick pattern or just the regular reversal.
Every reversal have to be confirmed by a close above reversal pattern.
Trend strength is measured by counting subsequent closing confirming the reversal
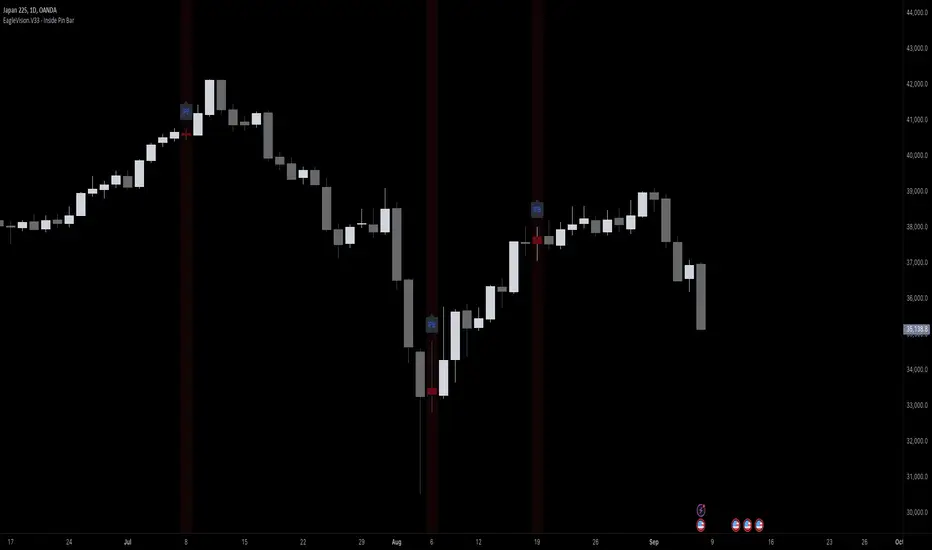
EagleVision.V33 - Inside Pin Bar EagleVision.V33 is a specialized indicator designed for traders who focus on price action. It detects and highlights the Inside Pin Bar candle pattern, a key signal that can indicate potential market reversals or trend continuations. This tool is invaluable for traders who rely on precise candlestick patterns to make data-driven decisions.
Features:
• Customizable Pattern Highlighting: EagleVision.V33 allows traders to choose custom colors to highlight Inside Pin Bar patterns directly on the chart. This makes identifying critical trading signals straightforward, even in busy market conditions.
• Pin Bar Candle Customization: Beyond just highlighting, the indicator enables users to change the color of the detected pin bar itself, ensuring that crucial patterns are immediately visible and easy to track.
• Versatile Timeframe Application: The indicator can be applied across various timeframes, from intraday (1 minute, 5 minutes) to longer-term charts (daily, weekly). Users can easily switch between timeframes within the settings, making it adaptable to different trading strategies.
• Enhanced Visual Clarity with Background Highlighting: For traders who prefer additional emphasis, EagleVision.V33 offers an option to apply a background color that highlights the entire region where the Inside Pin Bar pattern is detected.
How It Works:
• Inside Bar Identification: The indicator first identifies an Inside Bar, where a candle’s high and low fall within the range of the preceding candle (the mother bar). This is a foundational pattern in price action trading.
• Pin Bar Detection: It then checks if the candle is a Pin Bar, characterized by a small body and a prominent wick (either upper or lower), which typically signals potential market turning points.
• Pattern Highlighting & Visualization: Upon detecting both conditions (Inside Bar and Pin Bar), EagleVision.V33 highlights the pattern using customizable shapes and colors, and optionally applies a background shade to further enhance visibility.
Use Cases:
• Reversals at Key Levels: The Inside Pin Bar pattern often appears at significant support or resistance levels, signaling potential reversals. EagleVision.V33 helps traders spot these opportunities early.
• Trend Continuations: In trending markets, this pattern can confirm the continuation of a trend, providing traders with the confidence to hold positions or enter new ones.
Customization Options:
• Pattern Highlight Color: Choose a distinct color for the label or shape that marks the Inside Pin Bar pattern, making it stand out against other chart elements.
• Pin Bar Candle Color: Customize the color of the Pin Bar itself, ensuring that it is immediately recognizable on the chart.
• Background Highlighting: Optionally apply a background color to the chart area where the pattern is detected, further enhancing visual clarity and making it easier to spot potential trading opportunities.
Why EagleVision.V33 Stands Out:
EagleVision.V33 is not just another pattern detection tool; it’s engineered for precision and clarity, with highly customizable features that cater to the unique needs of price action traders. By combining both Inside Bar and Pin Bar detection, it offers a powerful edge, providing traders with actionable insights directly on their charts.
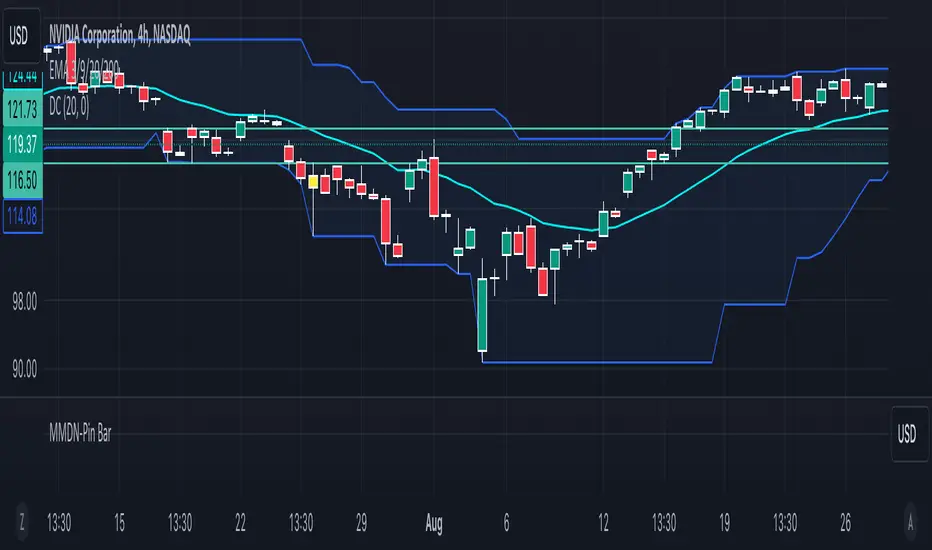
MMDN-Pin BarThis Pine Script code is designed to highlight Pin Bars on a TradingView chart by changing their color to yellow. A Pin Bar is a type of candlestick pattern that typically indicates a potential reversal in the market. The script uses specific conditions to identify bullish and bearish Pin Bars based on the size of the candlestick body and the length of the shadows (wicks).
1. Calculate Body and Shadows:
body: The absolute difference between the close and open prices.
upshadow: The upper shadow, calculated differently depending on whether the close is higher or lower than the open.
downshadow: The lower shadow, calculated similarly.
2. Define Pin Bar Conditions:
pinbar_h: Identifies a bullish Pin Bar if the previous candle's close is greater than its open, the previous candle's body is larger than the current candle's body, the upper shadow is more than half the size of the body, and the upper shadow is more than twice the size of the body.
pinbar_l: Identifies a bearish Pin Bar with similar conditions but for the lower shadow.
Set Pin Bar Color:
barcolor: Changes the color of the identified Pin Bars to yellow.
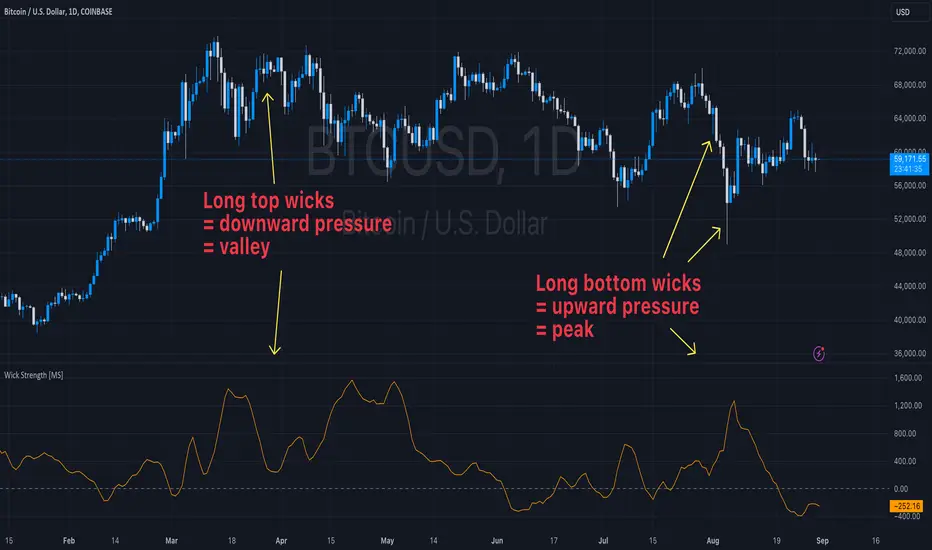
Wick Strength [MS]Overview
The Wick Strength indicator is a unique script designed to measure and visualize the relative strength of candlestick wicks over time. By analyzing the relationship between upper and lower wicks, this indicator provides insights into potential market dynamics and price action patterns.
How It Works
The Wick Strength indicator calculates the "strength" of candlestick wicks by comparing the upward and downward movements within each candle's range. This calculation results in a dynamic line plot that represents the evolving wick strength across your chosen timeframe.
Strength is not range-bound, allowing the score to reach extremes and be compared relatively across time.
Interpretation
Positive values indicate stronger upper wicks (potential bearish pressure)
Negative values suggest stronger lower wicks (potential bullish pressure)
Extreme readings might signal overextended moves or potential reversals
Key Features
Measures relative wick strength candle by candle
Smooths the values by summation based on user preference
Adaptable to all timeframes and markets
Potential Applications
While extensive backtesting has not been performed, the Wick Strength indicator may offer valuable insights for:
Identifying potential divergences between price action and wick strength
Spotting changes in market sentiment or volatility
Complementing other technical analysis tools for a more comprehensive trading approach
Developing unique trading strategies based on wick behavior
Artaking 2Components of the Indicator:
Moving Averages:
Short-Term Moving Average (MA): This is a 50-period Simple Moving Average (SMA) applied to the closing price. It is used to track the short-term trend of the market.
Long-Term Moving Average (MA): This is a 200-period SMA used to track the long-term trend.
Day Trading Moving Average: A 20-period SMA is used specifically for day trading signals, focusing on shorter-term price movements.
Purpose:
The crossing of these moving averages (short-term crossing above or below long-term) provides basic buy and sell signals, indicative of potential trend reversals or continuations.
ADX (Average Directional Index) for Trend Strength:
ADX Calculation: The ADX is calculated using a 14-period length with 14-period smoothing. The ADX value indicates the strength of a trend, regardless of direction.
Strong Trend Condition: The indicator considers a trend to be strong if the ADX value is above 25. This threshold helps filter out trades during weak or sideways markets.
Purpose:
To ensure that the strategy only generates signals when there is a strong trend, thus avoiding whipsaws in low volatility or range-bound conditions.
Support Levels:
Support Level Calculation: The indicator calculates the lowest close over the last 100 periods. This level is used to identify significant support zones where the price might find a floor.
Purpose:
Support levels are critical in identifying potential areas where the price might bounce, making them ideal for setting stop losses or identifying buy opportunities.
Volatility Spike (Proxy for News Trading):
ATR (Average True Range) Calculation: The indicator uses a 14-period ATR to measure market volatility. A volatility spike is identified when the ATR is greater than 1.5 times the 14-period SMA of the ATR.
Purpose:
This serves as a proxy for news events or other sudden market movements that could make the market unpredictable. The indicator avoids generating signals during these periods to reduce the risk of being caught in a volatile, potentially news-driven move.
Fibonacci Retracement Levels:
61.8% Fibonacci Level: Calculated from the highest high and lowest low over the long MA period, this retracement level is widely regarded as a significant support or resistance level.
Purpose:
Position traders often use Fibonacci levels to identify potential reversal points. The indicator incorporates the 61.8% level to fine-tune entries and exits.
Candlestick Patterns for Price Action Trading:
Bullish Engulfing Pattern: A bullish reversal pattern where a green candle fully engulfs the previous red candle.
Bearish Engulfing Pattern: A bearish reversal pattern where a red candle fully engulfs the previous green candle.
Purpose:
These patterns are classic signals used in price action trading to identify potential reversals at key levels, especially when they align with other conditions like support/resistance or Fibonacci levels.
Signal Generation:
The indicator generates buy and sell signals by combining the above elements:
Buy Signal:
A buy signal is triggered when:
The short-term MA crosses above the long-term MA (indicating a potential uptrend).
The trend is strong (ADX > 25).
The current price is near or below the 61.8% Fibonacci retracement level, suggesting a potential reversal.
No significant volatility spike is detected, ensuring the market isn’t reacting unpredictably to news.
Sell Signal:
A sell signal is triggered when:
The short-term MA crosses below the long-term MA (indicating a potential downtrend).
The trend is strong (ADX > 25).
The current price is near or above the 61.8% Fibonacci retracement level, suggesting potential resistance.
No significant volatility spike is detected.
Day Trading Signals:
Independent of the main trend signals, the indicator also generates intraday buy and sell signals when the price crosses above or below the 20-period day trading MA.
Price Action Signals:
The indicator can trigger buy or sell signals based purely on price action, such as the occurrence of bullish or bearish engulfing patterns. This is optional and can be enabled or disabled.
Alerts:
The indicator includes built-in alert conditions that notify the trader when a buy or sell signal is generated. This allows traders to act immediately without having to constantly monitor the charts.
Practical Application:
This indicator is versatile and can be used across various trading styles:
Position Trading: The long-term MA, Fibonacci retracement, and ADX provide a solid foundation for identifying long-term trends and potential entry/exit points.
Day Trading: The short-term MA and day trading MA offer quick signals for intraday trading.
Price Action: Candlestick pattern recognition allows for precise entry points based on market sentiment and behavior.
News Trading: The volatility spike filter helps avoid trading during periods of market instability, often driven by news events.
Conclusion:
The Comprehensive Trading Strategy Indicator is a robust tool designed to help traders navigate various market conditions by integrating multiple strategies into a single, coherent framework. It provides clear, actionable signals while filtering out potentially dangerous trades during volatile or weak market conditions. Whether you're a long-term trader, a day trader, or someone who relies on price action, this indicator can be a valuable addition to your trading toolkit.

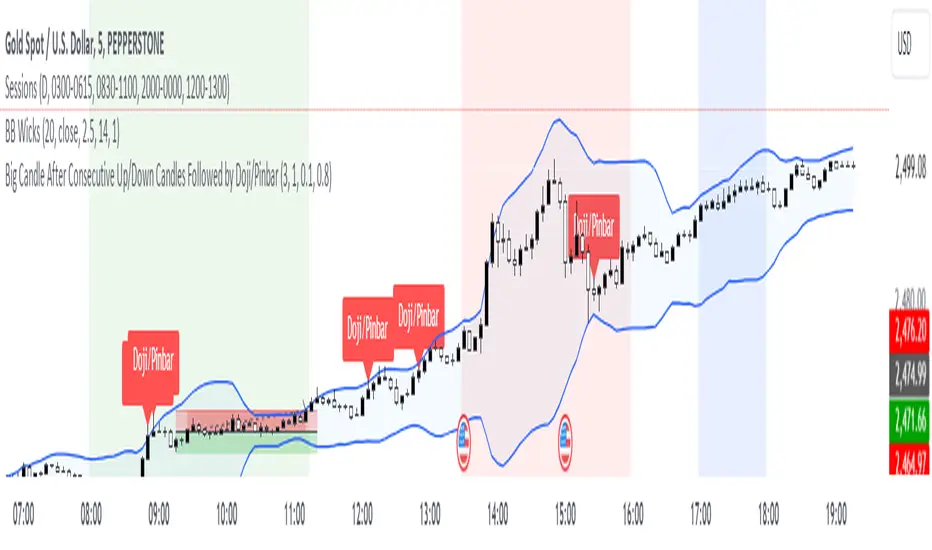
Big Bar Followed by Doji/PinbarUsed find doji/pinbars after a Big candle showing the potential Morning/Evening star formation after x amount of consecutive up moves.
1. Doji Threshold (dojiThreshold)
What is a Doji?: A doji is a candlestick pattern where the opening and closing prices are very close to each other. It represents indecision in the market.
Threshold Explanation: The dojiThreshold is used to define what qualifies as a doji by comparing the size of the candle's body (the difference between the opening and closing prices) to the total range of the candle (the difference between the high and low prices).
How it works:
The formula in the script checks if the absolute difference between the close and open is less than or equal to a percentage of the entire candle's range.
Example: If the dojiThreshold is set to 0.1 (or 10%), this means that for a candle to be considered a doji, the size of the body (the difference between the open and close) must be 10% or less of the total candle's range (the difference between the high and low prices).
In other words, if the body is small enough (based on the threshold), the candle is considered a doji.
2. Pinbar Body Size (pinbarBodySize)
What is a Pinbar?: A pinbar (short for "pinocchio bar") is a candlestick pattern with a small body and a long wick (or shadow) on one side, indicating a potential reversal. The longer wick represents a rejection of a certain price level.
Body Size Explanation: The pinbarBodySize defines the maximum proportion of the candle's total range that the body can occupy for the candle to be considered a pinbar.
How it works:
The script compares the size of the body to the total range of the candle.
Example: If pinbarBodySize is set to 0.3 (or 30%), the body of the candle must be 30% or less of the total range for it to be considered a pinbar. This ensures that the candle has a small body and, therefore, a relatively long wick on one side.
The script then checks whether the longer wick is on the upper or lower side of the candle to determine if it's a valid pinbar pattern.
Summary:
Doji: The dojiThreshold parameter sets how close the open and close prices need to be relative to the candle's range for the candle to be considered a doji.
Pinbar: The pinbarBodySize parameter sets the maximum size of the body relative to the candle's total range to qualify it as a pinbar.
Both of these thresholds are adjustable in the script, allowing you to fine-tune what qualifies as a doji or pinbar based on your trading style and the market conditions you're analyzing.
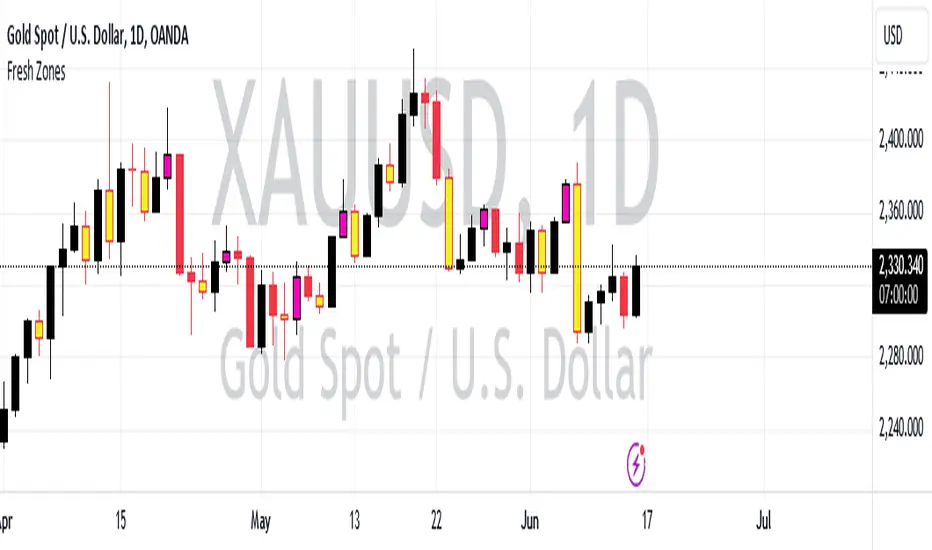
Fresh Zones The indicator is named "Fresh Zones"
Bullish Fresh Zone:
- This part looks for a specific pattern in the price movement that indicates a potential bullish (upward) trend.
- It checks if the current bar's low price is higher than the previous bar's opening price.
- It also checks if the previous bar's closing price was higher than its opening price.
- Additionally, it checks if the bar before the previous one had a closing price lower than its opening price.
- If all these conditions are met, it identifies a bullish fresh zone.
Bearish Fresh Zone:
- This part looks for a specific pattern in the price movement that indicates a potential bearish (downward) trend.
- It checks if the current bar's high price is lower than the previous bar's opening price.
- It also checks if the previous bar's closing price was lower than its opening price.
- Additionally, it checks if the bar before the previous one had a closing price higher than its opening price.
- If all these conditions are met, it identifies a bearish fresh zone.
Color Coding:
- When a bullish fresh zone is identified, it colors the candlestick from two bars ago with a specific yellowish color (`color.rgb(240, 243, 33)`).
- When a bearish fresh zone is identified, it colors the candlestick from two bars ago with a specific pink color (`color.rgb(255, 0, 191)`).
Alert:
- The script creates an alert condition.
- If either a bullish or bearish fresh zone pattern appears, it triggers an alert with the message "A Fresh zone has appeared!".
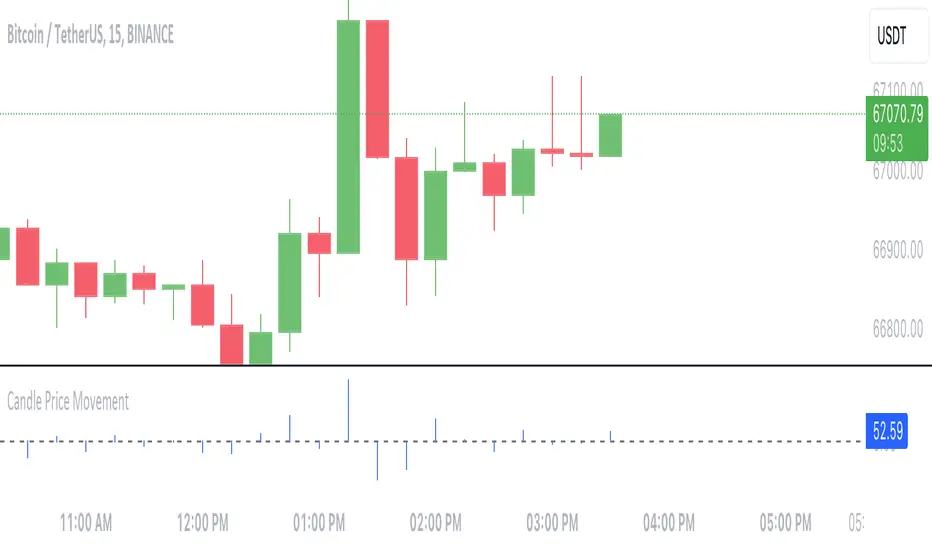
Candle Price MovementThis Pine Script indicator calculates and visualizes the price movement for each candlestick on the chart.
- **Calculation**: The price movement for each candle is determined by subtracting the opening price from the closing price.
- **Visualization**: The price movement is plotted as a histogram, with positive values indicating upward movement (green bars) and negative values indicating downward movement (red bars).
- **Options**:
- The histogram bars are colored blue with zero opacity, providing a clear visual distinction from the background.
- A horizontal line at zero (the "Zero Line") is added for reference, helping to identify periods of no price movement.
---
This indicator provides traders with a quick visualization of the price movement for each candlestick, helping to identify trends and potential trading opportunities.
Engulfing CandlesThis script serves as the "Engulfing Candles" indicator in TradingView. Here's what it does:
- It identifies bullish candlestick patterns where the current candle's high is lower than the previous candle's high, the current candle's low is higher than the previous candle's low, the current candle's close is higher than the previous candle's close, and the current candle's open is higher than the previous candle's open. It also identifies bearish candlestick patterns where the conditions are reversed.
- The indicator colors bullish candles in a specific color (Yellow Green) to visually highlight the bullish pattern, and colors bearish candles in another color (Purple pink) to visually highlight the bearish pattern.
- Additionally, it triggers an alert when either the bullish or bearish triangle shape appears, notifying traders with the message "A Southern Star Shadows pattern has appeared!"

Heikin Ashi and Optimized Trend Tracker and PVSRA [Erebor]Heikin Ashi Candles
Let's consider a modification to the traditional “Heikin Ashi Candles” where we introduce a new parameter: the period of calculation. The traditional HA candles are derived from the open , high low , and close prices of the underlying asset.
Now, let's introduce a new parameter, period, which will determine how many periods are considered in the calculation of the HA candles. This period parameter will affect the smoothing and responsiveness of the resulting candles.
In this modification, instead of considering just the current period, we're averaging or aggregating the prices over a specified number of periods . This will result in candles that reflect a longer-term trend or sentiment, depending on the chosen period value.
For example, if period is set to 1, it would essentially be the same as traditional Heikin Ashi candles. However, if period is set to a higher value, say 5, each candle will represent the average price movement over the last 5 periods, providing a smoother representation of the trend but potentially with delayed signals compared to lower period values.
Traders can adjust the period parameter based on their trading style, the timeframe they're analyzing, and the level of smoothing or responsiveness they prefer in their candlestick patterns.
Optimized Trend Tracker
The "Optimized Trend Tracker" is a proprietary trading indicator developed by TradingView user ANIL ÖZEKŞİ. It is designed to identify and track trends in financial markets efficiently. The indicator attempts to smooth out price fluctuations and provide clear signals for trend direction.
The Optimized Trend Tracker uses a combination of moving averages and adaptive filters to detect trends. It aims to reduce lag and noise typically associated with traditional moving averages, thereby providing more timely and accurate signals.
Some of the key features and applications of the OTT include:
• Trend Identification: The indicator helps traders identify the direction of the prevailing trend in a market. It distinguishes between uptrends, downtrends, and sideways consolidations.
• Entry and Exit Signals: The OTT generates buy and sell signals based on crossovers and direction changes of the trend. Traders can use these signals to time their entries and exits in the market.
• Trend Strength: It also provides insights into the strength of the trend by analyzing the slope and momentum of price movements. This information can help traders assess the conviction behind the trend and adjust their trading strategies accordingly.
• Filter Noise: By employing adaptive filters, the indicator aims to filter out market noise and false signals, thereby enhancing the reliability of trend identification.
• Customization: Traders can customize the parameters of the OTT to suit their specific trading preferences and market conditions. This flexibility allows for adaptation to different timeframes and asset classes.
Overall, the OTT can be a valuable tool for traders seeking to capitalize on trending market conditions while minimizing false signals and noise. However, like any trading indicator, it is essential to combine its signals with other forms of analysis and risk management strategies for optimal results. Additionally, traders should thoroughly back-test the indicator and practice using it in a demo environment before applying it to live trading.
PVSRA (Price, Volume, S&R Analysis)
“PVSRA” (Price, Volume, S&R Analysis) is a trading methodology and indicator that combines the analysis of price action, volume, and support/resistance levels to identify potential trading opportunities in financial markets. It is based on the idea that price movements are influenced by the interplay between supply and demand, and analyzing these factors together can provide valuable insights into market dynamics.
Here's a breakdown of the components of PVSRA:
• Price Action Analysis: PVSRA focuses on analyzing price movements and patterns on price charts, such as candlestick patterns, trendlines, chart patterns (like head and shoulders, triangles, etc.), and other price-based indicators. Traders using PVSRA pay close attention to how price behaves at key support and resistance levels and look for patterns that indicate potential shifts in market sentiment.
• Volume Analysis: Volume is an essential component of PVSRA. Traders monitor changes in trading volume to gauge the strength or weakness of price movements. An increase in volume during a price move suggests strong participation and conviction from market participants, reinforcing the validity of the price action. Conversely, low volume during price moves may indicate lack of conviction and potential reversals.
• Support and Resistance (S&R) Analysis: PVSRA incorporates the identification and analysis of support and resistance levels on price charts. Support levels represent areas where buying interest is expected to be strong enough to prevent further price declines, while resistance levels represent areas where selling interest may prevent further price advances. These levels are often identified using historical price data, trendlines, moving averages, pivot points, and other technical analysis tools.
The PVSRA methodology combines these three elements to generate trading signals and make trading decisions. Traders using PVSRA typically look for confluence between price action, volume, and support/resistance levels to confirm trade entries and exits. For example, a bullish reversal signal may be considered stronger if it occurs at a significant support level with increasing volume.
It's important to note that PVSRA is more of a trading approach or methodology rather than a specific indicator with predefined rules. Traders may customize their analysis based on their preferences and trading style, incorporating additional technical indicators or filters as needed. As with any trading strategy, risk management and proper trade execution are essential components of successful trading with PVSRA.
The following types of moving average have been included: "SMA", "EMA", "SMMA (RMA)", "WMA", "VWMA", "HMA", "KAMA", "LSMA", "TRAMA", "VAR", "DEMA", "ZLEMA", "TSF", "WWMA". Thanks to the authors.
Thank you for your indicator “Optimized Trend Tracker”. © kivancozbilgic
Thank you for your indicator “PVSRA Volume Suite”. © creengrack
Thank you for your programming language, indicators and strategies. © TradingView
Kind regards.
© Erebor_GIT

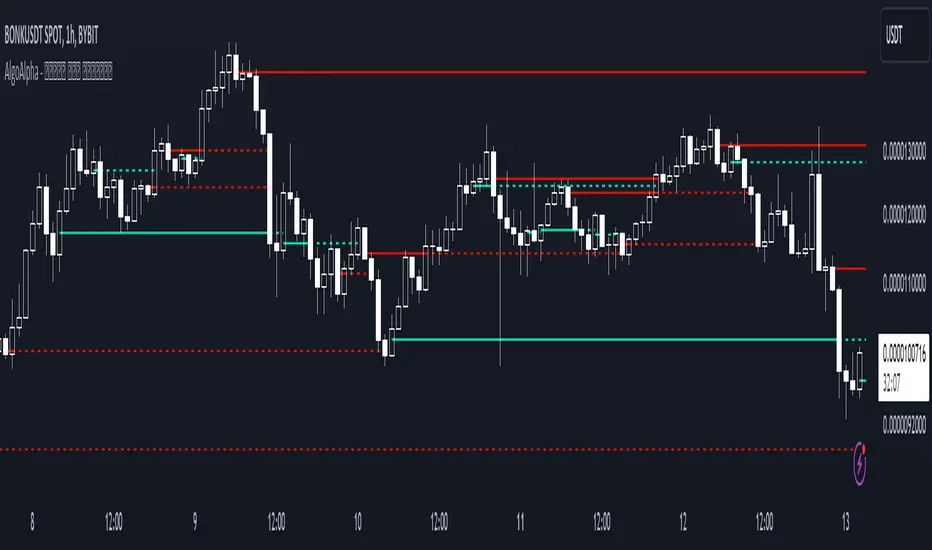
Peak & Valley Levels [AlgoAlpha]The Peak & Valley Levels indicator is a sophisticated script designed to pinpoint key support and resistance levels in the market. By utilizing candle length and direction, it accurately identifies potential reversal points, offering traders valuable insights for their strategies.
Core Components:
Peak and Valley Detection: The script recognizes peaks and valleys in price action. Peaks (potential resistance levels) are identified when a candle is longer than the previous one, changes direction, and closes lower, especially on lower volume. Valleys (potential support levels) are detected under similar conditions but with the candle closing higher.
Color-Coded Visualization:
Red lines mark resistance levels, signifying peaks in the price action.
Green lines indicate support levels, representing valleys.
Dynamic Level Adjustment: The script adapts these levels based on ongoing market movements, enhancing their relevance and accuracy.
Rejection Functions:
Bullish Rejection: Determines if a candlestick pattern rejects a level as potential support.
Bearish Rejection: Identifies if a pattern rejects a level as possible resistance.
Usage and Strategy Integration:
Visual Aid for Support and Resistance: The indicator is invaluable for visualizing key market levels where price reversals may occur.
Entry and Exit Points: Traders can use the identified support and resistance levels to fine-tune entry and exit points in their trading strategies.
Trend Reversal Signals: The detection of peaks and valleys serves as an early indicator of potential trend reversals.
Application in Trading:
Versatile for Various Trading Styles: This indicator can be applied across different trading styles, including swing trading, scalping, or trend-following approaches.
Complementary Tool: For best results, it should be used alongside other technical analysis tools to confirm trading signals and strategies.
Customization and Adaptability: Traders are encouraged to experiment with different settings and timeframes to tailor the indicator to their specific trading needs and market conditions.
In summary, the Peak & Valley Levels by AlgoAlpha is a dynamic and adaptable tool that enhances a trader’s ability to identify crucial market levels. Its integration of candlestick analysis with dynamic level adjustment offers a robust method for spotting potential reversal points, making it a valuable addition to any trader's toolkit.
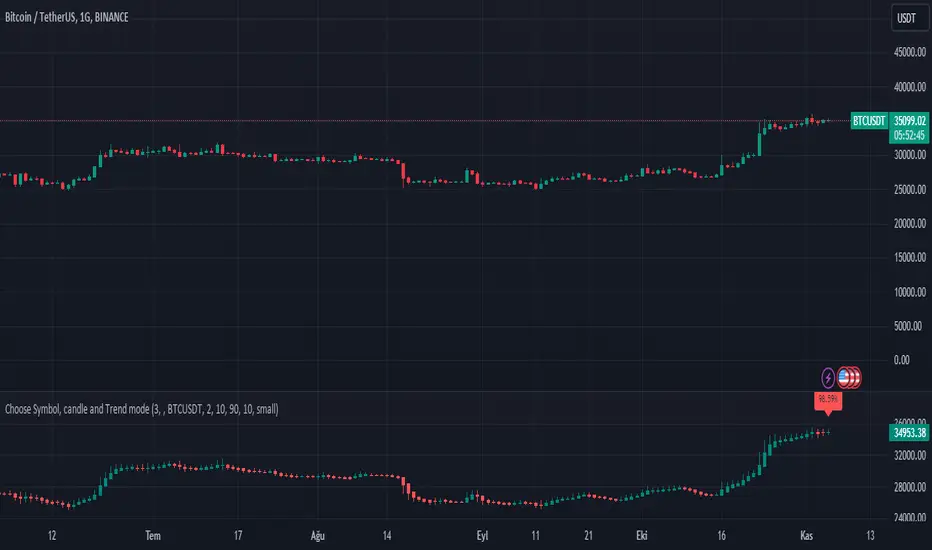
Choose Symbol, candle and Trend modeThis Pine Script code is designed for technical analysis and visualization of price movements on the TradingView platform. It serves as a tool for traders and investors to:
Price Chart Analysis: The code plots the price chart of a selected symbol and utilizes Heikin-Ashi candlesticks to visualize price movements. This aids in better understanding price trends, support and resistance levels, retracements, and other price actions.
Trend Identification: The code also employs the Exponential Moving Average (EMA) to identify the price trend. EMA is commonly used to determine the strength and direction of a trend. Traders and investors can use this information to track trends and develop trading strategies.
Buy and Sell Signals: The code generates buy and sell signals based on EMA. These signals provide information on when to consider buying or selling a specific symbol. This is particularly useful for traders when making trading decisions.
Timeframe Customization: Users can adapt the code to different timeframes. This flexibility is valuable for those looking to develop strategies for both short-term and long-term trading.
Customization: The code allows users to customize various parameters, including the symbol, timeframe, Heikin-Ashi mode, and others. This enables it to be tailored to different assets and trading styles.
Please note that this code is provided for educational and informational purposes only. It does not constitute financial advice or recommendations for specific trading actions. Any trading decisions made using this code should be based on individual research, analysis, and a clear understanding of the associated risks.
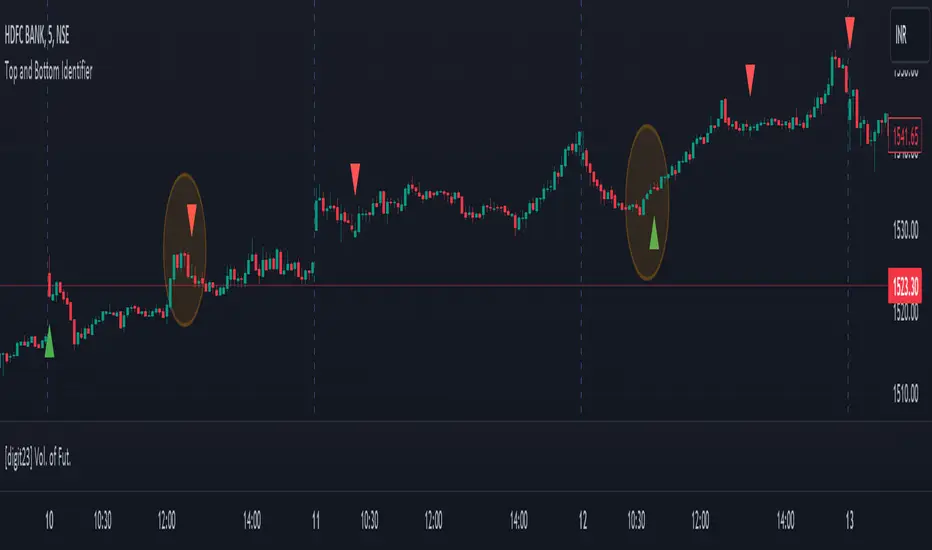
Top and Bottom Identifier [digit23]This indicator is designed to identify potential market tops and bottoms based on customizable conditions. It employs price action analysis, considering candlestick patterns, body size, and recent price history. Traders can adjust parameters like the threshold multiplier and body size multiplier to fine-tune sensitivity.
Features:
Identifies potential tops and bottoms.
Customizable threshold and body size multipliers.
Utilizes price action analysis exclusively.
User-friendly and visually represented on the chart.
Usage:
Red Triangles: Indicate potential market tops.
Green Triangles: Indicate potential market bottoms.
Parameters:
Threshold Multiplier: Adjusts sensitivity.
Body Size Multiplier: Controls the significance of candlestick body size.
Note:
This indicator is for traders preferring price action analysis to identify potential reversals. It's recommended to use alongside other technical analysis tools for comprehensive trading decisions.
Disclaimer:
Trading involves risk; thorough analysis is crucial before making decisions. This indicator is a tool for technical analysis and should be part of a broader trading strategy.
Contraction Box & Doji LinesContraction & Doji Lines indicator is designed to identify and visualize potential support and resistance levels on a price chart. It does this by detecting doji candlestick patterns and drawing horizontal lines from the middle of the doji bodies to the right. Additionally, it also highlights price contraction zones with colored boxes.
The indicator first identifies doji candlestick patterns that it suggests indecision in the market, a horizontal line and these horizontal lines can act as potential support or resistance levels. Traders can observe price reactions around these lines. If the price approaches a line and bounces off it, it may indicate a significant level in the market.
In addition to doji lines, this indicator also highlights price contraction zones. When a contraction zone is detected, a colored box is drawn to highlight this zone. The box extends from the fifth bar ago (left side) to the current bar (right side), with the highest high and lowest low of the identified zone. The color and width of this box can be customized using the "Box Line Border Color," "Box Background Color," and "Box Width" parameters.
A possible strategy could be can use the doji lines as potential support and resistance levels to make trading decisions. For example, if the price breaks above a doji line and holds, it may indicate a bullish signal.
The colored boxes highlight areas of price contraction, which often precede significant price movements. Traders can use these zones to anticipate potential breakouts or breakdowns.
For example, you might enter a long (buy) position if it anticipate a breakout from a contraction zone with a target price set above the breakout level. Conversely, you might enter a short (sell) position if they anticipate a breakdown from a contraction zone with a target price set below the breakdown level.

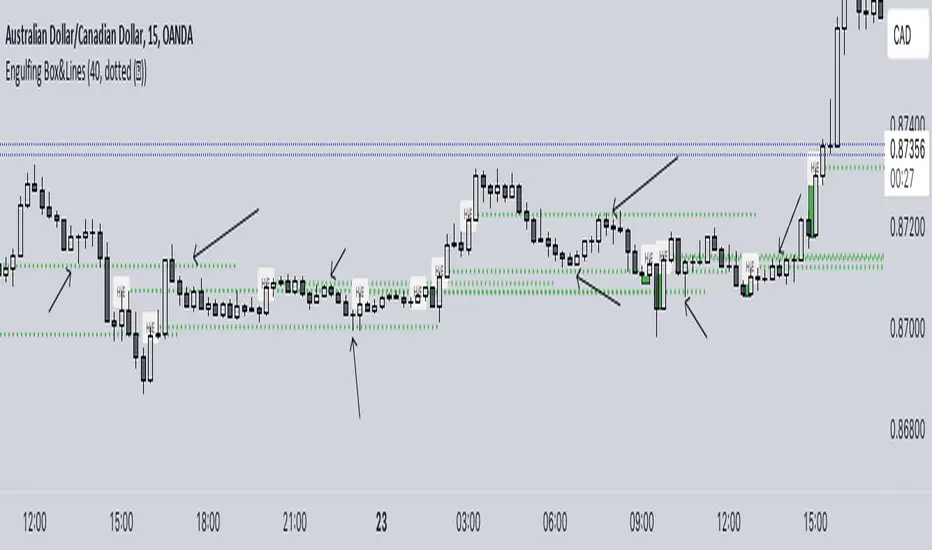
Engulfing Box & LinesThe "Engulfing Box & Lines" indicator aims to spot and highlight Engulfing candlestick patterns within a trend. These patterns can provide valuable indications of a possible trend reversal, and the indicator underlines them through the use of colored rectangles and horizontal lines. To fully understand the functioning and use of this indicator, let's explore its key elements and associated strategies.
Identification of Engulfing Patterns:
The indicator focuses on detecting two types of Engulfing candles:
Bullish Engulfing: Occurs when a bullish candle (open lower than close) completely encloses the body of the previous bearish candle. This could indicate a possible upside reversal.
Bearish Engulfing: Occurs when a bearish candle (opening higher than closing) entirely engulfs the body of the previous bullish candle. This could signal a potential bearish reversal.
Using the EMA 200:
The indicator uses the 200-period Exponential Moving Average (EMA) as a reference to determine the position of the candles with respect to the long-term trend. When the price is above the 200 EMA, the bullish Engulfing candles are highlighted with a green box, while below the 200 EMA, red boxes are shown for the bearish Engulfing candles.
Size of Boxes and Lines:
The colored boxes represent the size of the body of the candle that caused the Engulfing. Additionally, a horizontal line is drawn close to the body of the candle, serving as the fulcrum of the indicator.
Trading Strategies:
This indicator can be used for different trading strategies:
Trend Continuation: During a positive trend, the onset of an engulfing pattern suggests a possible continuation of the trend. The horizontal lines represent potential support areas, where the price could bounce. Traders might consider buying during such bounces.
Retracements and Entries: Lines can act as support or resistance zones, depending on the trend. When the price approaches a line, a retracement could occur. Traders might move to a lower timeframe to spot entry signals, using the line as a reference.
Closing Positions: Lines could also be used to define exit levels. For example, a trader might decide to exit a position when the price approaches a resistance line.
Confirmations with Other Indicators: The indicator could be used in conjunction with other technical tools, such as oscillators or candlestick analysis, to confirm signals and improve the accuracy of trading decisions.
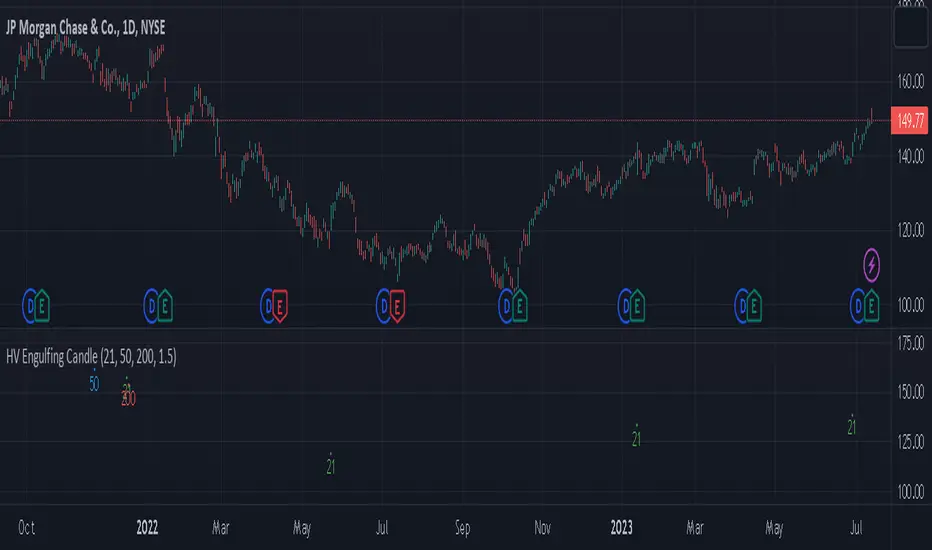
High Volume Engulfing Candle near EMAsThe indicator is designed to identify and signal instances of high volume and engulfing candles near three Exponential Moving Averages (EMAs): the 21EMA, 50EMA, and 200EMA. It can be used in various financial markets such as stocks, forex, commodities, or cryptocurrencies, as long as the market data is available on the TradingView platform.
Here's a breakdown of how the indicator works and its features:
High Volume Detection: The indicator considers a candle to have high volume if its volume is greater than or equal to a specified threshold. The default threshold is set to 1.5 times the 20-period Simple Moving Average (SMA) of the volume. You can adjust the volume_threshold parameter to customize the threshold according to your preferences.
Engulfing Candle Detection: An engulfing candle is identified when the current candle's range engulfs the range of the previous candle. The indicator checks if the current candle is either bullish engulfing (open > close and close > open ) or bearish engulfing (open < close and close < open ). This helps identify significant shifts in market sentiment.
Proximity to EMAs: The indicator checks if the low of the candle is below and the high is above each of the three EMAs (21EMA, 50EMA, and 200EMA). This indicates that the price action is near or interacting with these key moving averages.
When all the following conditions are met, the indicator plots shapes below the candlesticks on the chart to generate signals:
The candle has high volume (volume_threshold).
The candle is an engulfing candle.
The candle's range engulfs the 21EMA, 50EMA, or 200EMA.
The shapes are plotted with different colors and labels to indicate which EMA condition is met. Green shapes represent the 21EMA condition, blue shapes represent the 50EMA condition, and red shapes represent the 200EMA condition.
By using this indicator, traders can potentially identify significant market movements, areas of price interaction with key EMAs, and instances of high volume that may signify strong buying or selling pressure.
ATR VisualizerAdvance Your Market Analysis with the True Range Indicator
The True Range Indicator is a sophisticated screener meticulously developed to bolster your trading execution by presenting an exceptional understanding of the market direction. The centerpiece of this instrument is a distinctive candle configuration depicting the Average True Range (ATR) and the Bear/Bull range. However, it traverses beyond the conventional channels to offer specific market settings to boost your trading decisions.
User-Defined Settings
Broadly, the indicator offers five dynamic settings:
Bear/Bull Range
The Bear/Bull Range outlines the ATR for each candle type - bearish and bullish - and then smartly opts for the pertinent one based on the prevalent market circumstances. This feature aids in comparing the range of bullish and bearish candlesticks, which deepens your understanding of the price action and volatility.
Bearish Range
The Bearish Range isolates and computes the ATR for bearish candles solely. Utilizing this option spots the bear-dominated periods and provides insights about potential market reversals or downward continuations.
Bullish Range
Opposite to the Bearish Range, the Bullish Range setting tabulates the ATR exclusively for bullish candles. It assists in tracking the periods when bulls control, enlightening traders about the possibility of upward continuations or trend reversals.
Average Range
The Average Range provides an unbiased measure of range without prioritizing either bull or bear trends. This model is ideal for traders looking for a holistic interpretation of market behavior, regardless of direction.
Cumulative Average Range
Equally significant is the Cumulative Average Range which calculates the aggregate moving average of the true ranges for an expressed period. This setting is extremely valuable when evaluating the long-term volatility and spotting potential breakouts.
Dual Candle Configuration
Going a step ahead, the True Range Indicator uniquely offers the possibility to incorporate more than one candle estimate on your screen. This ensures simultaneous analysis of multiple market dynamics, thereby enhancing your trading precision multifold.
Concluding Thoughts
In essence, the True Range Indicator is an indispensable companion for traders looking to not only leverage market volatility but also make educated predictions. Equipped with an array of insightful market settings and the ability to display dual candle estimates on-screen, you can customize the functionality to suit your unique trading style and magnify your market performance dramatically.

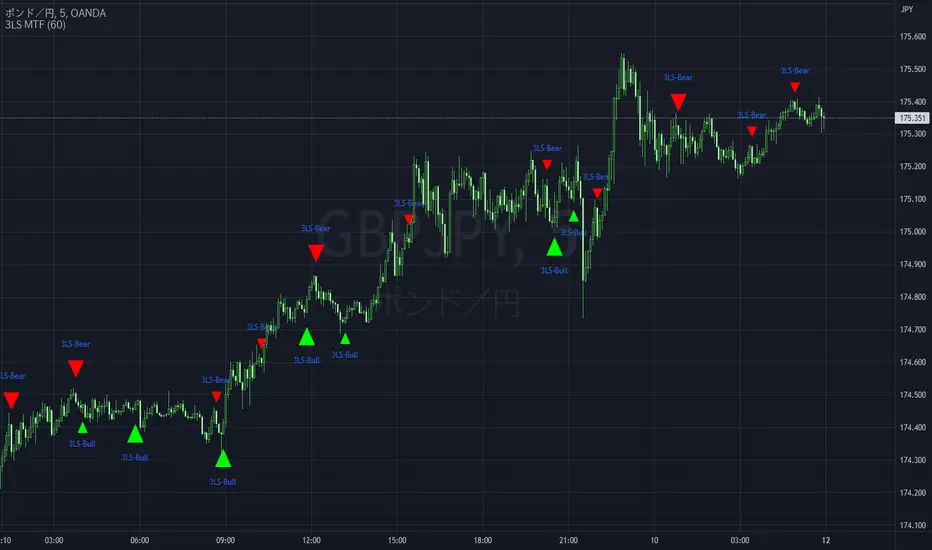
3 Line Strike MTF [MsF]Japanese below / 日本語説明は英文の後にあります。
-------------------------
*This indicator is based on TheTrdFloor's "3 Line Strike ". It's a very cool indicator. thank you.
In addition to the original indicator, it will be judged Engulfing only when the display of the MTF signal and the candle have a difference of 2 times or more.
=== Function description ===
1. Display of the MTF signal
Detects Engulfing of the specified Multi Time Frame. MTF Engulfing is displayed with 🍆 and 🍑.
2. Judged Engulfing on a difference of 2 times or more
Show a signal if the body of the current candle is more than twice as large as the body of the previous candle. This will make the signal mark appear larger than normal.
=== Parameter description ===
- COMMON SETTING
- Show Signal on MTF ? … If the check this, you can get MTF 3 Line Strike
- Judge Double Engulfing ? … If you check it, the signal will come up only when the Engulfing has doubled or more.
- 3 LINE STRIKE
- Show Bearish 3 Line Strike … The Bearish 3 Line Strike (3LS-Bear) is a candlestick pattern comprised of 3 bullish (green) candles, followed by a bearish engulfing candle (see 'Big A$$ Candles' below). This pattern tends to be best used as a signal of the end of a retracement period as part of a trend continuation strategy. Default: Checked
- Show Bullish 3 Line Strike … The Bullish 3 Line Strike (3LS-Bull) is a candlestick pattern comprised of 3 bearish (red) candles, followed by a bullish engulfing candle (see 'Big A$$ Candles' below). This pattern tends to be best used as a signal of the end of a retracement period as part of a trend continuation strategy. Default: Checked
- BIG A$$ CANDLES
- Show Bearish Big A$$ Candles … Bearish 'Big A$$ Candles' are the same as Bearish Engulfing candles.
- Show Bullish Big A$$ Candles … Bullish 'Big A$$ Candles' are the same as Bullish Engulfing candles.
-------------------------
本来のインジケーターに、①MTFシグナルの表示と②ローソク足の表示に2倍以上の差がある場合のみ包み足の判定を追加しました。
=== 機能説明 ===
1. MTFシグナルの表示
指定された時間足の包み足を検出します。 🍆 と 🍑 で表示されます。
2. 2倍以上の差で包み足判定
現在のローソクの実体が前のローソクの実体よりも 2 倍以上大きい場合にシグナルを表示します。マークは通常よりも大きく表示されます。
=== パラメータの説明 ===
- COMMON SETTING
- Show Signal on MTF ? … MTFシグナルを表示します
- Judge Double Engulfing ? … 包み足が前の足の2倍以上になった場合のみシグナルを発報します
- 3 LINE STRIKE
- Show Bearish 3 Line Strike … 陰線が3連続続いた後の包み足を検出します
- Show Bullish 3 Line Strike … 陽線が3連続続いた後の包み足を検出します
- BIG A$$ CANDLES
- Show Bearish Big A$$ Candles … 陽線の包み足を検出します
- Show Bullish Big A$$ Candles … 陰線の包み足を検出します
Price Percentage Breakout by Time PeriodDescription:
The Price Percentage Breakout by Time Period (P%BTP) indicator is a technical analysis tool designed to identify potential breakout signals based on the percentage change in price over a specified lookback period. It helps traders identify significant price movements that exceed a user-defined threshold, indicating potential trading opportunities.
How it Works:
The P%BTP indicator calculates the percentage change between the open and close prices of each candle. It compares this percentage change to the highest percentage change observed over the specified lookback period. When the percentage change exceeds or equals this highest value, it indicates a potential breakout signal. The indicator colors the bars on the chart based on whether it's a bullish or bearish breakout.
Usage:
To effectively utilize the Price Percentage Breakout by Time Period indicator, follow these steps:
1. Apply the P%BTP indicator to your chart by adding it from the available indicators.
2. Customize the input settings to suit your preferences. You can define the lookback period, which determines the number of bars used for calculating the percentage change, as well as choose colors for bullish and bearish breakouts.
3. Observe the bars on the chart:
- Bars highlighted in the bullish color indicate potential bullish breakout signals.
- Bars highlighted in the bearish color indicate potential bearish breakout signals.
4. Interpret the breakout signals:
- A bullish breakout signal occurs when the percentage change in price exceeds or equals the highest percentage change observed over the lookback period, indicating a potential upward movement.
- A bearish breakout signal occurs when the percentage change in price exceeds or equals the highest percentage change observed over the lookback period, indicating a potential downward movement.
5. Consider additional analysis:
- Combine the breakout signals from the P%BTP indicator with other technical analysis tools, such as support and resistance levels, trend lines, or candlestick patterns, to confirm potential trade setups.
6. Implement appropriate risk management strategies, including setting stop-loss orders and position sizing, to manage your trades effectively and protect your capital.
Note: The Price Percentage Breakout by Time Period indicator provides insights into potential breakout signals based on the percentage change in price over a specified lookback period. However, it is recommended to use this indicator in conjunction with other technical analysis tools and perform thorough analysis before making trading decisions.

Price Percentage Breakout by Chosen PercentageDescription:
The Price Percentage Breakout indicator (P%B) is a technical analysis tool designed to identify potential breakout signals based on percentage changes in price. It helps traders identify significant price movements that exceed a specified threshold, indicating potential trading opportunities.
How it Works:
The Price Percentage Breakout indicator calculates the percentage change between the open and close prices of each candle. It compares this percentage change to a user-defined threshold to determine if a breakout has occurred. When the percentage change exceeds the threshold, indicating a significant price movement, the indicator highlights the breakout on the chart. Additionally alerts can be created by the user that display the percentage of the breakout.
Usage:
To effectively utilize the Price Percentage Breakout indicator, follow these steps:
1. Apply the P%B indicator to your chart by adding it from the available indicators.
2. Customize the input settings to suit your preferences. You can choose the color for highlighting the breakout and set the percentage threshold for detecting breakouts.
3. Observe the bars on the chart:
- Bars highlighted in the chosen color indicate potential breakout signals.
4. Interpret the breakout signals:
- A breakout signal occurs when the percentage change in price exceeds the specified threshold. This suggests a significant price movement.
5. Consider additional analysis:
- Combine the breakout signals from the Price Percentage Breakout indicator with other technical analysis tools, such as support and resistance levels, trend lines, or candlestick patterns, to confirm potential trade setups.
6. Implement appropriate risk management strategies, including setting stop-loss orders and position sizing, to manage your trades effectively and protect your capital.
Note: The Price Percentage Breakout indicator provides insights into potential breakout signals based on percentage changes in price. However, it is recommended to use this indicator in conjunction with other technical analysis tools and perform thorough analysis before making trading decisions.
[blackcat] L1 Buy After RetracementLevel 1
Background
A summary of Buy After Retracement Entry Points.
Function
The "retraction to the moving average buying method", as the name suggests, is a buying reference for short-term adjustment and retracement to the key moving average after a single stock rises. For example, after the index has undergone a sharp correction, many strong stock varieties have retreated or are about to retreat to the key moving average position, and the buying point generated at this time is the "retraction to moving average buying method". Because candlesticks and moving averages have different styles, I summarize what I think of through this script.
Remarks
Feedbacks are appreciated.