Price Action Trend and Margin EquityThe Price Action Trend and Margin Equity indicator is a multifunctional market analysis tool that combines elements of money management and price pattern analysis. The indicator helps traders identify key price action patterns and determine optimal entry, exit and stop loss levels based on the current trend.
The main components of the indicator:
Money Management:
Allows the trader to set risk management parameters such as the percentage of possible loss on the position, the use of fixed leverage and the total capital.
Calculates the required leverage level to achieve a specified percentage of loss.
Price Action:
Correctly identifies various price patterns such as Pin Bar, Engulfing Bar, PPR Bar and Inside Bar.
Displays these patterns on the chart with the ability to customize candle colors and display styles.
Allows the trader to customize take profit and stop loss points to display them on the chart.
The ability to display patterns only in the direction of the trend.
Trend: (some code taken from ChartPrime)
Uses a trend cloud to visualize the current market direction.
The trend cloud is displayed on the chart and helps traders determine whether the market is in an uptrend or a downtrend.
Alert:
Allows you to set an alert that will be triggered when the pattern is formed.
Example of use:
Let's say a trader uses the indicator to trade the crypto market. He sets the money management parameters, setting the maximum loss per position to 5% and using a fixed leverage of 1:100. The indicator automatically calculates the required position size to meet these parameters ($: on the label). Or displays the leverage (X: on the label) to achieve the required risk.
The trader receives an alert when a Pin Bar is formed. The indicator displays the entry, exit, and stop loss levels based on this pattern. The trader opens a position for the recommended amount in the direction indicated by the indicator and sets the stop loss and take profit at the recommended levels.
General Settings:
Position Loss Percentage: Sets the maximum loss percentage you are willing to take on a single position.
Use Fixed Leverage: Enables or disables the use of fixed leverage.
Fixed Leverage: Sets the fixed leverage level.
Total Equity: Specifies the total equity you are using for trading. (Required for calculation when using fixed leverage)
Turn Patterns On/Off: You can turn on or off the display of various price patterns such as Pin Bar, Outside Bar (Engulfing), Inside Bar, and PPR Bar.
Pattern Colors: Sets the colors for displaying each pattern on the chart.
Candle Color: Allows you to set a neutral color for candles that do not match the price action.
Show Lines: Allows you to turn on or off the display of labels and lines.
Line Length: Sets the length of the stop, entry, and take profit lines.
Label color: One color for all labels (configured below) or the color of the labels in the color of the candle pattern.
Pin entry: Select the entry point for the pin bar: candle head, bar close, or 50% of the candle.
Coefficients for stop and take lines.
Use trend for price action: When enabled, will show price action signals only in the direction of the trend.
Display trend cloud: Enables or disables the display of the trend cloud.
Cloud calculation period: Sets the period for which the maximum and minimum values for the cloud are calculated. The longer the period, the smoother the cloud will be.
Cloud colors: Sets the colors for uptrends and downtrends, as well as the transparency of the cloud.
The logic of the indicator:
Pin Bar is a candle with a long upper or lower shadow and a short body.
Logic: If the length of one shadow is twice the body and the opposite shadow of the candle, it is considered a Pin Bar.
An Inside Bar is a candle that is completely engulfed by the previous candle.
Logic: If the high and low of the current candle are inside the previous candle, it is an Inside Bar.
An Outside Bar or Engulfing is a candle that completely engulfs the previous candle.
Logic: If the high and low of the current candle are outside the previous candle and close outside the previous candle, it is an Outside Bar.
A PPR Bar is a candle that closes above or below the previous candle.
Logic: If the current candle closes above the high of the previous candle or below its low, it is a PPR Bar.
Stop Loss Levels: Calculated based on the specified ratios. If set to 1.0, it shows the correct stop for the pattern by pushing away from the entry point.
Take Profit Levels: Calculated based on the specified ratios.
Create a Label: The label is created at the stop loss level and contains information about the potential leverage and loss.
The formula for calculating the $ value is:
=(Total Capital x (Maximum Loss Percentage on Position/100)) / (Difference between Entry Level and Stop Loss Level × Ratio that sets the stop loss level relative to the length of the candlestick shadow × Fixed Leverage Value) .
Labels contain the following information:
The percentage of price change from the recommended entry point to the stop loss level.
Required Leverage (X: ): The amount of leverage required to achieve the specified loss percentage. (Or a fixed value if selected).
Required Capital ($: ): The amount of capital required to open a position with the specified leverage and loss percentage (only displayed when using fixed leverage).
The trend cloud identifies the maximum and minimum price values for the specified period.
The cloud value is set depending on whether the current price is equal to the high or low values.
If the current closing price is equal to the high value, the cloud is set at the low value, and vice versa.
RU
Индикатор "Price Action Trend and Margin Equity" представляет собой многофункциональный инструмент для анализа рынка, объединяющий в себе элементы управления капиталом и анализа ценовых паттернов. Индикатор помогает трейдерам идентифицировать ключевые прайс экшн паттерны и определять оптимальные уровни входа, выхода и стоп-лосс на основе текущего тренда.
Основные компоненты индикатора:
Управление капиталом:
Позволяет трейдеру задавать параметры управления рисками, такие как процент возможного убытка по позиции, использование фиксированного плеча и общий капитал.
Рассчитывает необходимый уровень плеча для достижения заданного процента убытка.
Price Action:
Правильно идентифицирует различные ценовые паттерны, такие как Pin Bar, Поглащение Бар, PPR Bar и Внутренний Бар.
Отображает эти паттерны на графике с возможностью настройки цветов свечей и стилей отображения.
Позволяет трейдеру настраивать точки тейк профита и стоп лосса для отображения их на графике.
Возможность отображения паттернов только в натправлении тренда.
Trend: (часть кода взята у ChartPrime)
Использует облако тренда для визуализации текущего направления рынка.
Облако тренда отображается на графике и помогает трейдерам определить, находится ли рынок в восходящем или нисходящем тренде.
Оповещение:
Дает возможность установить оповещение которое будет срабатывать при формировании паттерна.
Пример применения:
Предположим, трейдер использует индикатор для торговли на крипто рынке. Он настраивает параметры управления капиталом, устанавливая максимальный убыток по позиции в 5% и используя фиксированное плечо 1:100. Индикатор автоматически рассчитывает необходимый объем позиции для соблюдения этих параметров ($: на лейбле). Или отображает плечо (Х: на лейбле) для достижения необходимого риска.
Трейдер получает оповещение о формировании Pin Bar. Индикатор отображает уровни входа, выхода и стоп-лосс, основанные на этом паттерне. Трейдер открывает позицию на рекомендуемую сумму в направлении, указанном индикатором, и устанавливает стоп-лосс и тейк-профит на рекомендованных уровнях.
Общие настройки:
Процент убытка по позиции: Устанавливает максимальный процент убытка, который вы готовы понести по одной позиции.
Использовать фиксированное плечо: Включает или отключает использование фиксированного плеча.
Уровень фиксированного плеча: Задает уровень фиксированного плеча.
Общий капитал: Указывает общий капитал, который вы используете для торговли. (Необходим для расчета при использовании фиксированного плеча)
Включение/отключение паттернов: Вы можете включить или отключить отображение различных ценовых паттернов, таких как Pin Bar, Outside Bar (Поглощение), Inside Bar и PPR Bar.
Цвета паттернов: Задает цвета для отображения каждого паттерна на графике.
Цвет свечей: Позволяет задать нейтральный цвет для свечей неподходящих под прйс экшн.
Показывать линии: Позволяет включить или отключить отображение лейблов и линий.
Длинна линий: Настройка длинны линий стопа, линии входа и тейк профита.
Цвет лейбла: Один цвет для всех лейблов (настраивается ниже) или цвет лейблов в цвет паттерна свечи.
Вход в пин: Выбор точки входа для пин бара: голова свечи, точка закрытия бара или 50% свечи.
Коэффиценты для стоп и тейк линий.
Использовать тренд для прайс экшна: При включении будет показывать прайс экшн сигналы только в направлении тренда.
Отображение облака тренда: Включает или отключает отображение облака тренда.
Период расчета облака: Устанавливает период, за который рассчитываются максимальные и минимальные значения для облака. Чем больше период, тем более сглаженным будет облако.
Цвета облака: Задает цвета для восходящего и нисходящего трендов, а также прозрачность облака.
Логика работы индикатора:
Pin Bar — это свеча с длинной верхней или нижней тенью и коротким телом.
Логика: Если длина одной тени вдвое больше тела и противоположной тени свечи, считается, что это Pin Bar.
Inside Bar — это свеча, полностью поглощенная предыдущей свечой.
Логика: Если максимум и минимум текущей свечи находятся внутри предыдущей свечи, это Inside Bar.
Outside Bar или Поглощение — это свеча, которая полностью поглощает предыдущую свечу.
Логика: Если максимум и минимум текущей свечи выходят за пределы предыдущей свечи и закрывается за пределами предыдущей свечи, это Outside Bar.
PPR Bar — это свеча, которая закрывается выше или ниже предыдущей свечи.
Логика: Если текущая свеча закрывается выше максимума предыдущей свечи или ниже ее минимума, это PPR Bar.
Уровни стоп-лосс: Рассчитываются на основе заданных коэффициентов. При значении 1.0 показывает правильный стоп для паттерна отталкиваясь от точки входа.
Уровки тейк-профита: Рассчитываются на основе заданных коэффициентов.
Создание метки: Метка создается на уровне стоп-лосс и содержит информацию о потенциальном плече и убытке.
Формула для вычисления значения $:
=(Общий капитал x (Максимальный процент убытка по позиции/100)) / (Разница между уровнем входа и уровнем стоп-лосс × Коэффициент, задающий уровень стоп-лосс относительно длины тени свечи × Значение фиксированного плеча).
Метки содержат следующую информацию:
Процент изменения цены от рекомендованной точки входа до уровня стоп-лосс.
Необходимое плечо (Х: ): Уровень плеча, необходимый для достижения заданного процента убытка. (Или фиксированное значение если оно выбрано).
Необходимый капитал ($: ): Сумма капитала, необходимая для открытия позиции с заданным плечом и процентом убытка (отображается только при использовании фиксированного плеча).
Облако тренда определяет максимальные и минимальные значения цены за указанный период.
Значение облака устанавливается в зависимости от того, совпадает ли текущая цена с максимальными или минимальными значениями.
Если текущая цена закрытия равна максимальному значению, облако устанавливается на уровне минимального значения, и наоборот.
Search in scripts for "ChartPrime"

Smart Money Breakouts [iskess 01-02 11:05]This is an big update to the excellent Smart Money Breakout Script published in Oct 2023 by ChartPrime who, to my knowledge, was the original author.
FULL CREDIT GOES TO CHARTPRIME FOR THIS ORIGINAL WORK.
Per the moderator's rules, you will find below a meaningful, detailed self-contained description that does not rely on delegation to the open source code or links to other content. You will find in the description details on what the script does, how it does that, how to use it, and how it is original.
The "Smart Money Breakouts" indicator is designed to identify breakouts based on changes in character (CHOCH) or breaks of structure (BOS) patterns, facilitating automated trading with user-defined Take Profit (TP) level.
The indicator incorporates essential elements such as volume analysis and a data table to assist traders in optimizing their strategies.
🔸Breakout Detection:
The indicator scans price movements for "Change in Character" (CHOCH) and "Break of Structure" (BOS) patterns, signaling potential breakout opportunities in the market.
🔸User-Defined TP/SL :
Traders can customize the Take Profit (TP) and Stop Loss (SL) through the indicator settings, with these levels dynamically calculated based on the Average True Range (ATR). This allows for precise risk management and profit targets that adapt to market volatility. Traders can also select the lookback period for the TP/SL calculations.
🔸Volume Analysis and Trade Direction Specific Analysis:
The indicator includes a volume checker that provides valuable insights into the strength of the breakout, taking into account trade direction.
🔸If the volume label is red and the trade is long, it suggests a higher likelihood of hitting the Stop Loss (SL).
🔸If the volume label is green and the trade is long, it indicates a higher probability of hitting the Take Profit (TP).
🔸For short trades, a red volume label suggests a higher likelihood of hitting TP, while a green label suggests a higher likelihood of hitting SL.
🔸A yellow volume label suggests that the volume is inconclusive, neither favoring bullish nor bearish movements.
🔸Data Table:
The indicator features a data table that keeps track of the number of winning and losing trades for specific timeframes or configurations. It also shows the percentage of profits vs losses, and the overall profit/loss for the selected lookback period.
This table serves as a valuable tool for traders to analyze performance and discover optimal settings and timeframes.
The "Smart Money Breakouts" indicator provides traders with a comprehensive solution for breakout trading, combining technical analysis of changes in character and breaks of structure, volume insights, and performance tracking while dynamically adjusting TP and SL levels based on market volatility through the ATR.
This version of the script is a "significant improvement" from Chart Prime's original work in the following ways:
- A selectable range of candles for the profit/loss calculations to look back on.
- An updated table that includes the percentage of wins/losses, and and overall P&L during the selected lookback range.
- The user can now select only Long trades, Short trades, or both.
- The percentage gain/loss is now indicated for every trade on the chart.
- The user can now select a different multiplier for Stop Loss or Take Profit thresholds.

Smart Money Concept Strategy - Uncle SamThis strategy combines concepts from two popular TradingView scripts:
Smart Money Concepts (SMC) : The strategy identifies key levels in the market (swing highs and lows) and draws trend lines to visualize potential breakouts. It uses volume analysis to gauge the strength of these breakouts.
Smart Money Breakouts : This part of the strategy incorporates the idea of "Smart Money" – institutional traders who often lead market movements. It looks for breakouts of established levels with significant volume, aiming to catch the beginning of new trends.
How the Strategy Works:
Identification of Key Levels: The script identifies swing highs and swing lows based on a user-defined lookback period. These levels are considered significant points where price has reversed in the past.
Drawing Trend Lines: Trend lines are drawn connecting these key levels, creating a visual representation of potential support and resistance zones.
Volume Analysis: The script analyzes the volume during the formation of these levels and during breakouts. Higher volume suggests stronger moves and increases the probability of a successful breakout.
Entry Conditions:
Long Entry: A long entry is triggered when the price breaks above a resistance line with significant volume, and the moving average trend filter (optional) is bullish.
Short Entry: A short entry is triggered when the price breaks below a support line with significant volume, and the moving average trend filter (optional) is bearish.
Exit Conditions:
Stop Loss: Customizable stop loss percentages are implemented to protect against adverse price movements.
Take Profit: Customizable take profit percentages are used to lock in profits.
Credits and Compliance:
This strategy is inspired by the concepts and code from "Smart Money Concepts (SMC) " and "Smart Money Breakouts ." I've adapted and combined elements of both scripts to create this strategy. Full credit is given to the original authors for their valuable contributions to the TradingView community.
To comply with TradingView's House Rules, I've made the following adjustments:
Clearly Stated Inspiration: The description explicitly mentions the original scripts and authors as the inspiration for this strategy.
No Direct Copying: The code has been modified and combined, not directly copied from the original scripts.
Educational Purpose: The primary purpose of this strategy is for learning and backtesting. It's not intended as financial advice.
Important Note:
This strategy is intended for educational and backtesting purposes only. It should not be used for live trading without thorough testing and understanding of the underlying concepts. Past performance is not indicative of future results.

RSI Chebyshev Pro with Goldilocks Fractals - NR [NPR21]RSI Chebyshev Pro with Goldilocks Fractals - Non-Repaint
CHART INFORMATION
Instrument: /MNQ (Micro E-mini Nasdaq-100 Futures)
Timeframe: 2-minute
Indicator: RSI Chebyshev Pro with Goldilocks Fractals - NR
THE PROBLEM
Standard RSI is too choppy and noisy – it whipsaws all over the place in volatile markets like futures, giving false oversold/overbought signals that burn you on entries. I was sick of missing real reversals or getting stopped out on fakeouts. I wanted something smoother that still catches the big momentum shifts without lagging too much, plus actual market structure to make it more reliable for quick trades.
WHAT MAKES THIS UNIQUE
Unlike basic RSI indicators that use simple moving average smoothing, this combines several advanced techniques that aren't commonly found together:
1. Chebyshev Type I Filtering - Signal processing mathematics (not basic EMAs) that kills noise while keeping real swings sharp. Most RSI smoothing just blurs everything - this keeps responsiveness without the chop.
2. MAMA Adaptive Period - The moving average adapts to actual market cycles using the MESA algorithm, not fixed periods that lag in changing conditions.
3. RSI Pivot Fractals - These aren't price fractals slapped onto RSI. The fractals detect pivots directly on RSI values at extreme levels, with signals appearing back at the exact pivot bar (not current bar), showing you where the actual reversal happened.
4. True Non-Repainting Implementation - Signals appear delayed BUT locked at the historical pivot location forever. What you see in backtests is exactly what appeared live - no vanishing signals, no shifting.
5. All-in-One Integration - Instead of running 3-4 separate indicators (RSI + fractals + patterns + smoothing), everything works together in a single, optimized calculation with confluence built in.
This isn't just RSI with some Williams Fractals thrown on top - it's a complete rethink of how to identify high-probability RSI reversals using signal processing and adaptive algorithms.
ORIGIN & ENHANCEMENTS
Original Source: ChartPrime RSI Chebyshev indicator
Converted & Enhanced by: NPR21
What I Added:
✅ Converted to Pine Script v6 - Made this available to TradingView traders
✅ Goldilocks Fractals - RSI alone doesn't tell you about price structure. These fractals nail those "just right" pivot points where highs/lows confirm. I kept seeing RSI extremes that reversed hard when they lined up with fractals - this was the missing piece for confluence.
✅ 100% Non-Repainting - I've been burned by repainters. You'd backtest something, looks amazing, then live it vanishes or shifts. Lost real money on that. This is rock-solid: signals show delayed but once they're there, they're locked forever. Makes backtesting trustworthy.
✅ Candlestick Patterns - Engulfing, Morning Star, Evening Star detection for confluence
✅ Customizable Visuals - BUY/SELL labels, multiple display styles, full color/size control
✅ Complete Alert System - Get notified on all signal types
HOW IT WORKS
Chebyshev Filtering:
Like putting noise-canceling on your RSI – smooths out jittery ups and downs from random price spikes without flattening into useless lag. It's signal processing math that keeps important swings sharp while killing BS noise. Way better than simple EMA smoothing that blurs everything.
The Components:
Ultra-Smooth RSI - Chebyshev Type I filtering + adaptive MAMA algorithm
Goldilocks Fractals - Pivot detection confirmed after N bars (default 5)
Pattern Recognition - Detects Engulfing, Morning/Evening Star patterns
Visual Styles - Candle Trend (hollow green/solid red) or traditional candles
SIGNAL DELAY vs REPAINTING
✅ THIS HAS SIGNAL DELAY (GOOD) - NOT REPAINTING (BAD)
Signal Delay:
Signals appear after N bars (default 5 bar delay)
Once visible, NEVER disappears or moves
Perfect for backtesting - 100% reliable
What you see in history is what you'd see live
Why the Delay:
To confirm a pivot, we need to see price didn't go lower/higher in the next N bars. This confirmation makes signals reliable. The delay is the price for trustworthy signals.
Want faster? Drop Fractal Periods to 2-3 (more signals, less confirmation).
HOW I TRADE IT
My /MNQ Scalping (1-3 min charts):
LONG: BUY label appears (down fractal + maybe morning star/engulfing) → Check RSI crossing up from oversold (<30) → Confirm with volume → Long with stop below fractal low → Target 1-2R
SHORT: SELL label (up fractal + maybe evening star) → RSI from overbought → Short with stop above
Filter: Only longs in uptrends (watch the MA). Exit partials if momentum fades.
Best Timeframes: 1-5 min for futures scalping. Works on 15 min for swings but for pure scalping, stay under 5 min in high-vol sessions.
SETTINGS I USE
Standard Setup:
Length: 24, Smoothing: 3
Auto MA: ON, Multiplier: 1-2
Fractal Periods: 5 (good confirmation)
Choppy Days:
Smoothing to 5
Aggressive:
Fractal Periods to 3
Pro Tip: Pair with volume or price EMA. Love when fractal BUY + engulfing bull align. Use Candle Trend style. Test on demo first.
KEY SETTINGS
RSI: Length (24), Smoothing (3), Auto MA, Style (Candle/Candle Trend)
Fractals: Periods (5 = more reliable, 3 = faster/riskier), Label colors/sizes, Offsets
Alerts: All signals fire only on confirmed, non-repainting events
DISCLAIMERS
⚠️ Tool, not a complete system - use proper risk management
⚠️ Signals have delay for reliability - not for instant entries
⚠️ Best with price action, volume, other analysis
⚠️ Test on demo before live trading
Questions? Comment below!
NPR21

RSI Chebyshev Pro with Goldilocks Fractals - NR [NPR21]RSI Chebyshev Pro with Goldilocks Fractals - Non-Repaint
----------------------------------------------------------------------------------------------------------------------
CHART INFORMATION
Instrument: /MNQ (Micro E-mini Nasdaq-100 Futures)
Timeframe: 2-minute
Indicator: RSI Chebyshev Pro with Goldilocks Fractals - NR
----------------------------------------------------------------------------------------------------------------------
THE PROBLEM
Standard RSI is too choppy and noisy – it whipsaws all over the place in volatile markets like futures, giving false oversold/overbought signals that burn you on entries. I was sick of missing real reversals or getting stopped out on fakeouts. I wanted something smoother that still catches the big momentum shifts without lagging too much, plus actual market structure to make it more reliable for quick trades.
WHAT MAKES THIS UNIQUE
Unlike basic RSI indicators that use simple moving average smoothing, this combines several advanced techniques that aren't commonly found together:
1. Chebyshev Type I Filtering - Signal processing mathematics (not basic EMAs) that kills noise while keeping real swings sharp. Most RSI smoothing just blurs everything - this keeps responsiveness without the chop.
2. MAMA Adaptive Period - The moving average adapts to actual market cycles using the MESA algorithm, not fixed periods that lag in changing conditions.
3. RSI Pivot Fractals - These aren't price fractals slapped onto RSI. The fractals detect pivots directly on RSI values at extreme levels, with signals appearing back at the exact pivot bar (not current bar), showing you where the actual reversal happened.
4. True Non-Repainting Implementation - Signals appear delayed BUT locked at the historical pivot location forever. What you see in backtests is exactly what appeared live - no vanishing signals, no shifting.
5. All-in-One Integration - Instead of running 3-4 separate indicators (RSI + fractals + patterns + smoothing), everything works together in a single, optimized calculation with confluence built in.
This isn't just RSI with some Williams Fractals thrown on top - it's a complete rethink of how to identify high-probability RSI reversals using signal processing and adaptive algorithms.
ORIGIN & ENHANCEMENTS
Original Source: ChartPrime RSI Chebyshev indicator
Converted & Enhanced by: NPR21
What I Added:
✅ Converted to Pine Script v6 - Made this available to TradingView traders
✅ Goldilocks Fractals - RSI alone doesn't tell you about price structure. These fractals nail those "just right" pivot points where highs/lows confirm. I kept seeing RSI extremes that reversed hard when they lined up with fractals - this was the missing piece for confluence.
✅ 100% Non-Repainting - I've been burned by repainters. You'd backtest something, looks amazing, then live it vanishes or shifts. Lost real money on that. This is rock-solid: signals show delayed but once they're there, they're locked forever. Makes backtesting trustworthy.
✅ Candlestick Patterns - Engulfing, Morning Star, Evening Star detection for confluence
✅ Customizable Visuals - BUY/SELL labels, multiple display styles, full color/size control
✅ Complete Alert System - Get notified on all signal types
HOW IT WORKS
Chebyshev Filtering:
Like putting noise-canceling on your RSI – smooths out jittery ups and downs from random price spikes without flattening into useless lag. It's signal processing math that keeps important swings sharp while killing BS noise. Way better than simple EMA smoothing that blurs everything.
The Components:
Ultra-Smooth RSI - Chebyshev Type I filtering + adaptive MAMA algorithm
Goldilocks Fractals - Pivot detection confirmed after N bars (default 5)
Pattern Recognition - Detects Engulfing, Morning/Evening Star patterns
Visual Styles - Candle Trend (hollow green/solid red) or traditional candles
SIGNAL DELAY vs REPAINTING
✅ THIS HAS SIGNAL DELAY (GOOD) - NOT REPAINTING (BAD)
Signal Delay:
Signals appear after N bars (default 5 bar delay)
Once visible, NEVER disappears or moves
Perfect for backtesting - 100% reliable
What you see in history is what you'd see live
Why the Delay:
To confirm a pivot, we need to see price didn't go lower/higher in the next N bars. This confirmation makes signals reliable. The delay is the price for trustworthy signals.
Want faster? Drop Fractal Periods to 2-3 (more signals, less confirmation).
HOW I TRADE IT
My /MNQ Scalping (1-3 min charts):
LONG: BUY label appears (down fractal + maybe morning star/engulfing) → Check RSI crossing up from oversold (<30) → Confirm with volume → Long with stop below fractal low → Target 1-2R
SHORT: SELL label (up fractal + maybe evening star) → RSI from overbought → Short with stop above
Filter: Only longs in uptrends (watch the MA). Exit partials if momentum fades.
Best Timeframes: 1-5 min for futures scalping. Works on 15 min for swings but for pure scalping, stay under 5 min in high-vol sessions.
SETTINGS I USE
Standard Setup:
Length: 24, Smoothing: 3
Auto MA: ON, Multiplier: 1-2
Fractal Periods: 5 (good confirmation)
Choppy Days:
Smoothing to 5
Aggressive:
Fractal Periods to 3
Pro Tip: Pair with volume or price EMA. Love when fractal BUY + engulfing bull align. Use Candle Trend style. Test on demo first.
KEY SETTINGS
RSI: Length (24), Smoothing (3), Auto MA, Style (Candle/Candle Trend)
Fractals: Periods (5 = more reliable, 3 = faster/riskier), Label colors/sizes, Offsets
Alerts: All signals fire only on confirmed, non-repainting events
DISCLAIMERS
⚠️ Tool, not a complete system - use proper risk management
⚠️ Signals have delay for reliability - not for instant entries
⚠️ Best with price action, volume, other analysis
⚠️ Test on demo before live trading
Questions? Comment below!
NPR21

RSI Chebyshev Pro with Goldilocks Fractals - NR [NPR21]RSI Chebyshev Pro with Goldilocks Fractals - Non-Repaint
==================================================================================
**CHART INFORMATION**
The example chart shown displays:
- Instrument: /MNQ (Micro E-mini Nasdaq-100 Futures)
- Timeframe: 2-minute
- Indicator: RSI Chebyshev Pro with Goldilocks Fractals - NR
==================================================================================
═════════════════════════════════════════════════════════════
THE PROBLEM
Standard RSI is too choppy and noisy – it whipsaws all over the place in volatile markets like futures, giving false oversold/overbought signals that burn you on entries. I was sick of missing real reversals or getting stopped out on fakeouts. I wanted something smoother that still catches the big momentum shifts without lagging too much, plus actual market structure to make it more reliable for quick trades.
═════════════════════════════════════════════════════════════
WHAT MAKES THIS UNIQUE
Unlike basic RSI indicators that use simple moving average smoothing, this combines several advanced techniques that aren't commonly found together:
1. Chebyshev Type I Filtering - Signal processing mathematics (not basic EMAs) that kills noise while keeping real swings sharp. Most RSI smoothing just blurs everything - this keeps responsiveness without the chop.
2. MAMA Adaptive Period - The moving average adapts to actual market cycles using the MESA algorithm, not fixed periods that lag in changing conditions.
3. RSI Pivot Fractals - These aren't price fractals slapped onto RSI. The fractals detect pivots directly on RSI values at extreme levels, with signals appearing back at the exact pivot bar (not current bar), showing you where the actual reversal happened.
4. True Non-Repainting Implementation - Signals appear delayed BUT locked at the historical pivot location forever. What you see in backtests is exactly what appeared live - no vanishing signals, no shifting.
5. All-in-One Integration - Instead of running 3-4 separate indicators (RSI + fractals + patterns + smoothing), everything works together in a single, optimized calculation with confluence built in.
This isn't just RSI with some Williams Fractals thrown on top - it's a complete rethink of how to identify high-probability RSI reversals using signal processing and adaptive algorithms.
═════════════════════════════════════════════════════════════
ORIGIN & ENHANCEMENTS
Original Source: ChartPrime RSI Chebyshev indicator
Converted & Enhanced by: NPR21
What I Added:
✅ Converted to Pine Script v6 - Made this available to TradingView traders
✅ Goldilocks Fractals - RSI alone doesn't tell you about price structure. These fractals nail those "just right" pivot points where highs/lows confirm. I kept seeing RSI extremes that reversed hard when they lined up with fractals - this was the missing piece for confluence.
✅ 100% Non-Repainting - I've been burned by repainters. You'd backtest something, looks amazing, then live it vanishes or shifts. Lost real money on that. This is rock-solid: signals show delayed but once they're there, they're locked forever. Makes backtesting trustworthy.
✅ Candlestick Patterns - Engulfing, Morning Star, Evening Star detection for confluence
✅ Customizable Visuals - BUY/SELL labels, multiple display styles, full color/size control
✅ Complete Alert System - Get notified on all signal types
═════════════════════════════════════════════════════════════
HOW IT WORKS
Chebyshev Filtering:
Like putting noise-canceling on your RSI – smooths out jittery ups and downs from random price spikes without flattening into useless lag. It's signal processing math that keeps important swings sharp while killing BS noise. Way better than simple EMA smoothing that blurs everything.
The Components:
Ultra-Smooth RSI - Chebyshev Type I filtering + adaptive MAMA algorithm
Goldilocks Fractals - Pivot detection confirmed after N bars (default 5)
Pattern Recognition - Detects Engulfing, Morning/Evening Star patterns
Visual Styles - Candle Trend (hollow green/solid red) or traditional candles
═════════════════════════════════════════════════════════════
SIGNAL DELAY vs REPAINTING
✅ THIS HAS SIGNAL DELAY (GOOD) - NOT REPAINTING (BAD)
Signal Delay:
Signals appear after N bars (default 5 bar delay)
Once visible, NEVER disappears or moves
Perfect for backtesting - 100% reliable
What you see in history is what you'd see live
Why the Delay:
To confirm a pivot, we need to see price didn't go lower/higher in the next N bars. This confirmation makes signals reliable. The delay is the price for trustworthy signals.
Want faster? Drop Fractal Periods to 2-3 (more signals, less confirmation).
════════════════════════════════════════════════════════════
HOW I TRADE IT
My /MNQ Scalping (1-3 min charts):
LONG: BUY label appears (down fractal + maybe morning star/engulfing) → Check RSI crossing up from oversold (<30) → Confirm with volume → Long with stop below fractal low → Target 1-2R
SHORT: SELL label (up fractal + maybe evening star) → RSI from overbought → Short with stop above
Filter: Only longs in uptrends (watch the MA). Exit partials if momentum fades.
Best Timeframes: 1-5 min for futures scalping. Works on 15 min for swings but for pure scalping, stay under 5 min in high-vol sessions.
═════════════════════════════════════════════════════════════
SETTINGS I USE
Standard Setup:
Length: 24, Smoothing: 3
Auto MA: ON, Multiplier: 1-2
Fractal Periods: 5 (good confirmation)
Choppy Days: Smoothing to 5
Aggressive: Fractal Periods to 3
Pro Tip: Pair with volume or price EMA. Love when fractal BUY + engulfing bull align. Use Candle Trend style. Test on demo first.
═════════════════════════════════════════════════════════════
KEY SETTINGS
RSI: Length (24), Smoothing (3), Auto MA, Style (Candle/Candle Trend)
Fractals: Periods (5 = more reliable, 3 = faster/riskier), Label colors/sizes, Offsets
Alerts: All signals fire only on confirmed, non-repainting events
═════════════════════════════════════════════════════════════
DISCLAIMERS
⚠️ Tool, not a complete system - use proper risk management
⚠️ Signals have delay for reliability - not for instant entries
⚠️ Best with price action, volume, other analysis
⚠️ Test on demo before live trading
═════════════════════════════════════════════════════════════
Questions? Comment below!
NPR21

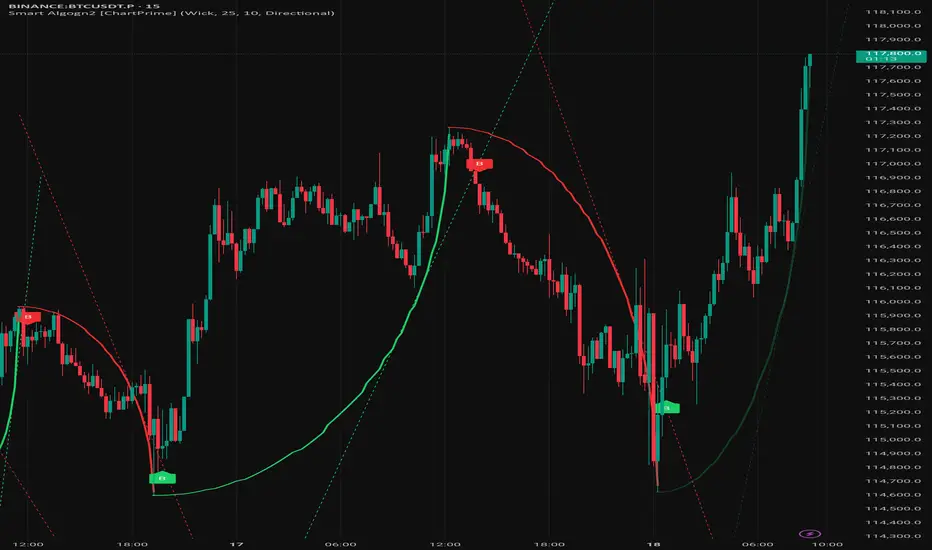
Smart Algogn2 [ChartPrime]Smart Algo indicator with buy/sell signals, optimized for crypto intraday trading.
[LeonidasCrypto]EMA with Volatility GlowEMA Volatility Glow - Advanced Moving Average with Dynamic Volatility Visualization
Overview
The EMA Volatility Glow indicator combines dual exponential moving averages with a sophisticated volatility measurement system, enhanced by dynamic visual effects that respond to real-time market conditions.
Technical Components
Volatility Calculation Engine
BB Volatility Curve: Utilizes Bollinger Band width normalized through RSI smoothing
Multi-stage Noise Filtering: 3-layer exponential smoothing algorithm reduces market noise
Rate of Change Analysis: Dual-timeframe RoC calculation (14/11 periods) processed through weighted moving average
Dynamic Normalization: 100-period lookback for relative volatility assessment
Moving Average System
Primary EMA: Default 55-period exponential moving average with volatility-responsive coloring
Secondary EMA: Default 100-period exponential moving average for trend confirmation
Trend Analysis: Real-time bullish/bearish determination based on EMA crossover dynamics
Visual Enhancement Framework
Gradient Band System: Multi-layer volatility bands using Fibonacci ratios (0.236, 0.382, 0.618)
Dynamic Color Mapping: Five-tier color system reflecting volatility intensity levels
Configurable Glow Effects: Customizable transparency and intensity settings
Trend Fill Visualization: Directional bias indication between moving averages
Key Features
Volatility States:
Ultra-Low: Minimal market movement periods
Low: Reduced volatility environments
Medium: Normal market conditions
High: Increased volatility phases
Extreme: Exceptional market stress periods
Customization Options:
Adjustable EMA periods
Configurable glow intensity (1-10 levels)
Variable transparency controls
Toggleable visual components
Customizable gradient band width
Technical Calculations:
ATR-based gradient bands with noise filtering
ChartPrime-inspired multi-layer fill system
Real-time volatility curve computation
Smooth color gradient transitions
Applications
Trend Identification: Dual EMA system for directional bias assessment
Volatility Analysis: Real-time market stress evaluation
Risk Management: Visual volatility cues for position sizing decisions
Market Timing: Enhanced visual feedback for entry/exit consideration

Moving Average Shift WaveTrend StrategyMoving Average Shift WaveTrend Strategy
🧭 Overview
The Moving Average Shift WaveTrend Strategy is a trend-following and momentum-based trading system designed to be overlayed on TradingView charts. It executes trades based on the confluence of multiple technical conditions—volatility, session timing, trend direction, and oscillator momentum—to deliver logical and systematic trade entries and exits.
🎯 Strategy Objectives
Enter trades aligned with the prevailing long-term trend
Exit trades on confirmed momentum reversals
Avoid false signals using session timing and volatility filters
Apply structured risk management with automatic TP, SL, and trailing stops
⚙️ Key Features
Selectable MA types: SMA, EMA, SMMA (RMA), WMA, VWMA
Dual-filter logic using a custom oscillator and moving averages
Session and volatility filters to eliminate low-quality setups
Trailing stop, configurable Take Profit / Stop Loss logic
“In-wave flag” prevents overtrading within the same trend wave
Visual clarity with color-shifting candles and entry/exit markers
📈 Trading Rules
✅ Long Entry Conditions:
Price is above the selected MA
Oscillator is positive and rising
200-period EMA indicates an uptrend
ATR exceeds its median value (sufficient volatility)
Entry occurs between 09:00–17:00 (exchange time)
Not currently in an active wave
🔻 Short Entry Conditions:
Price is below the selected MA
Oscillator is negative and falling
200-period EMA indicates a downtrend
All other long-entry conditions are inverted
❌ Exit Conditions:
Take Profit or Stop Loss is hit
Opposing signals from oscillator and MA
Trailing stop is triggered
🛡️ Risk Management Parameters
Pair: ETH/USD
Timeframe: 4H
Starting Capital: $3,000
Commission: 0.02%
Slippage: 2 pips
Risk per Trade: 2% of account equity (adjustable)
Total Trades: 224
Backtest Period: May 24, 2016 — April 7, 2025
Note: Risk parameters are fully customizable to suit your trading style and broker conditions.
🔧 Trading Parameters & Filters
Time Filter: Trades allowed only between 09:00–17:00 (exchange time)
Volatility Filter: ATR must be above its median value
Trend Filter: Long-term 200-period EMA
📊 Technical Settings
Moving Average
Type: SMA
Length: 40
Source: hl2
Oscillator
Length: 15
Threshold: 0.5
Risk Management
Take Profit: 1.5%
Stop Loss: 1.0%
Trailing Stop: 1.0%
👁️ Visual Support
MA and oscillator color changes indicate directional bias
Clear chart markers show entry and exit points
Trailing stops and risk controls are transparently managed
🚀 Strategy Improvements & Uniqueness
In-wave flag avoids repeated entries within the same trend phase
Filtering based on time, volatility, and trend ensures higher-quality trades
Dynamic high/low tracking allows precise trailing stop placement
Fully rule-based execution reduces emotional decision-making
💡 Inspirations & Attribution
This strategy is inspired by the excellent concept from:
ChartPrime – “Moving Average Shift”
It expands on the original idea with advanced trade filters and trailing logic.
Source reference:
📌 Summary
The Moving Average Shift WaveTrend Strategy offers a rule-based, reliable approach to trend trading. By combining trend and momentum filters with robust risk controls, it provides a consistent framework suitable for various market conditions and trading styles.
⚠️ Disclaimer
This script is for educational purposes only. Trading involves risk. Always use proper backtesting and risk evaluation before applying in live markets.

Zero-Lag MA Trend FollowingScript Name: Zero-Lag MA Trend Following Auto-Trading
Purpose and Unique Features:
This script is designed to implement a trend-following auto-trading strategy by combining the Zero-Lag Moving Average (ZLMA), Exponential Moving Average (EMA), and ATR Bands. To differentiate it from similar scripts, the following key aspects are emphasized:
Zero-Lag MA (ZLMA):
Responds quickly to price changes, minimizing lag compared to EMA.
Detects crossovers with EMA and generates Diamond Signals to indicate trend reversals.
ATR Bands:
Measures market volatility to set stop-loss levels.
Helps optimize entry points and manage risk effectively.
Diamond Signals:
A vital visual cue indicating the early stages of trend reversals.
Green diamonds signal an uptrend, while red diamonds signal a downtrend.
Each component plays a distinct role, working synergistically to enhance trend detection and risk management. This system doesn’t merely combine indicators but optimizes them for comprehensive trend-following and risk control.
Usage Instructions:
Entry Conditions:
Long Entry:
Enter when a green Diamond Signal appears (ZLMA crosses above EMA).
Short Entry:
Enter when a red Diamond Signal appears (ZLMA crosses below EMA).
Exit Conditions:
Stop Loss:
Set at the lower boundary of the ATR band for BUY or the upper boundary for SELL at entry.
Take Profit:
Automatically executed based on a 1:2 risk-reward ratio.
Account Size: ¥100,0000
Commissions and Slippage: Assumed commission of 90 pips per trade and slippage of 1 pip.
Risk per Trade: 10% of account equity (adjustable based on risk tolerance).
Improvements and Original Features:
While based on open-source code, this script incorporates the following critical enhancements:
Diamond Signals from ZLMA and EMA Integration:
Improves entry accuracy with a proprietary trend detection strategy.
ATR Bands Utilization:
Adds a volatility-based risk management function.
Optimized Visual Entry Signals:
Includes plotted triangles (▲, ▼) to clearly indicate trend-following entry points.
Credits:
This script builds upon indicators developed by ChartPrime, whose innovative approach and insights have enabled a more advanced trend-following strategy. We extend our gratitude for their foundational work.
Additionally, it integrates technical methods based on Zero-Lag Moving Average (ZLMA), EMA, and ATR Bands, leveraging insights from the trading community.
Chart Display Options:
The script offers options to toggle the visual signals (Diamond Signals, trend lines, and entry points) on or off, keeping the chart clean while maximizing analytical efficiency.
Disclaimer:
This script is provided for educational purposes and past performance does not guarantee future results.
Use it responsibly with proper risk management.

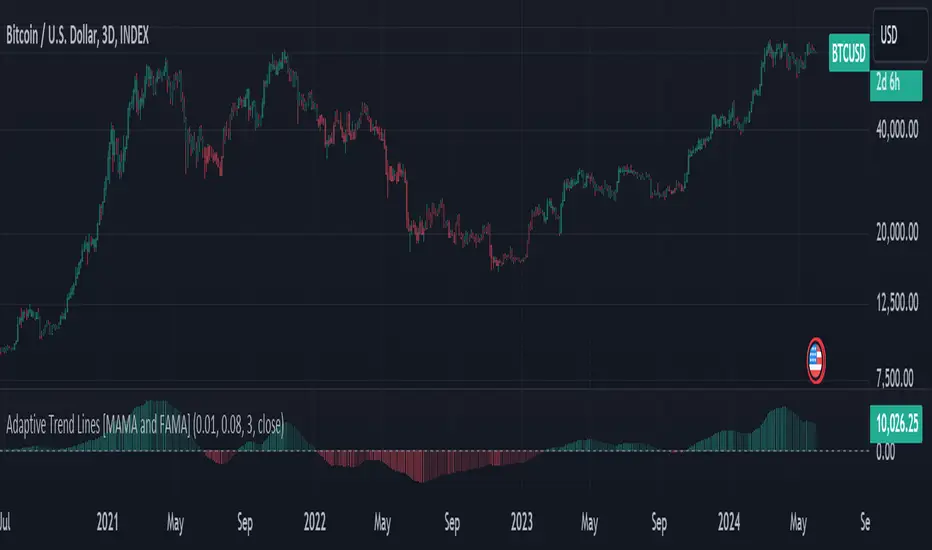
Adaptive Trend Lines [MAMA and FAMA]Updated my previous algo on the Adaptive Trend lines, however I have added new functionalities and sorted out the settings.
You can now switch between normalized and non-normalized settings, the colors have also been updated and look much better.
The MAMA and FAMA
These indicators was originally developed by John F. Ehlers (Stocks & Commodities V. 19:10: MESA Adaptive Moving Averages). Everget wrote the initial functions for these in pine script. I have simply normalized the indicators and chosen to use the Laplace transformation instead of the hilbert transformation
How the Indicator Works:
The indicator employs a series of complex calculations, but we'll break it down into key steps to understand its functionality:
LaplaceTransform: Calculates the Laplace distribution for the given src input. The Laplace distribution is a continuous probability distribution, also known as the double exponential distribution. I use this because of the assymetrical return profile
MESA Period: The indicator calculates a MESA period, which represents the dominant cycle length in the price data. This period is continuously adjusted to adapt to market changes.
InPhase and Quadrature Components: The InPhase and Quadrature components are derived from the Hilbert Transform output. These components represent different aspects of the price's cyclical behavior.
Homodyne Discriminator: The Homodyne Discriminator is a phase-sensitive technique used to determine the phase and amplitude of a signal. It helps in detecting trend changes.
Alpha Calculation: Alpha represents the adaptive factor that adjusts the sensitivity of the indicator. It is based on the MESA period and the phase of the InPhase component. Alpha helps in dynamically adjusting the indicator's responsiveness to changes in market conditions.
MAMA and FAMA Calculation: The MAMA and FAMA values are calculated using the adaptive factor (alpha) and the input price data. These values are essentially adaptive moving averages that aim to capture the current trend more effectively than traditional moving averages.
But Omar, why would anyone want to use this?
The MAMA and FAMA lines offer benefits:
The indicator offers a distinct advantage over conventional moving averages due to its adaptive nature, which allows it to adjust to changing market conditions. This adaptability ensures that investors can stay on the right side of the trend, as the indicator becomes more responsive during trending periods and less sensitive in choppy or sideways markets.
One of the key strengths of this indicator lies in its ability to identify trends effectively by combining the MESA and MAMA techniques. By doing so, it efficiently filters out market noise, making it highly valuable for trend-following strategies. Investors can rely on this feature to gain clearer insights into the prevailing trends and make well-informed trading decisions.
This indicator is primarily suppoest to be used on the big timeframes to see which trend is prevailing, however I am not against someone using it on a timeframe below the 1D, just be careful if you are using this for modern portfolio theory, this is not suppoest to be a mid-term component, but rather a long term component that works well with proper use of detrended fluctuation analysis.
Dont hesitate to ask me if you have any questions
Again, I want to give credit to Everget and ChartPrime!
Code explanation as required by House Rules:
fastLimit = input.float(title='Fast Limit', step=0.01, defval=0.01, group = "Indicator Settings")
slowLimit = input.float(title='Slow Limit', step=0.01, defval=0.08, group = "Indicator Settings")
src = input(title='Source', defval=close, group = "Indicator Settings")
input.float: Used to create input fields for the user to set the fastLimit and slowLimit values.
input: General function to get user inputs, like the data source (close price) used for calculations.
norm_period = input.int(3, 'Normalization Period', 1, group = "Normalized Settings")
norm = input.bool(defval = true, title = "Use normalization", group = "Normalized Settings")
input.int: Creates an input field for the normalization period.
input.bool: Allows the user to toggle normalization on or off.
Color settings in the code:
col_up = input.color(#22ab94, group = "Color Settings")
col_dn = input.color(#f7525f, group = "Color Settings")
Constants and functions
var float PI = math.pi
laplace(src) =>
(0.5) * math.exp(-math.abs(src))
_computeComponent(src, mesaPeriodMult) =>
out = laplace(src) * mesaPeriodMult
out
_smoothComponent(src) =>
out = 0.2 * src + 0.8 * nz(src )
out
math.pi: Represents the mathematical constant π (pi).
laplace: A function that applies the Laplace transform to the source data.
_computeComponent: Computes a component of the data using the Laplace transform.
_smoothComponent: Smooths data by averaging the current value with the previous one (nz function is used to handle null values).
Alpha function:
_computeAlpha(src, fastLimit, slowLimit) =>
mesaPeriod = 0.0
mesaPeriodMult = 0.075 * nz(mesaPeriod ) + 0.54
...
alpha = math.max(fastLimit / deltaPhase, slowLimit)
out = alpha
out
_computeAlpha: Calculates the adaptive alpha value based on the fastLimit and slowLimit. This value is crucial for determining the MAMA and FAMA lines.
Calculating MAMA and FAMA:
mama = 0.0
mama := alpha * src + (1 - alpha) * nz(mama )
fama = 0.0
fama := alpha2 * mama + (1 - alpha2) * nz(fama )
Normalization:
lowest = ta.lowest(mama_fama_diff, norm_period)
highest = ta.highest(mama_fama_diff, norm_period)
normalized = (mama_fama_diff - lowest) / (highest - lowest) - 0.5
ta.lowest and ta.highest: Find the lowest and highest values of mama_fama_diff over the normalization period.
The oscillator is normalized to a range, making it easier to compare over different periods.
And finally, the plotting:
plot(norm == true ? normalized : na, style=plot.style_columns, color=col_wn, title = "mama_fama_diff Oscillator Normalized")
plot(norm == false ? mama_fama_diff : na, style=plot.style_columns, color=col_wnS, title = "mama_fama_diff Oscillator")
Example of Normalized settings:
Example for setup:
Try to make sure the lower timeframe follows the higher timeframe if you take a trade based on this indicator!
Normalized Adaptive Trend Lines [MAMA and FAMA]These indicators was originally developed by John F. Ehlers (Stocks & Commodities V. 19:10: MESA Adaptive Moving Averages). Everget wrote the initial functions for these in pine script. I have simply normalized the indicators and chosen to use the Laplace transformation instead of the hilbert transformation
How the Indicator Works:
The indicator employs a series of complex calculations, but we'll break it down into key steps to understand its functionality:
LaplaceTransform: Calculates the Laplace distribution for the given src input. The Laplace distribution is a continuous probability distribution, also known as the double exponential distribution. I use this because of the assymetrical return profile
MESA Period: The indicator calculates a MESA period, which represents the dominant cycle length in the price data. This period is continuously adjusted to adapt to market changes.
InPhase and Quadrature Components: The InPhase and Quadrature components are derived from the Hilbert Transform output. These components represent different aspects of the price's cyclical behavior.
Homodyne Discriminator: The Homodyne Discriminator is a phase-sensitive technique used to determine the phase and amplitude of a signal. It helps in detecting trend changes.
Alpha Calculation: Alpha represents the adaptive factor that adjusts the sensitivity of the indicator. It is based on the MESA period and the phase of the InPhase component. Alpha helps in dynamically adjusting the indicator's responsiveness to changes in market conditions.
MAMA and FAMA Calculation: The MAMA and FAMA values are calculated using the adaptive factor (alpha) and the input price data. These values are essentially adaptive moving averages that aim to capture the current trend more effectively than traditional moving averages.
But Omar, why would anyone want to use this?
The MAMA and FAMA lines offer benefits:
The indicator offers a distinct advantage over conventional moving averages due to its adaptive nature, which allows it to adjust to changing market conditions. This adaptability ensures that investors can stay on the right side of the trend, as the indicator becomes more responsive during trending periods and less sensitive in choppy or sideways markets.
One of the key strengths of this indicator lies in its ability to identify trends effectively by combining the MESA and MAMA techniques. By doing so, it efficiently filters out market noise, making it highly valuable for trend-following strategies. Investors can rely on this feature to gain clearer insights into the prevailing trends and make well-informed trading decisions.
This indicator is primarily suppoest to be used on the big timeframes to see which trend is prevailing, however I am not against someone using it on a timeframe below the 1D, just be careful if you are using this for modern portfolio theory, this is not suppoest to be a mid-term component, but rather a long term component that works well with proper use of detrended fluctuation analysis.
Dont hesitate to ask me if you have any questions
Again, I want to give credit to Everget and ChartPrime!
