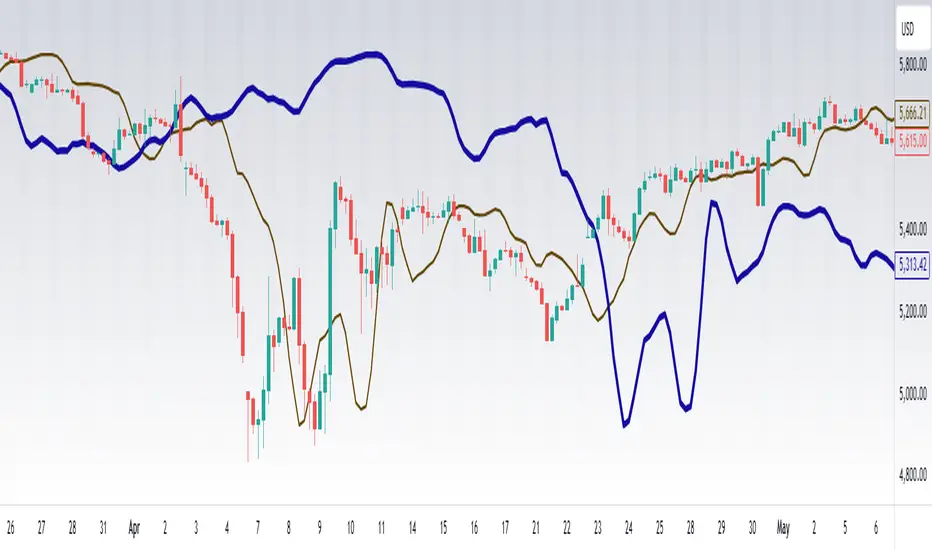
Time Trades 1929The Time Trades script showing key timing elements for the period of 1927-1930, centered around the 1929 crash.
This script includes the following timing elements:
Medium Pivots is a rough 3 month cycle based on the inner planets. This script includes Medium Pivots from 1924-10-01 to 1930-09-30
Small Pivots is a monthly cycle based on the Moon. This script includes Small Pivots from 1926-10-01 to 1929-12-29
Gann Waves is a different monthly cycle based on the Moon. This script includes Gann Waves from 1926-10-01 to 1930-03-29
New lunar signs indicates when the moon enters Aquarius or Leo which tends to be important signs for trend changes. This script includes Aquarius and Leo lunar signs from 1929-04-03 to 1929-12-29
Unlike the Time Trades script for current dates, this script does NOT include:
Cheat Code purple or teal vertical lines
Moon void of course periods as we don't have access to intraday prices in the historical dataset
Lunar aspects as we don't have access to intraday prices in the historical dataset
This script is part of the Time Trades service.
Search in scripts for "Cycle"
VHF Adaptive Fisher Transform [Loxx]VHF Adaptive Fisher Transform is an adaptive cycle Fisher Transform using a Vertical Horizontal Filter to calculate the volatility adjusted period.
What is VHF Adaptive Cycle?
Vertical Horizontal Filter (VHF) was created by Adam White to identify trending and ranging markets. VHF measures the level of trend activity, similar to ADX DI. Vertical Horizontal Filter does not, itself, generate trading signals, but determines whether signals are taken from trend or momentum indicators. Using this trend information, one is then able to derive an average cycle length.
What is Fisher Transform?
The Fisher Transform is a technical indicator created by John F. Ehlers that converts prices into a Gaussian normal distribution.
The indicator highlights when prices have moved to an extreme, based on recent prices. This may help in spotting turning points in the price of an asset. It also helps show the trend and isolate the price waves within a trend.
Included:
Zero-line and signal cross options for bar coloring
Customizable overbought/oversold thresh-holds
Alerts
Signals
Bitcoin Price Temperature: Weekly TimeframeUse this oscillator at weekly timeframes:
The Bitcoin Price Temperature (BPT) is an oscillator that models the number of standard deviations the price has moved away from the 4-yr moving average. This seeks to establish a mean reversion model based on the cyclical nature of Bitcoin halving and investment cycles. The BPT bands then establish price levels that coincide with specific standard deviation multiples to identify fair and extreme valuations.
Coined By:
DilutionProof
Interpretation:
Values above 6 indicate extremely high price areas: (TOP OF THE MARKET)
Areas below 0.2 indicate extremely low price areas: (BOTTOM OF THE MARKET)
2π Indicator including Prediction-FeaturePI Cycle indicator is very good on finding potential tops.
PI cycle uses the 350MA/111MA which equals around 3,14
Using the 700MA its very obvious that we can spot potential Bottoms.
We are also using the 111MA, so 700MA/111MA equals to 6,30 which is ~ 2π.
I also built in a Prediction feature so we could speculate on a potential Bottom in the future.
Obviously the prediction might change over time if price is more volatily it changes the outcome.
Use Daily chart for best results.
Bitcoin Daily Support/ResistanceA new indicator for tradingview.
Indicator Overview
The 2-Year MA Multiplier is intended to be used as a long term investment tool.
It highlights periods where buying or selling Bitcoin during those times would have produced outsized returns.
To do this, it uses a moving average (MA) line, the 2yr MA, and also a multiplication of that moving average line, 2yr MA x5.
Note: the x5 multiplication is of the price values of the 2yr moving average, not of its time period.
Buying Bitcoin when price drops below the 2yr MA (green line) has historically generated outsized returns. Selling Bitcoin when price goes above the 2yr MA x 5 (red line) has been historically effective for taking profit.
Why This Happens
As Bitcoin is adopted, it moves through market cycles. These are created by periods where market participants are over-excited causing the price to over-extend, and periods where they are overly pessimistic where the price over-contracts. Identifying and understanding these periods can be beneficial to the long term investor.
This tool is a simple and effective way to highlight those periods
MA 50/100/150 was historically good support and resistance. When we cross them we have a new trend that is established.
Cyclical bands v1This indicator is the evolution of the Bollinger bands, but adapted to our philosophy of cyclicality!
Highlight the excesses of the cycles.
Its construction is based on our centered medium design.
It works great when paired with our Cyclical Volatility Index indicator.
This fantastic indicator can be set at will!
It is possible to set the bands based on a variation of the standard deviation or percentage!
The bands are dual zones, in the sense that each band can be configured independently from the other, for example:
upper band% variation + 20
lower band% variation +15
For any bugs contact the creators
Bitcoin Cycle Top IndicatorBitcoin Cycle Top Indicator on the 1W Bitcoin Logarithmic chart.
Called all 3 tops so far to a T, this indicator will be great use for the next upcoming cycle.
I kept it sweet and simple, no need to overcomplicate. That's all this indicator does.
HurstCycles PeaksOnly way I found to plot hurst cycles. I gave up on anything other than daily chart.
Published on request.
HurstCycles ThroughsOnly way I found to plot hurst cycles. I gave up on anything other than daily chart.
Published on request.
"Cycling Willy" Indicator very good tbuy/sell/trend signals!This oscillator is based on the williams%R combined with EMA's for better signals. it shows momentum and ob/os signals and indicates market cycles.
you can switch between the two EMA's for more direct or filtered signals and smooth the %R if needed.
i added 4 alertconditions to be triggered on crossovers of signal EMA and Filter EMA.
please let me know in the comments what you think about the indicator!!
happy trading!
Advanced ICC Multi-Timeframe 1.0Advanced ICC Multi-Timeframe Trading System
A comprehensive implementation and interpretation of the Indication, Correction, Continuation (ICC) trading methodology made popular by Trades by Sci, enhanced with advanced multi-timeframe analysis and automation features.
⚠️ CRITICAL TRADING WARNINGS:
DO NOT blindly follow BUY/SELL signals from this indicator
This indicator shows potential entry points but YOU must validate each trade
PAPER TRADE EXTENSIVELY before risking real capital
BACKTEST THOROUGHLY on your chosen instruments and timeframes
The ICC methodology requires understanding and discretion - automated signals are guidance only
This tool aids analysis but does not replace proper trade planning, risk management, or trader judgment
⚠️ Important Disclaimers:
This indicator is not endorsed by or affiliated with Trades by Sci
This is an early implementation and interpretation of the ICC methodology
May not work exactly as Trades by Sci executes his trades and entries
Requires further debugging, backtesting, and real-world validation
Completely free to use - no purchase required
I'm just one person obsessed with this method and wanted some better visualization of the chart/entries
About ICC:
The ICC method identifies complete market cycles through three phases: Indication (breakout), Correction (pullback), and Continuation (entry). This indicator automates the identification of these phases and adds powerful features for modern traders.
Key Features:
Multi-Timeframe Capabilities:
Automatic timeframe detection with optimized settings for 5m, 15m, 30m, 1H, 4H, and Daily charts
Higher timeframe overlay to view HTF ICC levels on lower timeframe charts for precise entry timing
Smart defaults that adjust swing length and consolidation detection based on your timeframe
Advanced Phase Tracking:
Complete ICC cycle tracking: Indication, Correction, Consolidation, Continuation, and No Setup phases
Live structure detection shows potential peaks/troughs before full confirmation
Intelligent invalidation logic detects failed setups when market structure reverses
Dynamic phase backgrounds for instant visual confirmation
Three Types of Entry Signals:
Traditional Entries - Price crosses back through the original indication level (strongest signals)
"BUY" (green) / "SELL" (red)
Breakout Entries - Price breaks out of consolidation range in the same direction
"BUY" (green) / "SELL" (red)
Reversal Entries (Optional, can be toggled off) - Price breaks consolidation in opposite direction, indicating failed setup
"⚠ BUY" (yellow) / "⚠ SELL" (orange)
More aggressive, counter-trend signals
Can be disabled for more conservative trading
Professional Features:
Volatility-based support/resistance zones (ATR-adjusted) that adapt to market conditions
Historical zone tracking (0-3 configurable) with visual hierarchy
Comprehensive real-time info table displaying all key metrics
Full alert system for entries, indications, and consolidation detection
Visual distinction between high-confidence trend entries and cautionary reversal entries
📖 USAGE GUIDE
Entry Signal Types:
The indicator provides three types of entry signals with visual distinction:
Strong Entries (High Confidence):
"BUY" (bright green) / "SELL" (bright red)
Includes traditional entries (crossing back through indication level) and breakout entries (breaking consolidation in trend direction)
These are trend continuation or breakout signals with higher probability
Recommended for all traders
Reversal Entries (Caution - Counter-Trend):
"⚠ BUY" (yellow) / "⚠ SELL" (orange)
Triggered when price breaks out of correction/consolidation in the OPPOSITE direction
Indicates a failed setup and potential trend reversal
More aggressive, counter-trend plays
Can be toggled off in settings for more conservative trading
Recommended only for experienced traders or after thorough backtesting
Swing Length Settings:
The swing length determines how many bars on each side are needed to confirm a swing high/low. This is the most important setting for tuning the indicator to your style.
Auto Mode (Recommended for beginners): Toggle "Use Auto Timeframe Settings" ON
5-minute: 30 bars
15-minute: 20 bars
30-minute: 12 bars
1-hour: 7 bars
4-hour: 5 bars
Daily: 3 bars
Manual Mode: Toggle "Use Auto Timeframe Settings" OFF
Lower values (3-7): More aggressive, detects smaller swings
Pros: More signals, faster entries, catches smaller moves
Cons: More noise, more false signals, requires tighter stops
Best for: Scalping, active day trading, volatile markets
Higher values (12-20): More conservative, only major swings
Pros: More reliable signals, fewer false breakouts, clearer structure
Cons: Fewer signals, delayed entries, might miss smaller opportunities
Best for: Swing trading, position trading, trending markets
Default Manual Setting: 7 bars (balanced for 1H charts)
Minimum: 3 bars
Consolidation Bars Setting:
Determines how many bars without new structure are needed before flagging consolidation.
Lower values (3-10): Faster detection, catches brief pauses, more sensitive
Best for: Lower timeframes, volatile markets, avoiding any chop
Higher values (20-40): More reliable, only flags true extended consolidation
Best for: Higher timeframes, trending markets, patient traders
Current defaults scale with timeframe (more bars needed on shorter timeframes)
Historical S/R Zones:
Shows previous support and resistance levels to provide context.
Default: 2 historical zones (shows current + 2 previous)
Range: 0-3 zones
Visual Hierarchy: Older zones are more transparent with dashed borders
Usage: Higher numbers (2-3) show more historical context but can clutter the chart. Start with 2 and adjust based on your preference.
Live Structure Feature (Yellow Warning ⚠):
Provides early warning of potential structure changes before full confirmation.
What it does: Detects potential swing highs/lows after just 2 bars instead of waiting for full swing_length confirmation
Live Peak: Shows when a high is followed by 2 lower closes (potential top forming)
Live Trough: Shows when a low is followed by 2 higher closes (potential bottom forming)
Important: These are UNCONFIRMED - they may be invalidated if price reverses
Use case: Get early awareness of potential reversals while waiting for confirmation
Displayed in: Info table only (no visual markers on chart to reduce clutter)
Only shows: Peaks higher than last swing high, or troughs lower than last swing low (filters out noise)
Higher Timeframe (HTF) Analysis:
View higher timeframe ICC structure while trading on lower timeframes.
How to enable: Toggle "Show Higher Timeframe ICC" ON
Setup: Set "Higher Timeframe" to your reference timeframe
Example: Trading on 15-minute? Set HTF to 240 (4-hour) or 60 (1-hour)
Example: Trading on 5-minute? Set HTF to 60 (1-hour) or 15 (15-minute)
What it shows:
HTF indication levels displayed as dashed lines
Blue = HTF Bullish Indication
Purple = HTF Bearish Indication
HTF phase and levels shown in info table
Trading workflow:
Check HTF phase for overall market direction
Wait for HTF correction phase
Drop to lower timeframe to find precise entries
Enter when lower TF shows continuation in alignment with HTF
Best practice: HTF should be 3-4x your trading timeframe for best results
Reversal Entries Toggle:
Default: ON (shows all signal types)
Toggle OFF for more conservative trading (only trend continuation signals)
Recommended: Backtest with both settings to see which works better for your style
New traders should consider disabling reversal entries initially
Volatility-Based Zones:
When enabled, support/resistance zones automatically adjust their height based on ATR (Average True Range).
More volatile = wider zones
Less volatile = tighter zones
Toggle OFF for fixed-width zones
Community Feedback Welcome:
This is an evolving project and your input is valuable! Please share:
Bug reports and issues you encounter
Feature requests and suggestions for improvement
Results from your backtesting and live trading experience
Feedback on the reversal entry feature (too aggressive? working well?)
Ideas for better aligning with the ICC methodology
Perfect for traders learning or implementing the ICC methodology with the benefit of modern automation, multi-timeframe analysis, and flexible entry signal options.
Advanced Time TechniqueAdvanced Time Technique (ATT)
The Advanced Time Technique (ATT) identifies mathematically significant price levels based on candle count sequences within higher timeframes. The indicator tracks specific numerical patterns to project potential reversal zones.
Calculation Methodology:
- Monitors candle cycles in user-selected higher timeframes (1H, 2H, 3H)
- Identifies key candle counts: 3, 11, 17, 29, 41, 47, 53, 59
- Projects these counts as visual markers on the current chart
- Uses pure price action without lagging indicators
Key Features:
- HTF Candle Boxes: Displays higher timeframe candle ranges as colored boxes
- ATT Circles: Places circular markers at specified candle counts
- Multi-timeframe Analysis: References 1-hour, 2-hour, or 3-hour timeframes
- Prediction Labels: Shows upcoming ATT levels within user-defined range
- Historical Display: Optional viewing of past ATT markers
Visual Components:
- Colored boxes representing HTF candle ranges (bullish/bearish)
- Circle markers positioned above/below bars based on candle color
- Optional numerical display on ATT circles
- Customizable colors and transparency settings
Trading Applications:
- Identifies potential reversal zones at mathematically significant intervals
- Highlights liquidity concentration areas
- Useful for intraday and scalp trading strategies
- Complements price action and market structure analysis
The indicator works by counting candles within the selected higher timeframe and marking specific numerical sequences where price reactions commonly occur.
Crypto Compass | QuantEdgeBIntroducing Crypto Compass | QuantEdgeB
Overview
Crypto Compass | QuantEdgeB is a multi-asset market regime indicator that decodes the collective momentum and sentiment of the cryptocurrency space. By computing correlation-adjusted valuation across a basket of major tokens and blending them with the chart’s own momentum pulse, it delivers a real-time “compass” of risk-on/off regimes. Plotted as dual EMAs and color-coded candles, and accompanied by a comprehensive dashboard table, Crypto Compass guides traders through broad market cycles instead of isolated price swings.
Key Features
• Correlation-Adjusted Valuation Aggregation
Computes individual valuation for the top 30 Market Cap tokens plus total-market indices; weights each by its correlation to Bitcoin, then averages.
• Large-Cap-Only Mode
Optionally restricts the basket to the top 10 by market cap for a streamlined “blue-chip” sentiment readout.
• Composite Momentum Blend
Mixes the basket average with the chart’s own valuation to capture both cross-asset and local momentum.
• Dual EMA Overlay & Candle Coloring
Plots 12- and 21-period EMAs colored by the composite valuation gradient; candles are likewise color-filled to reflect regime strength.
• Interactive Dashboard Table
Live “Crypto Compass Dashboard” shows, for each asset:
o Current value & prior bar value
o Rate of Change (direction arrow)
o Duration since last EMA crossover
o Current trend state (“Bullish” / “Bearish”)
• Regime Labels & Risk-On/Off Signal
Translates the composite valuation into four regimes—Contraction, Weak, Recovery, Strong—with a clear risk-on/off indicator banner.
How It Works
1. Data Fetch & Valuation Computation
o Retrieves price and a simple TPI (12 vs 21 EMA cross) for each symbol via request.security.
o Calculates a rolling standard deviation over a lookback (length) for each asset and the chart.
2. Correlation Weighting
o Measures each asset’s correlation to Bitcoin
o Multiplies each asset’s value by its correlation coefficient to emphasize high-beta relationships.
3. Basket Averaging
o Averages the top-N weighted value (10 if “Large Cap Only” is true, else all )
o Blends the final average with the chart’s own valuation
4. Visual & Table Overlays
o EMAs (12, 21) and candles are colored via a gradient tied to zsumad thresholds.
o A table grid at the bottom-right displays per-asset metrics and computes duration since TPI crossovers to flag trend longevity.
5. Regime Mapping
≤ –1.5 ⇒ Contraction (Risk Off)
–1.5 to 0 ⇒ Weak (Risk Off)
0 to 1.5 ⇒ Recovery (Risk On)
1.5 ⇒ Strong (Risk On)
How to Use / Who Should Use It
• Crypto Portfolio Managers seeking a holistic market-wide directional bias before allocating capital.
• Swing & Position Traders looking to confirm if cross-asset strength aligns with their primary coin.
• Systematic Strategy Developers integrating regime filters into algorithmic models.
• Risk-Conscious Allocators wanting an early warning on risk-off contractions vs. risk-on expansions.
Default Settings
• Plot EMA: On
• Value Lookback Length: 90
• BTC Correlation Length: 195
• Large Cap Only: True
Conclusion
Crypto Compass distills complex cross-asset dynamics into a single, actionable gauge. By combining correlation-weighted valuation, blended momentum, and dynamic regime mapping—visualized through color-coded EMAs, candles, and a rich dashboard—it empowers traders to navigate the broader crypto market cycle with clarity and confidence.
🔹 Disclaimer: Past performance is not indicative of future results. No trading strategy can guarantee success in financial markets.
🔹 Strategic Advice: Always backtest, optimize, and align parameters with your trading objectives and risk tolerance before live trading.
2-Year MA Multiplier [UAlgo]The 2-Year MA Multiplier is a technical analysis tool designed to assist traders and investors in identifying potential overbought and oversold conditions in the market. By plotting the 2-year moving average (MA) of an asset's closing price alongside an upper band set at five times this moving average, the indicator provides visual cues to assess long-term price trends and significant market movements.
🔶 Key Features
2-Year Moving Average (MA): Calculates the simple moving average of the asset's closing price over a 730-day period, representing approximately two years.
Visual Indicators: Plots the 2-year MA in forest green and the upper band in firebrick red for clear differentiation.
Fills the area between the 2-year MA and the upper band to highlight the normal trading range.
Uses color-coded fills to indicate overbought (tomato red) and oversold (cornflower blue) conditions based on the asset's closing price relative to the bands.
🔶 Idea
The concept behind the 2-Year MA Multiplier is rooted in the cyclical nature of markets, particularly in assets like Bitcoin. By analyzing long-term price movements, the indicator aims to identify periods of significant deviation from the norm, which may signal potential buying or selling opportunities.
2-year MA smooths out short-term volatility, providing a clearer view of the asset's long-term trend. This timeframe is substantial enough to capture major market cycles, making it a reliable baseline for analysis.
Multiplying the 2-year MA by five establishes an upper boundary that has historically correlated with market tops. When the asset's price exceeds this upper band, it may indicate overbought conditions, suggesting a potential for price correction. Conversely, when the price falls below the 2-year MA, it may signal oversold conditions, presenting potential buying opportunities.
🔶 Disclaimer
Use with Caution: This indicator is provided for educational and informational purposes only and should not be considered as financial advice. Users should exercise caution and perform their own analysis before making trading decisions based on the indicator's signals.
Not Financial Advice: The information provided by this indicator does not constitute financial advice, and the creator (UAlgo) shall not be held responsible for any trading losses incurred as a result of using this indicator.
Backtesting Recommended: Traders are encouraged to backtest the indicator thoroughly on historical data before using it in live trading to assess its performance and suitability for their trading strategies.
Risk Management: Trading involves inherent risks, and users should implement proper risk management strategies, including but not limited to stop-loss orders and position sizing, to mitigate potential losses.
No Guarantees: The accuracy and reliability of the indicator's signals cannot be guaranteed, as they are based on historical price data and past performance may not be indicative of future results.
Session OHLC [neo.|]OHLC/OLHC and Po3 (Power of Three by ICT) are both concepts describing a potential way to describe candle formations. While OHLC stands for Open High Low Close, what it usually refers to is the bearish scenario of how a candle first opens, manipulates until the high then creates the low before closing, and vice versa for OLHC. Po3 goes hand in hand with this concept as a way to sequentialize this candle formation into three separate cycles seen on a lower timeframe known as "Accumulation", "Manipulation", and "Distribution". Where the accumulation in the OHLC scenario would be the range created before the high, the manipulation being the high, and the distribution being the run downwards to the low.
What Session OHLC allows you to do, is to view these Po3 scenarios not through a higher timeframe candle perspective, but instead through a fully customizable session perspective. For example, you might want to see a specific period of time as a candle to simplify the process of identifying an AMD cycle, and all you would need to do is to enter that period of time in the indicator settings, and when you are at that period of time, you will see it being represented as a bar candle, with the session open, high, low, and close being annotated as O, H, L, and C.
This is especially useful for when you want to track the manipulation before a session open, or track a specific time where there is more volume in the market, allowing you to enter trades prior to when a distribution phase will begin.
Currently, you are able to select up to 4 different sessions that will appear on your chart while the session is active, however it is a good idea for the session times you choose not to overlap as the drawings will overlap as well. If you would like to monitor two times that happen to overlap, it is a good idea to add another instance of the indicator to your chart, and adjust the bar offset on one of them in the settings.
Ehlers Modified Relative Strength Index [CC]The Modified Relative Strength Index was created by John Ehlers (Cycle Analytics For Traders pgs 87-88) and this is a typical RSI that uses his roofing filter as the input. He smooths it with his own super smoother filter to provide signals. This indicator is extremely reactive and works in cycles so keep that in mind. I haven't been able to come up with clear buy and sell signals at this point so let me know if you any suggestions but I'm publishing the code to complete my goal of publishing all of his work one day. I will be publishing a bunch of Ehlers scripts in the next few weeks so stay tuned. What I recommend for buy and sell signals at this point are to buy when the indicator goes below the oversold line and starts going up and sell when the indicator goes below the oversold line a second time. Vice versa for sell signals.
Let me know if there are any other scripts you would like to see me publish!
Financial Astrology Venus LongitudeVenus energy influence the affections, beauty, passion, arts, festivities, finance, marriage, speculation. As a traders the Venus cycle will determine the affection, love and interest we manifest for specific industries that we perceive more fascinating and seductive for our speculation purposes. Financial astrologer Bill Meridian suggest that Venus rules the industries of "recreation, cosmetics, fashion, leisure".
Personally I believe that the affection to hold shares within specific industries will be determined by the zodiac sign position of Venus. For example, Venus in Aries will rule sports, war industry, high risk and volatility, in Taurus the land, agriculture, cattle raising, banks, exchanges and and desire for stability, in Gemini the mass media, newspapers, marketing, publishing house, conferences and desire to discuss the trending topics, in Cancer the real state, bars and restaurants, fishing and so forth with the standard zodiac sign industries rulership. Therefore, traders will feel more affection for the industries / emotional behavior ruled by the sign that Venus is transiting. Therefore, as Venus transition to other signs that are incompatible with an industry characteristics, that desire to hold shares in a given industry would diminish.
Within the financial astrology research we have identified that the BTCUSD bullish Venus zodiac signs are: Aries, Gemini, Leo, Virgo, Scorpio, Aquarius and Pisces. The bearish signs are: Taurus, Cancer, Libra and Capricorn. The other signs show mixed results. As expected, Aquarius was a prominent position due to the fact that represent "technology and innovation", Pisces seem very relevant because represent the destruction of the previous model, the end of the traditional banks financial system in favor of the decentralized finances (DeFI) approach. Aries, because is the entrepreneurship spirit of the new opportunities that arise with this financial system transition where masses are willing to start trying, exploring and taking risks (adventures) in this alternative way to manage and storing your assets. Leo because cryptocurrencies is the new tech fashion and hot speculation area. Virgo because it provide a perfect immutable decentralised database (the blockchain) that couldn't be altered or manipulated so is precise and exact financial system that correlate well with the precision and exactness affection we feel within Virgo influence.
With this indicator there is unlimited possibilities to explore across different markets to strudy how the Venus energy influence plays out, no more manual chart annotations to identify the zodiac sign location of Venus. We encourage you to analyze this zodiac sign cycles in different markets and share with us your observations, leave us a comment with your research outcomes. Happy research!
Note: The Venus tropical longitude indicator is based on an ephemeris array that covers years 2010 to 2030, prior or after this years the longitude is not available, this daily ephemeris are based on UTC time so in order to align properly with the price bars times you should set UTC as your chart reference timezone.
Ehlers Sinewave Indicator V2 [CC]The Sinewave Indicator was created by John Ehlers (Cybernetic Analysis For Stocks And Futures pgs 154-155) and this is an updated version of his original Sinewave Indicator which in my opinion seems to be more reactive to changes. Buy when the blue line crosses over the red line and sell when the blue line crosses under the red line. Also keep in mind that this indicator is based on cycles so it won't act the same as a typical indicator.
Let me know if there are other scripts you would like to see me publish or if you want something custom done!
Bitcoin: Price Action Integral BandsThis indicator tries to display absolute tops and bottoms for Bitcoin. The price action gets integrated with two custom functions resulting in the blue top and red bottom price action integrals. From those integral values we allow 5% deviation in up and down direction, leading to price action integral bands of some non-zero width.
Even in the current liquidity crisis with abnormal price movements, Bitcoin had no weekly candle close below the support band. One thing to note is that in the here presented model, up until now only one single weekly candle touches the blue band in each of Bitcoin's cycles. For longer-term trades it might be a good idea to buy BTC when price is around the red band, and sell/go short when BTC is around the blue band, although this is no financial advice and one should always cross-check with other indicators/informations.
There's the option to plot or hide the bands individually.
The integral bands are specifically designed for the Bitcoin BLX (BraveNewCoin Liquid Index) ticker on weekly timeframe. For other assets, tickers and timeframes the functionality of this indicator cannot be guaranteed and will most probably not deliver meaningful results.
TOP & BOTTOM Cycle [aamonkey]Works best on BTC and only on the daily timeframe!
This is a TOP / BOTTOM indicator for big market cycles.
These tops and bottoms are based on the difference between the 200MA on the daily and the price.
Recursive StochasticThe Self Referencing Stochastic Oscillator
The stochastic oscillator bring values in range of (0,100). This process is called Feature scaling or Unity-Based Normalization
When a function use recursion you can highlights cycles or create smoother results depending on various factors, this is the goal of a recursive stochastic.
For example : k = s(alpha*st+(1-alpha)*nz(k )) where st is the target source.
Using inputs with different scale level can modify the result of the indicator depending on which instrument it is applied, therefore the input must be normalized, here the price is first passed through a stochastic, then this result is used for the recursion.
In order to control the level of the recursion, weights are distributed using the alpha parameter. This parameter is in a range of (0,1), if alpha = 1, then the indicator act as a normal stochastic oscillator, if alpha = 0, then the indicator return na since the initial value for k = 0. The smaller the alpha parameter, the lower the correlation between the price and the indicator, but the indicator will look more periodic.
Comparison
Recursive Stochastic oscillator with alpha = 0.1 and bellow a classic oscillator (alpha = 1)
The use of recursion can both smooth the result and make it more reactive as well.
Filter As Source
It is possible to stabilize the indicator and make it less affected by outliers using a filter as input.
Lower alpha can be used in order to recover some reactivity, this will also lead to more periodic results (which are not inevitably correlated with price)
Hope you enjoy
For any questions/demands feel free to pm me, i would be happy to help you
Spooky Time (10/31/25) [VTB]Get ready to add some eerie fun to your charts this Halloween! "Spooky Time" is a lighthearted indicator that draws a festive, animated Halloween scene right on your TradingView chart. Perfect for traders who want to celebrate the spooky season without missing a beat on the markets. Whether you're analyzing stocks, crypto, or forex, this overlay brings a touch of holiday spirit to your setup.
#### Key Features:
- **Jack-o'-Lantern Pumpkin**: A detailed, glowing pumpkin with carved eyes, nose, and a jagged mouth. The eyes and mouth cycle through black (off), yellow, and red glows for a subtle animation effect, giving it that classic haunted vibe.
- **Flickering Candle**: A wax candle with a wick and an animated flame that shifts positions slightly across three frames, mimicking a real flickering light. The flame color changes between yellow, red, and orange for added dynamism.
- **Spider Web and Spider**: A spiral web with radial lines, complete with a creepy-crawly spider. The spider's legs animate with small movements, as if it's ready to pounce—perfect for that extra spooky touch!
- **Customization Options**: Toggle the "Desiringmachine" label on/off, choose its position on the chart (e.g., Bottom Center), and select the text color. The entire scene is positioned relative to the chart's open price and ATR for better scaling.
- **Animation Cycle**: The whole setup uses a simple 3-frame animation based on bar_index, making it feel alive without overwhelming your chart.
This indicator is purely visual and non-intrusive—it doesn't plot any trading signals or data, so it won't interfere with your strategies. Just add it to your chart for some Halloween cheer during your trading sessions!
**Date Note**: Timed for Halloween 2025 (10/31/25)—feel the spooky energy!
**Happy Halloween!!!** 🎃👻🕸️
Seasonality Forecast 4H A seasonality indicator shows recurring patterns in data that occur at the same time each year, such as retail sales peaking during the holidays or demand for ice cream rising in the summer. These indicators are used in fields like business, economics, and finance to identify predictable, time-based fluctuations, allowing for better forecasting and strategic planning, like adjusting inventory or staffing levels. In trading, a seasonality indicator can show historical patterns, like an asset's tendency to rise or fall in a specific month, to provide additional context for decision-making.
Seasonality reasoning basically seasonality works most stably on the daily frame with the input parameter being trading day 254 or calendar day 365, ..
Use seasonal effects such as sell in May, buy Christmas season, or exploit factors such as sell on Friday, ... to track the price movement.
The lower the time frame, the more parameters need to be calculated and the more complicated. I have tried to code the version with 1 hour, 15 minutes and 4 hours time frames
On the statistical language R and Python, Pine script
Tradingview uses the exclusive and unique Pine language. There is a parameter limit, just need to change the number of forecast days or calculate shorter or only calculate the basic end time value, we seasonality still works
but the overall results are easily noisy and related to controlling the number of orders per week/month and risk management.
The 4-hour frame version works well because we exploit the seasonal factor according to the 4-hour trading session as a trading session
Every 4 hours we have an input value that corresponds to the Asian, European, and American trading sessions
4 hours - half a morning Asian session.4 hours - half an afternoon Asian session, 4 hours - half a morning European session, 4 hours - half an afternoon European session, similar to the US and repeat the cycle.
Input Parameter Declaration
Tradingview does not exist declaration form day_of_year = dayofyear(time) Pine Script v5:
Instead of using dayofyear, we manually calculate the number of days in a year from the time components.
// Extract year, month, day, hour
year_now = year(time)
month_now = month(time)
day_now = dayofmonth(time)
hour_now = hour(time)
// Precomputed cumulative days per month (non-leap year)
days_before_month = array.from(0, 31, 59, 90, 120, 151, 181, 212, 243, 273, 304, 334)
// Calculate day-of-year
day_of_year = array.get(days_before_month, month_now - 1) + day_now
Input parameter customization window
Lookback period years default is 10, max - the number of historical bars we have, should only be 5 years, 10 years, 15 years, 20 years, 30 years.
Future project bar default is 180 bars - 1 month. We can adjust arbitrarily 6*24*254 - day/month/year
smoothingLength Smooth the data (1 = no smoothing)
offsetBars Move the forecast line left/right to check the past
How to use
Combine seasonality with Supply Demand, Footprint volume profile to find long-term trends or potential reversal points
day_of_year := day_of_year + ((is_leap and month_now > 2) ? 1 : 0)
// Compute bin index
binIndex = (day_of_year * sessionsPerDay) + math.floor(hour_now / 4)
binIndex := binIndex % binsPerYear // Keep within array bounds
The above is the manual code to replace day of year


