Search in scripts for "Fractal"
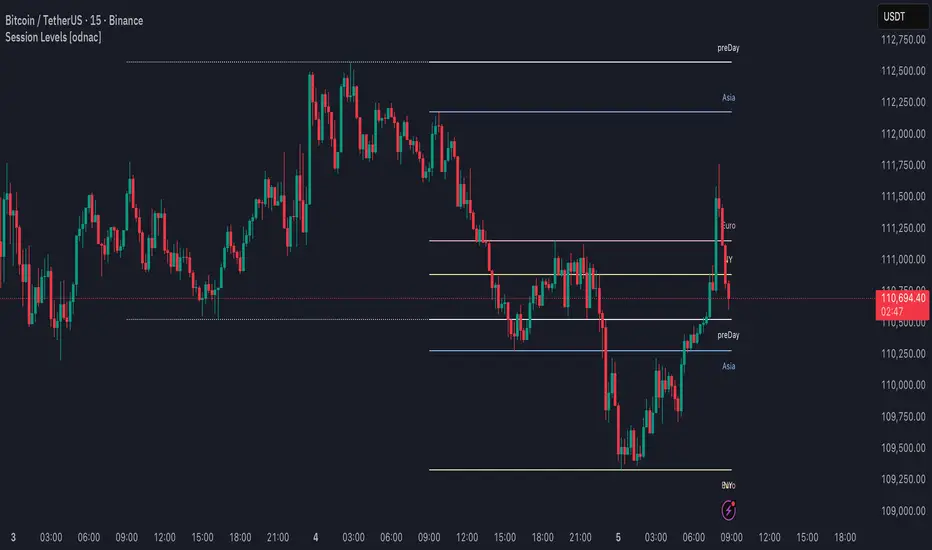
Session Levels [odnac]This indicator plots the high and low levels of the three main trading sessions—Asia, Europe, and New York—along with the previous day’s high, low, and open. Each session’s time range can be customized using a UTC offset, and the indicator automatically tracks session highs and lows as price develops.
Functions:
Plots session highs and lows for Asia, Europe, and New York.
Shows previous day’s high, low, and open as reference levels.
Session times are fully configurable with hour and minute precision, including UTC offset adjustment.
Each session level is marked with both a line and a label for clarity.
Color customization for each session and previous day levels.
Designed for intraday timeframes (1–60 minutes).
Filter Condition:
When the filter option is enabled, the indicator adjusts how levels are drawn:
A session high above the current close is displayed as a solid line with a visible label.
Once price closes above that high, the line becomes dotted and dimmed, and the label also becomes less emphasized.
Similarly, a session low below the current close is displayed as a solid line and label.
If price closes below that low, the line switches to dotted and dimmed, with the label adjusted accordingly.
This behavior highlights only the most relevant levels for the current market position while still keeping breached levels visible in a subdued style, making it easier to spot active breakout or liquidity zones.
Adaptive Trend Following Suite [Alpha Extract]A sophisticated multi-filter trend analysis system that combines advanced noise reduction, adaptive moving averages, and intelligent market structure detection to deliver institutional-grade trend following signals. Utilizing cutting-edge mathematical algorithms and dynamic channel adaptation, this indicator provides crystal-clear directional guidance with real-time confidence scoring and market mode classification for professional trading execution.
🔶 Advanced Noise Reduction
Filter Eliminates market noise using sophisticated Gaussian filtering with configurable sigma values and period optimization. The system applies mathematical weight distribution across price data to ensure clean signal generation while preserving critical trend information, automatically adjusting filter strength based on volatility conditions.
advancedNoiseFilter(sourceData, filterLength, sigmaParam) =>
weightSum = 0.0
valueSum = 0.0
centerPoint = (filterLength - 1) / 2
for index = 0 to filterLength - 1
gaussianWeight = math.exp(-0.5 * math.pow((index - centerPoint) / sigmaParam, 2))
weightSum += gaussianWeight
valueSum += sourceData * gaussianWeight
valueSum / weightSum
🔶 Adaptive Moving Average Core Engine
Features revolutionary volatility-responsive averaging that automatically adjusts smoothing parameters based on real-time market conditions. The engine calculates adaptive power factors using logarithmic scaling and bandwidth optimization, ensuring optimal responsiveness during trending markets while maintaining stability during consolidation phases.
// Calculate adaptive parameters
adaptiveLength = (periodLength - 1) / 2
logFactor = math.max(math.log(math.sqrt(adaptiveLength)) / math.log(2) + 2, 0)
powerFactor = math.max(logFactor - 2, 0.5)
relativeVol = avgVolatility != 0 ? volatilityMeasure / avgVolatility : 0
adaptivePower = math.pow(relativeVol, powerFactor)
bandwidthFactor = math.sqrt(adaptiveLength) * logFactor
🔶 Intelligent Market Structure Analysis
Employs fractal dimension calculations to classify market conditions as trending or ranging with mathematical precision. The system analyzes price path complexity using normalized data arrays and geometric path length calculations, providing quantitative market mode identification with configurable threshold sensitivity.
🔶 Multi-Component Momentum Analysis
Integrates RSI and CCI oscillators with advanced Z-score normalization for statistical significance testing. Each momentum component receives independent analysis with customizable periods and significance levels, creating a robust consensus system that filters false signals while maintaining sensitivity to genuine momentum shifts.
// Z-score momentum analysis
rsiAverage = ta.sma(rsiComponent, zAnalysisPeriod)
rsiDeviation = ta.stdev(rsiComponent, zAnalysisPeriod)
rsiZScore = (rsiComponent - rsiAverage) / rsiDeviation
if math.abs(rsiZScore) > zSignificanceLevel
rsiMomentumSignal := rsiComponent > 50 ? 1 : rsiComponent < 50 ? -1 : rsiMomentumSignal
❓How It Works
🔶 Dynamic Channel Configuration
Calculates adaptive channel boundaries using three distinct methodologies: ATR-based volatility, Standard Deviation, and advanced Gaussian Deviation analysis. The system automatically adjusts channel multipliers based on market structure classification, applying tighter channels during trending conditions and wider boundaries during ranging markets for optimal signal accuracy.
dynamicChannelEngine(baselineData, channelLength, methodType) =>
switch methodType
"ATR" => ta.atr(channelLength)
"Standard Deviation" => ta.stdev(baselineData, channelLength)
"Gaussian Deviation" =>
weightArray = array.new_float()
totalWeight = 0.0
for i = 0 to channelLength - 1
gaussWeight = math.exp(-math.pow((i / channelLength) / 2, 2))
weightedVariance += math.pow(deviation, 2) * array.get(weightArray, i)
math.sqrt(weightedVariance / totalWeight)
🔶 Signal Processing Pipeline
Executes a sophisticated 10-step signal generation process including noise filtering, trend reference calculation, structure analysis, momentum component processing, channel boundary determination, trend direction assessment, consensus calculation, confidence scoring, and final signal generation with quality control validation.
🔶 Confidence Transformation System
Applies sigmoid transformation functions to raw confidence scores, providing 0-1 normalized confidence ratings with configurable threshold controls. The system uses steepness parameters and center point adjustments to fine-tune signal sensitivity while maintaining statistical robustness across different market conditions.
🔶 Enhanced Visual Presentation
Features dynamic color-coded trend lines with adaptive channel fills, enhanced candlestick visualization, and intelligent price-trend relationship mapping. The system provides real-time visual feedback through gradient fills and transparency adjustments that immediately communicate trend strength and direction changes.
🔶 Real-Time Information Dashboard
Displays critical trading metrics including market mode classification (Trending/Ranging), structure complexity values, confidence scores, and current signal status. The dashboard updates in real-time with color-coded indicators and numerical precision for instant market condition assessment.
🔶 Intelligent Alert System
Generates three distinct alert types: Bullish Signal alerts for uptrend confirmations, Bearish Signal alerts for downtrend confirmations, and Mode Change alerts for market structure transitions. Each alert includes detailed messaging and timestamp information for comprehensive trade management integration.
🔶 Performance Optimization
Utilizes efficient array management and conditional processing to maintain smooth operation across all timeframes. The system employs strategic variable caching, optimized loop structures, and intelligent update mechanisms to ensure consistent performance even during high-volatility market conditions.
This indicator delivers institutional-grade trend analysis through sophisticated mathematical modelling and multi-stage signal processing. By combining advanced noise reduction, adaptive averaging, intelligent structure analysis, and robust momentum confirmation with dynamic channel adaptation, it provides traders with unparalleled trend following precision. The comprehensive confidence scoring system and real-time market mode classification make it an essential tool for professional traders seeking consistent, high-probability trend following opportunities with mathematical certainty and visual clarity.

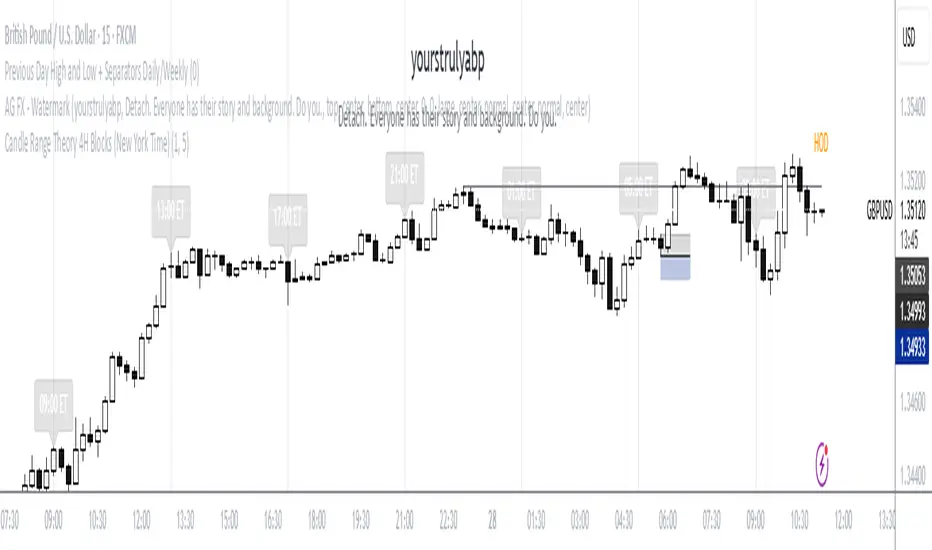
Candle Range Theory 4H Blocks (New York Time)This is a script to those who mess up the CRT, Candle Range Theory, times to trade Forex and CFDs. It is simple and effective.
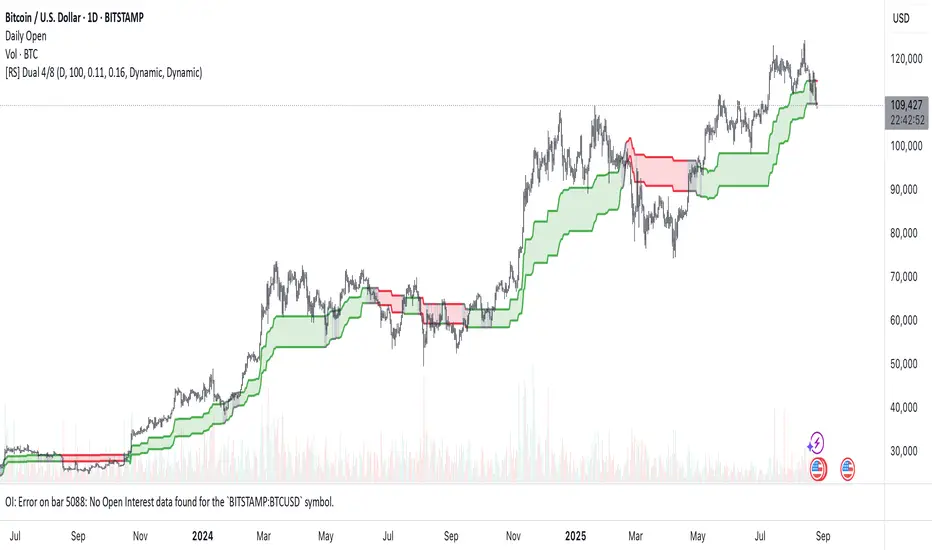
[RS] Dual Murrey 4/8 (MTF) Inspired on multi-timeframe Murrey’s Math Lines Channel.
Using the 4/8 , 2 times with different fractal multipliers to follow the trend
US100 Liquidity Precision StrategyScalping strategy 5-10 point sl / 17 points tp
Automatic BE
Consistent money over time

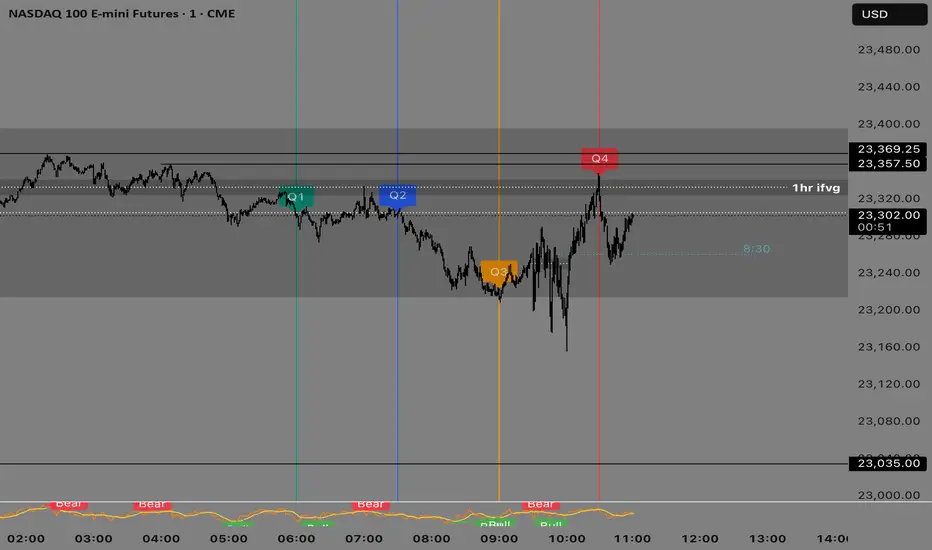
Quarterly Theory —Q1,Q2,Q3,Q4The Quarterly Theory Indicator is a trading tool designed to visualize the natural time-based cycles of the market, based on the principles of Quarterly Theory, popularized by the Inner Circle Trader (ICT). The indicator divides market sessions into four equal “quarters” to help traders identify potential accumulation, manipulation, and distribution phases (AMD model) and improve the timing of entries and exits.
Key Features:
Quarter Divisions (Q1–Q4):
Each market session (e.g., NY AM, London, Asia) is divided into four quarters.
Vertical lines mark the beginning of each quarter, making it easy to track session structure.
Optional labels show Q1, Q2, Q3, and Q4 directly on the chart.
True Open (Q2 Open):
The True Open is the opening price of Q2, considered a key reference point in Quarterly Theory.
A horizontal red line is drawn at the True Open price with a label showing the exact value.
This line helps traders filter bullish and bearish setups:
Buy below the True Open if the market is bullish.
Sell above the True Open if the market is bearish.
Session Awareness:
The indicator can automatically detect market sessions and reset lines and labels for each new session.
Ensures that only the current session’s True Open and quarter lines are displayed, reducing chart clutter.
Timeframe Flexibility:
Works on any chart timeframe (1-minute to daily).
Maintains accurate alignment of quarters and True Open regardless of the timeframe used.
Purpose of Quarterly Theory:
Quarterly Theory is based on the idea that market behavior is fractal and time-driven. By dividing sessions into four quarters, traders can anticipate potential market phases:
Q1: Initial price discovery and setup for the session.
Q2: Accumulation or manipulation phase, where the True Open is established.
Q3: Manipulation or Judas Swing phase designed to trap traders.
Q4: Distribution or trend continuation/reversal.
By visualizing these quarters and the True Open, traders can reduce ambiguity, identify high-probability setups, and improve their timing in line with the ICT AMD (Accumulation, Manipulation, Distribution) framework.
XAUUSD Strength Dashboard with VolumeXAUUSD Strength Dashboard with Volume Analysis
📌 Description
This advanced Pine Script indicator provides a multi-timeframe dashboard for XAUUSD (Gold vs. USD), combining price action analysis with volume confirmation to generate high-probability trading signals. It detects:
✅ Break of Structure (BOS)
✅ Fair Value Gaps (FVG)
✅ Change of Character (CHOCH)
✅ Trendline Breaks (9/21 SMA Crossover)
✅ Volume Spikes (Confirmation of Strength)
The dashboard displays strength scores (0-100%) and action recommendations (Strong Buy/Buy/Neutral/Sell/Strong Sell) across multiple timeframes, helping traders identify confluences for better trade decisions.
🎯 How It Works
1. Multi-Timeframe Analysis
Fetches data from 1m, 5m, 15m, 30m, 1h, 4h, Daily, and Weekly timeframes.
Compares trend direction, BOS, FVG, CHOCH, and volume spikes across all timeframes.
2. Volume-Confirmed Strength Score
The Strength Score (0-100%) is calculated using:
Trend Direction (25 points) → 9 SMA vs. 21 SMA
Break of Structure (20 points) → New highs/lows with momentum
Fair Value Gaps (10 points) → Imbalance zones
Change of Character (10 points) → Shift in market structure
Trendline Break (20 points) → SMA crossover confirmation
Volume Spike (15 points) → High volume confirms moves
Score Interpretation:
≥75% → Strong Buy (High confidence bullish move)
60-74% → Buy (Bullish but weaker confirmation)
40-59% → Neutral (No strong bias)
25-39% → Sell (Bearish but weaker confirmation)
≤25% → Strong Sell (High confidence bearish move)
3. Dashboard & Chart Markers
Dashboard Table: Shows Trend, BOS, Volume, CHOCH, TL Break, Strength %, Key Level, and Action for each timeframe.
Chart Markers:
🟢 Green Triangles → Bullish BOS
🔴 Red Triangles → Bearish BOS
🟢 Green Circles → Bullish CHOCH
🔴 Red Circles → Bearish CHOCH
📈 Green Arrows → Bullish Trendline Break
📉 Red Arrows → Bearish Trendline Break
"Vol↑" (Lime) → Bullish Volume Spike
"Vol↓" (Maroon) → Bearish Volume Spike
🚀 How to Use
1. Dashboard Interpretation
Higher Timeframes (D/W) → Show the dominant trend.
Lower Timeframes (1m-4h) → Help with entry timing.
Strength Score ≥75% or ≤25% → Look for high-confidence trades.
Volume Spikes → Confirm breakouts/reversals.
2. Trading Strategy
📈 Long (Buy) Setup:
Higher TFs (D/W/4h) show bullish trend (↑).
Current TF has BOS & Volume Spike.
Strength Score ≥60%.
Key Level (Low) holds as support.
📉 Short (Sell) Setup:
Higher TFs (D/W/4h) show bearish trend (↓).
Current TF has BOS & Volume Spike.
Strength Score ≤40%.
Key Level (High) holds as resistance.
3. Customization
Adjust Volume Spike Multiplier (Default: 1.5x) → Controls sensitivity to volume spikes.
Toggle Timeframes → Enable/disable higher/lower timeframes.
🔑 Key Benefits
✔ Multi-Timeframe Confluence → Avoids false signals.
✔ Volume Confirmation → Filters low-quality breakouts.
✔ Clear Strength Scoring → Removes emotional bias.
✔ Visual Chart Markers → Easy to spot key signals.
This indicator is ideal for gold traders who follow institutional order flow, market structure, and volume analysis to improve their trading decisions.
🎯 Best Used With:
Support/Resistance Levels
Fibonacci Retracements
Price Action Confirmation
🚀 Happy Trading! 🚀

ADR/ATR Session No Probability Table by LKHere you go—clear, English docs you can drop into your script’s description or share with teammates.
ADR/ATR Session by LK — Overview
This indicator summarizes Average Daily Range (ADR) and Average True Range (ATR) for two horizons:
• Session H4 (e.g., 06:00–13:00 on a 4‑hour chart)
• Daily (D)
It shows:
• Current ADR/ATR values (using your chosen smoothing method)
• How much of ADR/ATR today/this bar has already been consumed (% of ADR/ATR)
• ADR/ATR as a percent of price
• Optional probability blocks: likelihood that %ADR will exceed user‑defined thresholds over a lookback window
• Optional on‑chart lines for the current H4 and Daily candles: Open, ADR High, ADR Low
⸻
What the metrics mean
• ADR (H4 / D): Moving average of the bar range (high - low).
• ATR (H4 / D): Moving average of True Range (max(hi-lo, |hi-close |, |lo-close |)).
• % of ADR (curr H4): (H4 range of the current H4 bar) / ADR(H4) × 100. Updates live even if the current time is outside the session.
• % of ADR (Daily): (today’s intra‑day range) / ADR(D) × 100.
• % of ATR (curr H4 / Daily): TR / ATR × 100 for that horizon.
• ADR % of Price / ATR % of Price: ADR or ATR divided by current price × 100 (a quick “volatility vs. price” gauge).
Session logic (H4): ADR/ATR(H4) only update on bars that fall inside the configured session window; outside the window the values hold steady (no recalculation “bleed”).
Daily range tracking: The indicator tracks today’s high/low in real‑time and resets at the day change.
⸻
Inputs (quick reference)
Core
• Length (ADR/ATR): smoothing length for ADR/ATR (default 21).
• Wait for Higher TF Bar Close: if true, updates ADR/ATR only after the higher‑TF bar closes when using request.security.
Timeframes
• Session Timeframe (H4): default 240.
• Daily Timeframe: default D.
Session time
• Session Timezone: “Chart” (default) or a fixed timezone.
• Session Start Hour, End Hour (minutes are fixed to 0 in this version).
Smoothing methods
• H4 ADR Method / H4 ATR Method: SMA/EMA/RMA/WMA.
• Daily ADR Method / Daily ATR Method: SMA/EMA/RMA/WMA.
Table appearance
• Table BG, Table Text, Table Font Size.
Lines (optional)
• Show current H4 segments, Show current Daily segments
• Line colors for Open / ADR High / ADR Low
• Line width
Probability
• H4 Probability Lookback (bars): number of H4 bars to examine (e.g., 300).
• Daily Probability Lookback (days): number of D bars (e.g., 180).
• ADR thresholds (%): CSV list of thresholds (e.g., 25,50,55,60,65,70,75,80,85,90,95,100,125,150).
The table will show the % of lookback bars where %ADR ≥ threshold.
Tip: If you want probabilities only for session H4 bars (not every H4 bar), ask and I can add a toggle to filter by inSess.
⸻
How to read the table
H4 block
• ADR (method) / ATR (method): the session‑aware averages.
• % of ADR (curr H4): live progress of this H4 bar toward the session ADR.
• ADR % of Price: ADR(H4) relative to price.
• % of ATR (curr H4) and ATR % of Price: same idea for ATR.
H4 Probability (lookback N bars)
• Rows like “≥ 80% ADR” show the fraction (in %) of the last N H4 bars that reached at least 80% of ADR(H4).
Daily block
• Mirrors the H4 block, but for Daily.
Daily Probability (lookback M days)
• Rows like “≥ 100% ADR” show the fraction of the last M daily bars whose daily range reached at least 100% of ADR(D).
⸻
Practical usage
• Use % of ADR (curr H4 / Daily) to judge exhaustion or room left in the day/session.
E.g., if Daily %ADR is already 95%, be cautious with momentum continuation trades.
• The probability tables give a quick historical context:
If “≥ 125% ADR” is ~18%, the market rarely stretches that far; your trade sizing/targets can reflect that.
• ADR/ATR % of Price helps normalize volatility between instruments.
⸻
Troubleshooting
• If probability rows are blank: ensure lookback windows are large enough (and that the chart has enough history).
• If ADR/ATR show … (NA): usually you don’t have enough bars for the chosen length/TF yet.
• If line segments are missing: verify you’re on a chart with visible current H4/D bars and the toggles are enabled.
⸻
Notes & customization ideas
• Add a toggle to count only session bars in H4 probability.
• Add separate thresholds for H4 vs Daily.
• Let users pick minutes for session start/end if needed.
• Add alerts when %ADR crosses specified thresholds.
If you want me to bundle any of the “ideas” above into the code, say the word and I’ll ship a clean patch.

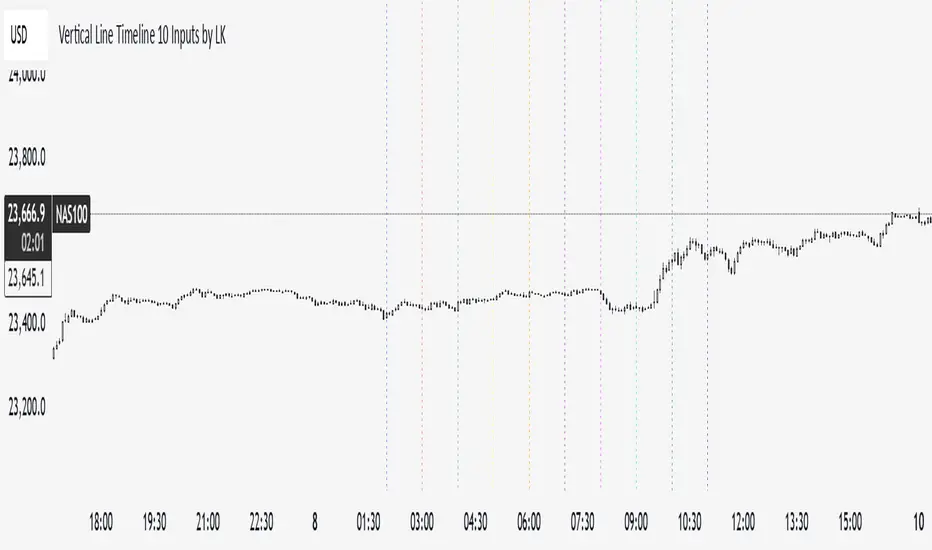
Vertical Line Timeline 10 Inputs by LK**Vertical Line Timeline (10 Inputs)**
This TradingView indicator plots vertical lines on your chart at up to **10 specific times of day**. You can define each time in **HH.MM format** (e.g., `9.30` for 9:30 AM). When the current bar’s time matches any of the defined times (based on the chart’s timezone), the indicator automatically draws a **full-height vertical line** at that bar.
**Features:**
* **Up to 10 custom time inputs** (HH.MM format)
* **Custom color** for each time marker
* **Adjustable line width** (1–6 px)
* **Solid or dotted style** toggle
* **Full-height vertical lines** (extend through the entire chart height)
* Works on any intraday timeframe where bar start times can match the defined times
* No labels or extra elements — clean and minimal display
**Use cases:**
* Marking important market sessions (e.g., London Open, New York Open, Asian Close)
* Highlighting personal trade execution windows
* Visual cues for strategy backtesting or time-based setups
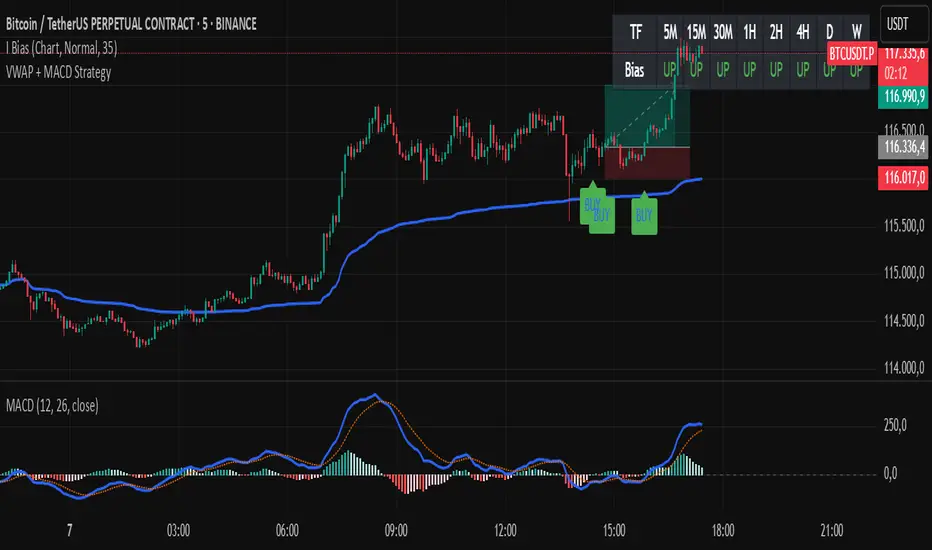
VWAP + MACD Estrategia MilloVWAP + MACD Strategy
This indicator combines the VWAP (Volume Weighted Average Price) with MACD (Moving Average Convergence Divergence) to create buy and sell signals. It helps traders identify potential market entry and exit points based on price action and momentum.
Conditions for Buy:
The price must be above the VWAP.
The MACD line crosses above the signal line (bullish crossover).
The MACD line is below the zero line.
Conditions for Sell:
The price must be below the VWAP.
The MACD line crosses below the signal line (bearish crossover).
The MACD line is above the zero line.
Features:
The VWAP line is plotted to represent the average price, weighted by volume, over a specified period.
Buy signals appear when all conditions are met for an upward price movement.
Sell signals appear when all conditions are met for a downward price movement.
MACD and Signal Line: The MACD helps to confirm momentum, while the signal line indicates possible trend reversals.
Customizable: You can modify the VWAP and MACD parameters to suit different trading strategies.
This strategy is designed for intraday traders and scalpers, aiming to catch quick movements while being aware of market momentum.
Feel free to share this description along with the code! Let me know if you need any adjustments or further explanations.
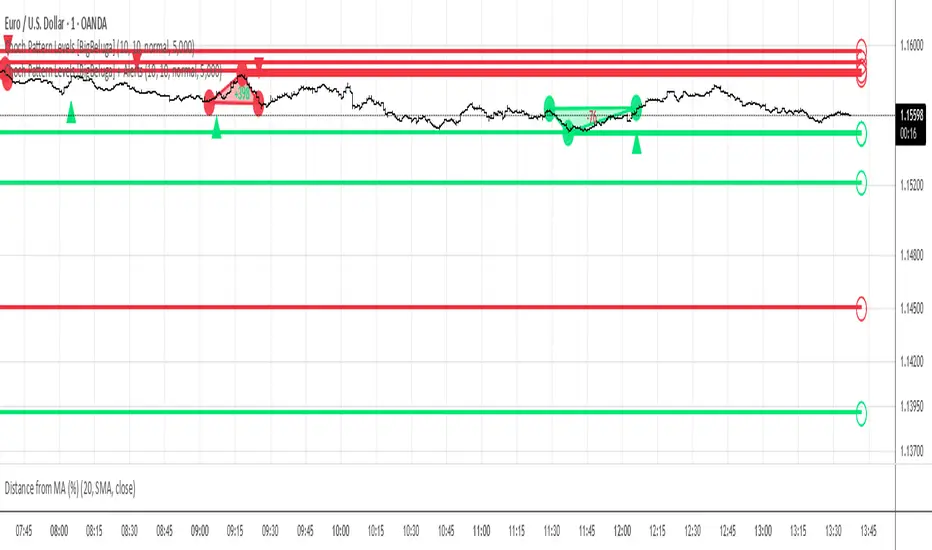
Choch Pattern Levels [BigBeluga] + AlertsThis version of Choch Pattern Levels includes built-in alert conditions for both ChoCh Up and ChoCh Down patterns. You can now set TradingView alerts directly when either pattern occurs, with optional visual markers (triangles) plotted on the chart.
Based on the original script by BigBeluga, licensed under CC BY-NC-SA 4.0. This is a modified version with alert conditions added.
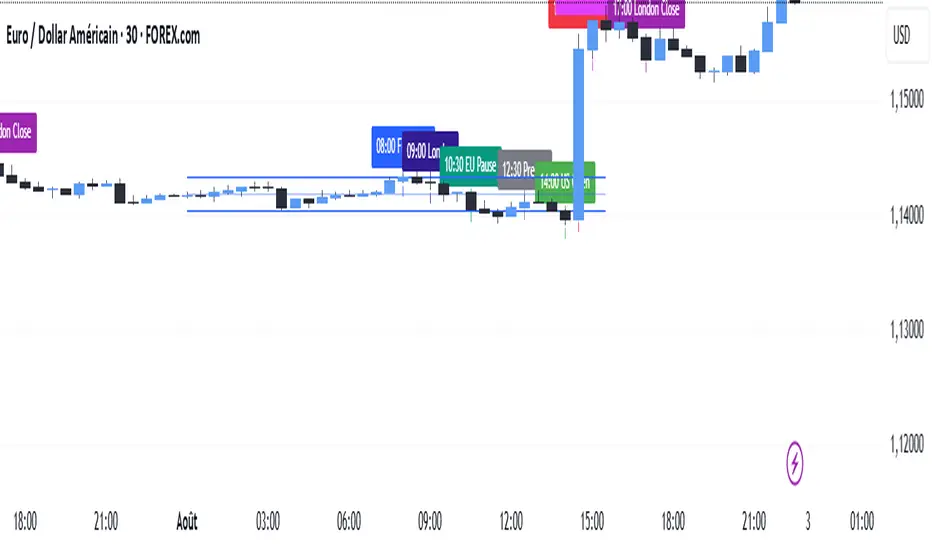
SMC TimingThis indicator (“SMC Timing”) visually marks the exact moments when the market typically experiences large liquidity injections—moments that often trigger strong directional moves. By plotting dashed vertical lines and labels at key session boundaries and news events (Frankfurt open, London open, EU mid-session pause, Pre-US, US open, 14:30 U.S. news releases, 15:00 breakout window, and the London close), it draws your attention to the times when stop-runs and institutional orders tend to pile into the market.
Traders can use these timing zones to:
Anticipate liquidity sweeps where smart-money often liquidates weak positions or hunts stops.
Plan higher-probability entries just before or directly after these injections, reducing slippage and improving execution.
Improve win-rate consistency by aligning your trades with the natural ebb and flow of institutional flow rather than fading it.
With customizable session toggles, a “today-only” filter, and a small vertical offset to keep markers clear of price bars, this tool seamlessly integrates into any chart. Positioning yourself around these highlighted times helps you capture the bulk of intraday moves and avoids getting caught in low-liquidity chop.
Lucas Scalia Maximums and minimums of the day, week, and month. Basically, it automatically marks and labels the highs and lows of the previous daily , weekly, and monthly candles. The labels can be added or removed at your discretion, leaving only the dotted lines.

Reversal Point Dynamics⇋ Reversal Point Dynamics (RPD)
This is not an indicator; it is a complete system for deconstructing the mechanics of a market reversal. Reversal Point Dynamics (RPD) moves far beyond simplistic pattern recognition, venturing into a deep analysis of the underlying forces that cause trends to exhaust, pause, and turn. It is engineered from the ground up to identify high-probability reversal points by quantifying the confluence of market dynamics in real-time.
Where other tools provide a static signal, RPD delivers a dynamic probability. It understands that a true market turning point is not a single event, but a cascade of failing momentum, structural breakdown, and a shift in market order. RPD's core engine meticulously analyzes each of these dynamic components—the market's underlying state, its velocity and acceleration, its degree of chaos (entropy), and its structural framework. These forces are synthesized into a single, unified Probability Score, offering you an unprecedented, transparent view into the conviction behind every potential reversal.
This is not a "black box" system. It is an open-architecture engine designed to empower the discerning trader. Featuring real-time signal projection, an integrated Fibonacci R2R Target Engine, and a comprehensive dashboard that acts as your Dynamics Control Center , RPD gives you a complete, holistic view of the market's state.
The Theoretical Core: Deconstructing Market Dynamics
RPD's analytical power is born from the intelligent synthesis of multiple, distinct theoretical models. Each pillar of the engine analyzes a different facet of market behavior. The convergence of these analyses—the "Singularity" event referenced in the dashboard—is what generates the final, high-conviction probability score.
1. Pillar One: Quantum State Analysis (QSA)
This is the foundational analysis of the market's current state within its recent context. Instead of treating price as a random walk, QSA quantizes it into a finite number of discrete "states."
Formulaic Concept: The engine establishes a price range using the highest high and lowest low over the Adaptive Analysis Period. This range is then divided into a user-defined number of Analysis Levels. The current price is mapped to one of these states (e.g., in a 9-level system, State 0 is the absolute low, and State 8 is the absolute high).
Analytical Edge: This acts as a powerful foundational filter. The engine will only begin searching for reversal signals when the market has reached a statistically stretched, extreme state (e.g., State 0 or 8). The Edge Sensitivity input allows you to control exactly how close to this extreme edge the price must be, ensuring you are trading from points of maximum potential exhaustion.
2. Pillar Two: Price State Roc (PSR) - The Dynamics of Momentum
This pillar analyzes the kinetic forces of the market: its velocity and acceleration. It understands that it’s not just where the price is, but how it got there that matters.
Formulaic Concept: The psr function calculates two derivatives of price.
Velocity: (price - price ). This measures the speed and direction of the current move.
Acceleration: (velocity - velocity ). This measures the rate of change in that speed. A negative acceleration (deceleration) during a strong rally is a critical pre-reversal warning, indicating momentum is fading even as price may be pushing higher.
Analytical Edge: The engine specifically hunts for exhaustion patterns where momentum is clearly decelerating as price reaches an extreme state. This is the mechanical signature of a weakening trend.
3. Pillar Three: Market Entropy Analysis - The Dynamics of Order & Chaos
This is RPD's chaos filter, a concept borrowed from information theory. Entropy measures the degree of randomness or disorder in the market's price action.
Formulaic Concept: The calculateEntropy function analyzes recent price changes. A market moving directionally and smoothly has low entropy (high order). A market chopping back and forth without direction has high entropy (high chaos). The value is normalized between 0 and 1.
Analytical Edge: The most reliable trades occur in low-entropy, ordered environments. RPD uses the Entropy Threshold to disqualify signals that attempt to form in chaotic, unpredictable conditions, providing a powerful shield against whipsaw markets.
4. Pillar Four: The Synthesis Engine & Probability Calculation
This is where all the dynamic forces converge. The final probability score is a weighted calculation that heavily rewards confluence.
Formulaic Concept: The calculateProbability function intelligently assembles the final score:
A Base Score is established from trend strength and entropy.
An Entropy Score adds points for low entropy (order) and subtracts for high entropy (chaos).
A significant Divergence Bonus is awarded for a classic momentum divergence.
RSI & Volume Bonuses are added if momentum oscillators are in extreme territory or a volume spike confirms institutional interest.
MTF & Adaptive Bonuses add further weight for alignment with higher timeframe structure.
Analytical Edge: A signal backed by multiple dynamic forces (e.g., extreme state + decelerating momentum + low entropy + volume spike) will receive an exponentially higher probability score. This is the very essence of analyzing reversal point dynamics.
The Command Center: Mastering the Inputs
Every input is a precise lever of control, allowing you to fine-tune the RPD engine to your exact trading style, market, and timeframe.
🧠 Core Algorithm
Predictive Mode (Early Detection):
What It Is: Enables the engine to search for potential reversals on the current, unclosed bar.
How It Works: Analyzes intra-bar acceleration and state to identify developing exhaustion. These signals are marked with a ' ? ' and are tentative.
How To Use It: Enable for scalping or very aggressive day trading to get the earliest possible indication. Disable for swing trading or a more conservative approach that waits for full bar confirmation.
Live Signal Mode (Current Bar):
What It Is: A highly aggressive mode that plots tentative signals with a ' ! ' on the live bar based on projected price and momentum. These signals repaint intra-bar.
How It Works: Uses a linear regression projection of the close to anticipate a reversal.
How To Use It: For advanced users who use intra-bar dynamics for execution and understand the nature of repainting signals.
Adaptive Analysis Period:
What It Is: The main lookback period for the QSA, PSR, and Entropy calculations. This is the engine's "memory."
How It Works: A shorter period makes the engine highly sensitive to local price swings. A longer period makes it focus only on major, significant market structure.
How To Use It: Scalping (1-5m): 15-25. Day Trading (15m-1H): 25-40. Swing Trading (4H+): 40-60.
Fractal Strength (Bars):
What It Is: Defines the strength of the pivot detection used for confirming reversal events.
How It Works: A value of '2' requires a candle's high/low to be more extreme than the two bars to its left and right.
How To Use It: '2' is a robust standard. Increase to '3' for an even stricter definition of a structural pivot, which will result in fewer signals.
MTF Multiplier:
What It Is: Integrates pivot data from a higher timeframe for confluence.
How It Works: A multiplier of '4' on a 15-minute chart will pull pivot data from the 1-hour chart (15 * 4 = 60m).
How To Use It: Set to a multiple that corresponds to your preferred higher timeframe for contextual analysis.
🎯 Signal Settings
Min Probability %:
What It Is: Your master quality filter. A signal is only plotted if its score exceeds this threshold.
How It Works: Directly filters the output of the final probability calculation.
How To Use It: High-Quality (80-95): For A+ setups only. Balanced (65-75): For day trading. Aggressive (50-60): For scalping.
Min Signal Distance (Bars):
What It Is: A noise filter that prevents signals from clustering in choppy conditions.
How It Works: Enforces a "cooldown" period of N bars after a signal.
How To Use It: Increase in ranging markets to focus on major swings. Decrease on lower timeframes.
Entropy Threshold:
What It Is: Your "chaos shield." Sets the maximum allowable market randomness for a signal.
How It Works: If calculated entropy is above this value, the signal is invalidated.
How To Use It: Lower values (0.1-0.5): Extremely strict. Higher values (0.7-1.0): More lenient. 0.85 is a good balance.
Adaptive Entropy & Aggressive Mode:
What It Is: Toggles for dynamically adjusting the engine's core parameters.
How It Works: Adaptive Entropy can slightly lower the required probability in strong trends. Aggressive Mode uses more lenient settings across the board.
How To Use It: Keep Adaptive on. Use Aggressive Mode sparingly, primarily for scalping highly volatile assets.
📊 State Analysis
Analysis Levels:
What It Is: The number of discrete "states" for the QSA.
How It Works: More levels create a finer-grained analysis of price location.
How To Use It: 6-7 levels are ideal. Increasing to 9 can provide more precision on very volatile assets.
Edge Sensitivity:
What It Is: Defines how close to the absolute top/bottom of the range price must be.
How It Works: '0' means price must be in the absolute highest/lowest state. '3' allows a signal within the top/bottom 3 states.
How To Use It: '3' provides a good balance. Lower it to '1' or '0' if you only want to trade extreme exhaustion.
The Dashboard: Your Dynamics Control Center
The dashboard provides a transparent, real-time view into the engine's brain. Use it to understand the context behind every signal and to gauge the current market environment at a glance.
🎯 UNIFIED PROB SCORE
TOTAL SCORE: The highest probability score (either Peak or Valley) the engine is currently calculating. This is your main at-a-glance conviction metric. The "Singularity" header refers to the event where market dynamics align—the event RPD is built to detect.
Quality: A human-readable interpretation of the Total Score. "EXCEPTIONAL" (🌟) is a rare, A+ confluence event. "STRONG" (💪) is a high-quality, tradable setup.
📊 ORDER FLOW & COMPONENT ANALYSIS
Volume Spike: Shows if the current volume is significantly higher than average (YES/NO). A 'YES' adds major confirmation.
Peak/Valley Conf: This breaks down the probability score into its directional components, showing you the separate confidence levels for a potential top (Peak) versus a bottom (Valley).
🌌 MARKET STRUCTURE
HTF Trend: Shows the direction of the underlying trend based on a Supertrend calculation.
Entropy: The current market chaos reading. "🔥 LOW" is an ideal, ordered state for trading. "😴 HIGH" is a warning of choppy, unpredictable conditions.
🔮 FIB & R2R ZONE (Large Dashboard)
This section gives you the status of the Fibonacci Target Engine. It shows if an Active Channel (entry zone) or Stop Zone (invalidation zone) is active and displays the precise price levels for the static entry, target, and stop calculated at the time of the signal.
🛡️ FILTERS & PREDICTIVES (Large Dashboard)
This panel provides a status check on all the bonus filters. It shows the current RSI Status, whether a Divergence is present, and if a Live Pending signal is forming.
The Visual Interface: A Symphony of Data
Every visual element is designed for instant, intuitive interpretation of market dynamics.
Signal Markers: These are the primary outputs of the engine.
▼/▲ b: A fully confirmed signal that has passed all filters.
? b: A tentative signal generated in Predictive Mode, indicating developing dynamics.
◈ b: This diamond icon replaces the standard triangle when the signal is confirmed by a strong momentum divergence, highlighting it as a superior setup where dynamics are misaligned with price.
Harmonic Wave: The flowing, colored wave around the price.
What It Represents: The market's "flow dynamic" and volatility.
How to Interpret It: Expanding waves show increasing volatility. The color is tied to the "Quantum Color" in your theme, representing the underlying energy field of the market.
Entropy Particles: The small dots appearing above/below price.
What They Represent: A direct visualization of the "order dynamic."
How to Interpret Them: Their presence signifies a low-entropy, ordered state ideal for trading. Their color indicates the direction of momentum (PSR velocity). Their absence means the market is too chaotic (high entropy).
The Fibonacci Target Engine: The dynamic R2R system appearing post-signal.
Static Fib Levels: Colored horizontal lines representing the market's "structural dynamic."
The Green "Active Channel" Box: Your zone of consideration. An area to manage a potential entry.
Development Philosophy
Reversal Point Dynamics was engineered to answer a fundamental question: can we objectively measure the forces behind a market turn? It is a synthesis of concepts from market microstructure, statistics, and information theory. The objective was never to create a "perfect" system, but to build a robust decision-support tool that provides a measurable, statistical edge by focusing on the principle of confluence.
By demanding that multiple, independent market dynamics align simultaneously, RPD filters out the vast majority of market noise. It is designed for the trader who thinks in terms of probability and risk management, not in terms of certainties. It is a tool to help you discount the obvious and bet on the unexpected alignment of market forces.
"Markets are constantly in a state of uncertainty and flux and money is made by discounting the obvious and betting on the unexpected."
— George Soros
Trade with insight. Trade with anticipation.
— Dskyz, for DAFE Trading Systems

Custom Daily Session Zones by KoenigseggCustom Daily Session Zones
🟣 Description
This indicator displays customizable trading session time zones as background highlights on your chart, on any timeframe you choose. The inline info tooltip provides the precise start and end times of the three largest market sessions—the US, the EU, and ASIA—for quick reference. It provides flexible control over session times for different days of the week, making it ideal for traders who need to visualize specific market hours or trading sessions.
🟣 Key Features
- Flexible Session Configuration: Set a common session time for all days or customize individual sessions for each day of the week
- Per-Day Control: Enable or disable sessions for specific days (Monday through Sunday)
- Color Customization: Choose unique colors for each day's session zones
- UTC Timezone Standard: All session times are defined in UTC to ensure consistency across charts
- Clean Visual Display: Non-intrusive background highlighting that doesn't interfere with price action
🟣 How to Use
- Common Session Mode: Use the default mode to apply the same session time across all enabled days
- Manual Per-Day Mode: Enable "Manual per-day sessions" to set different session times for each day
- Day Selection: Toggle individual days on/off based on your trading schedule
- Color Coding: Customize colors for each day to easily distinguish between different sessions
🟣 Technical Details
- Uses Pine Script v6 for optimal performance
- Implements proper session time detection using TradingView's built-in time functions
- Operates in UTC timezone for all session calculations
- Lightweight code that doesn't impact chart performance
🟣 Use Cases
- Highlight specific trading sessions (London, New York, Tokyo, etc.)
- Mark important market hours for your trading strategy
- Visualize different session overlaps
- Create custom trading time windows
- Track market activity during specific hours
🟣 Compatibility
- Works on all timeframes
- Compatible with all asset classes (Forex, Stocks, Crypto, Futures, etc.)
- Supports all TradingView chart types
- Responsive design that adapts to different screen sizes
🟣 Image Descriptions
- First Image (main image): Shows multiple New York Stock Exchange sessions from 1:30 p.m. to 8:00 p.m. (UTC), on the 15-minute timeframe, with each day’s zone colored differently to demonstrate the indicator’s customizable color settings.
- Second Image: A zoomed‑in fractal chart view of the same New York session on the 15-minute timeframe, illustrating how the background session zone appears even at higher detail levels.
Third Image: A close‑up of the New York session (1:30 p.m. to 8:00 p.m.) on the 3-minute timeframe, reaffirming the consistency of zone highlighting across different zoom levels.
🟣 Future Updates (v2)
In the next release, you’ll be able to define multiple session blocks per day—displaying two distinct colored zones within the same trading day. This will help you visualize when one market session ends and another begins without losing chart clarity.
🟣 Conclusion
This indicator is perfect for traders who need precise control over Market Session visualization and want to maintain a clean, professional chart appearance.
🟣 Disclaimer
This script is provided for educational and illustrative purposes only. It is not financial or trading advice, nor a recommendation to buy or sell any asset. Always conduct your own research and consult a professional before making any trading decisions.

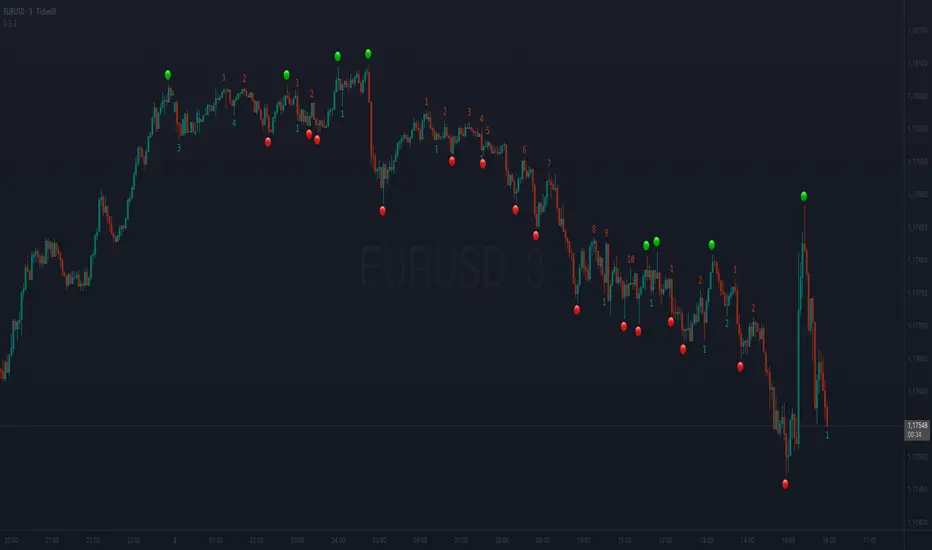
[eLm] 0-1-2# 📈 Market Structure Indicator – Counter System
This indicator dynamically analyzes price action to detect key market structure shifts and trend strength using four essential formations:
## 🔍 Detected Structures
- **Higher High (HH):** A candle forming a new high above recent peaks
- **Lower Low (LL):** A candle forming a new low below recent bottoms
- **Higher Low (HL):** A higher dip, indicating potential trend continuation
- **Lower High (LH):** A lower peak, signaling potential weakness
## 🧠 Structure Protection Logic
After a HH or LL is formed, if price does not breach that level within a user-defined number of candles, the level is considered **"protected."**
This provides insight into trend strength and market reaction.
## 🔢 HL / LH Counter System
- Each HL or LH increases a counter.
- A new HH or LL **resets** the corresponding counter to zero.
> This helps visualize how many consecutive HL or LH structures have occurred — useful for measuring trend momentum.
## 🎯 Use Cases
- Trend following and confirmation
- Early trend reversal detection
- Building structure-based trading strategies
- Understanding price behavior and market intent
---
> **Note:** This indicator does not provide financial advice. It is designed to support technical analysis with clear, structure-based visual signals.
Aetherium Institutional Market Resonance EngineAetherium Institutional Market Resonance Engine (AIMRE)
A Three-Pillar Framework for Decoding Institutional Activity
🎓 THEORETICAL FOUNDATION
The Aetherium Institutional Market Resonance Engine (AIMRE) is a multi-faceted analysis system designed to move beyond conventional indicators and decode the market's underlying structure as dictated by institutional capital flow. Its philosophy is built on a singular premise: significant market moves are preceded by a convergence of context , location , and timing . Aetherium quantifies these three dimensions through a revolutionary three-pillar architecture.
This system is not a simple combination of indicators; it is an integrated engine where each pillar's analysis feeds into a central logic core. A signal is only generated when all three pillars achieve a state of resonance, indicating a high-probability alignment between market organization, key liquidity levels, and cyclical momentum.
⚡ THE THREE-PILLAR ARCHITECTURE
1. 🌌 PILLAR I: THE COHERENCE ENGINE (THE 'CONTEXT')
Purpose: To measure the degree of organization within the market. This pillar answers the question: " Is the market acting with a unified purpose, or is it chaotic and random? "
Conceptual Framework: Institutional campaigns (accumulation or distribution) create a non-random, organized market environment. Retail-driven or directionless markets are characterized by "noise" and chaos. The Coherence Engine acts as a filter to ensure we only engage when institutional players are actively steering the market.
Formulaic Concept:
Coherence = f(Dominance, Synchronization)
Dominance Factor: Calculates the absolute difference between smoothed buying pressure (volume-weighted bullish candles) and smoothed selling pressure (volume-weighted bearish candles), normalized by total pressure. A high value signifies a clear winner between buyers and sellers.
Synchronization Factor: Measures the correlation between the streams of buying and selling pressure over the analysis window. A high positive correlation indicates synchronized, directional activity, while a negative correlation suggests choppy, conflicting action.
The final Coherence score (0-100) represents the percentage of market organization. A high score is a prerequisite for any signal, filtering out unpredictable market conditions.
2. 💎 PILLAR II: HARMONIC LIQUIDITY MATRIX (THE 'LOCATION')
Purpose: To identify and map high-impact institutional footprints. This pillar answers the question: " Where have institutions previously committed significant capital? "
Conceptual Framework: Large institutional orders leave indelible marks on the market in the form of anomalous volume spikes at specific price levels. These are not random occurrences but are areas of intense historical interest. The Harmonic Liquidity Matrix finds these footprints and consolidates them into actionable support and resistance zones called "Harmonic Nodes."
Algorithmic Process:
Footprint Identification: The engine scans the historical lookback period for candles where volume > average_volume * Institutional_Volume_Filter. This identifies statistically significant volume events.
Node Creation: A raw node is created at the mean price of the identified candle.
Dynamic Clustering: The engine uses an ATR-based proximity algorithm. If a new footprint is identified within Node_Clustering_Distance (ATR) of an existing Harmonic Node, it is merged. The node's price is volume-weighted, and its magnitude is increased. This prevents chart clutter and consolidates nearby institutional orders into a single, more significant level.
Node Decay: Nodes that are older than the Institutional_Liquidity_Scanback period are automatically removed from the chart, ensuring the analysis remains relevant to recent market dynamics.
3. 🌊 PILLAR III: CYCLICAL RESONANCE MATRIX (THE 'TIMING')
Purpose: To identify the market's dominant rhythm and its current phase. This pillar answers the question: " Is the market's immediate energy flowing up or down? "
Conceptual Framework: Markets move in waves and cycles of varying lengths. Trading in harmony with the current cyclical phase dramatically increases the probability of success. Aetherium employs a simplified wavelet analysis concept to decompose price action into short, medium, and long-term cycles.
Algorithmic Process:
Cycle Decomposition: The engine calculates three oscillators based on the difference between pairs of Exponential Moving Averages (e.g., EMA8-EMA13 for short cycle, EMA21-EMA34 for medium cycle).
Energy Measurement: The 'energy' of each cycle is determined by its recent volatility (standard deviation). The cycle with the highest energy is designated as the "Dominant Cycle."
Phase Analysis: The engine determines if the dominant cycles are in a bullish phase (rising from a trough) or a bearish phase (falling from a peak).
Cycle Sync: The highest conviction timing signals occur when multiple cycles (e.g., short and medium) are synchronized in the same direction, indicating broad-based momentum.
🔧 COMPREHENSIVE INPUT SYSTEM
Pillar I: Market Coherence Engine
Coherence Analysis Window (10-50, Default: 21): The lookback period for the Coherence Engine.
Lower Values (10-15): Highly responsive to rapid shifts in market control. Ideal for scalping but can be sensitive to noise.
Balanced (20-30): Excellent for day trading, capturing the ebb and flow of institutional sessions.
Higher Values (35-50): Smoother, more stable reading. Best for swing trading and identifying long-term institutional campaigns.
Coherence Activation Level (50-90%, Default: 70%): The minimum market organization required to enable signal generation.
Strict (80-90%): Only allows signals in extremely clear, powerful trends. Fewer, but potentially higher quality signals.
Standard (65-75%): A robust filter that effectively removes choppy conditions while capturing most valid institutional moves.
Lenient (50-60%): Allows signals in less-organized markets. Can be useful in ranging markets but may increase false signals.
Pillar II: Harmonic Liquidity Matrix
Institutional Liquidity Scanback (100-400, Default: 200): How far back the engine looks for institutional footprints.
Short (100-150): Focuses on recent institutional activity, providing highly relevant, immediate levels.
Long (300-400): Identifies major, long-term structural levels. These nodes are often extremely powerful but may be less frequent.
Institutional Volume Filter (1.3-3.0, Default: 1.8): The multiplier for detecting a volume spike.
High (2.5-3.0): Only registers climactic, undeniable institutional volume. Fewer, but more significant nodes.
Low (1.3-1.7): More sensitive, identifying smaller but still relevant institutional interest.
Node Clustering Distance (0.2-0.8 ATR, Default: 0.4): The ATR-based distance for merging nearby nodes.
High (0.6-0.8): Creates wider, more consolidated zones of liquidity.
Low (0.2-0.3): Creates more numerous, precise, and distinct levels.
Pillar III: Cyclical Resonance Matrix
Cycle Resonance Analysis (30-100, Default: 50): The lookback for determining cycle energy and dominance.
Short (30-40): Tunes the engine to faster, shorter-term market rhythms. Best for scalping.
Long (70-100): Aligns the timing component with the larger primary trend. Best for swing trading.
Institutional Signal Architecture
Signal Quality Mode (Professional, Elite, Supreme): Controls the strictness of the three-pillar confluence.
Professional: Loosest setting. May generate signals if two of the three pillars are in strong alignment. Increases signal frequency.
Elite: Balanced setting. Requires a clear, unambiguous resonance of all three pillars. The recommended default.
Supreme: Most stringent. Requires perfect alignment of all three pillars, with each pillar exhibiting exceptionally strong readings (e.g., coherence > 85%). The highest conviction signals.
Signal Spacing Control (5-25, Default: 10): The minimum bars between signals to prevent clutter and redundant alerts.
🎨 ADVANCED VISUAL SYSTEM
The visual architecture of Aetherium is designed not merely for aesthetics, but to provide an intuitive, at-a-glance understanding of the complex data being processed.
Harmonic Liquidity Nodes: The core visual element. Displayed as multi-layered, semi-transparent horizontal boxes.
Magnitude Visualization: The height and opacity of a node's "glow" are proportional to its volume magnitude. More significant nodes appear brighter and larger, instantly drawing the eye to key levels.
Color Coding: Standard nodes are blue/purple, while exceptionally high-magnitude nodes are highlighted in an accent color to denote critical importance.
🌌 Quantum Resonance Field: A dynamic background gradient that visualizes the overall market environment.
Color: Shifts from cool blues/purples (low coherence) to energetic greens/cyans (high coherence and organization), providing instant context.
Intensity: The brightness and opacity of the field are influenced by total market energy (a composite of coherence, momentum, and volume), making powerful market states visually apparent.
💎 Crystalline Lattice Matrix: A geometric web of lines projected from a central moving average.
Mathematical Basis: Levels are projected using multiples of the Golden Ratio (Phi ≈ 1.618) and the ATR. This visualizes the natural harmonic and fractal structure of the market. It is not arbitrary but is based on mathematical principles of market geometry.
🧠 Synaptic Flow Network: A dynamic particle system visualizing the engine's "thought process."
Node Density & Activation: The number of particles and their brightness/color are tied directly to the Market Coherence score. In high-coherence states, the network becomes a dense, bright, and organized web. In chaotic states, it becomes sparse and dim.
⚡ Institutional Energy Waves: Flowing sine waves that visualize market volatility and rhythm.
Amplitude & Speed: The height and speed of the waves are directly influenced by the ATR and volume, providing a feel for market energy.
📊 INSTITUTIONAL CONTROL MATRIX (DASHBOARD)
The dashboard is the central command console, providing a real-time, quantitative summary of each pillar's status.
Header: Displays the script title and version.
Coherence Engine Section:
State: Displays a qualitative assessment of market organization: ◉ PHASE LOCK (High Coherence), ◎ ORGANIZING (Moderate Coherence), or ○ CHAOTIC (Low Coherence). Color-coded for immediate recognition.
Power: Shows the precise Coherence percentage and a directional arrow (↗ or ↘) indicating if organization is increasing or decreasing.
Liquidity Matrix Section:
Nodes: Displays the total number of active Harmonic Liquidity Nodes currently being tracked.
Target: Shows the price level of the nearest significant Harmonic Node to the current price, representing the most immediate institutional level of interest.
Cycle Matrix Section:
Cycle: Identifies the currently dominant market cycle (e.g., "MID ") based on cycle energy.
Sync: Indicates the alignment of the cyclical forces: ▲ BULLISH , ▼ BEARISH , or ◆ DIVERGENT . This is the core timing confirmation.
Signal Status Section:
A unified status bar that provides the final verdict of the engine. It will display "QUANTUM SCAN" during neutral periods, or announce the tier and direction of an active signal (e.g., "◉ TIER 1 BUY ◉" ), highlighted with the appropriate color.
🎯 SIGNAL GENERATION LOGIC
Aetherium's signal logic is built on the principle of strict, non-negotiable confluence.
Condition 1: Context (Coherence Filter): The Market Coherence must be above the Coherence Activation Level. No signals can be generated in a chaotic market.
Condition 2: Location (Liquidity Node Interaction): Price must be actively interacting with a significant Harmonic Liquidity Node.
For a Buy Signal: Price must be rejecting the Node from below (testing it as support).
For a Sell Signal: Price must be rejecting the Node from above (testing it as resistance).
Condition 3: Timing (Cycle Alignment): The Cyclical Resonance Matrix must confirm that the dominant cycles are synchronized with the intended trade direction.
Signal Tiering: The Signal Quality Mode input determines how strictly these three conditions must be met. 'Supreme' mode, for example, might require not only that the conditions are met, but that the Market Coherence is exceptionally high and the interaction with the Node is accompanied by a significant volume spike.
Signal Spacing: A final filter ensures that signals are spaced by a minimum number of bars, preventing over-alerting in a single move.
🚀 ADVANCED TRADING STRATEGIES
The Primary Confluence Strategy: The intended use of the system. Wait for a Tier 1 (Elite/Supreme) or Tier 2 (Professional/Elite) signal to appear on the chart. This represents the alignment of all three pillars. Enter after the signal bar closes, with a stop-loss placed logically on the other side of the Harmonic Node that triggered the signal.
The Coherence Context Strategy: Use the Coherence Engine as a standalone market filter. When Coherence is high (>70%), favor trend-following strategies. When Coherence is low (<50%), avoid new directional trades or favor range-bound strategies. A sharp drop in Coherence during a trend can be an early warning of a trend's exhaustion.
Node-to-Node Trading: In a high-coherence environment, use the Harmonic Liquidity Nodes as both entry points and profit targets. For example, after a BUY signal is generated at one Node, the next Node above it becomes a logical first profit target.
⚖️ RESPONSIBLE USAGE AND LIMITATIONS
Decision Support, Not a Crystal Ball: Aetherium is an advanced decision-support tool. It is designed to identify high-probability conditions based on a model of institutional behavior. It does not predict the future.
Risk Management is Paramount: No indicator can replace a sound risk management plan. Always use appropriate position sizing and stop-losses. The signals provided are probabilistic, not certainties.
Past Performance Disclaimer: The market models used in this script are based on historical data. While robust, there is no guarantee that these patterns will persist in the future. Market conditions can and do change.
Not a "Set and Forget" System: The indicator performs best when its user understands the concepts behind the three pillars. Use the dashboard and visual cues to build a comprehensive view of the market before acting on a signal.
Backtesting is Essential: Before applying this tool to live trading, it is crucial to backtest and forward-test it on your preferred instruments and timeframes to understand its unique behavior and characteristics.
🔮 CONCLUSION
The Aetherium Institutional Market Resonance Engine represents a paradigm shift from single-variable analysis to a holistic, multi-pillar framework. By quantifying the abstract concepts of market context, location, and timing into a unified, logical system, it provides traders with an unprecedented lens into the mechanics of institutional market operations.
It is not merely an indicator, but a complete analytical engine designed to foster a deeper understanding of market dynamics. By focusing on the core principles of institutional order flow, Aetherium empowers traders to filter out market noise, identify key structural levels, and time their entries in harmony with the market's underlying rhythm.
"In all chaos there is a cosmos, in all disorder a secret order." - Carl Jung
— Dskyz, Trade with insight. Trade with confluence. Trade with Aetherium.

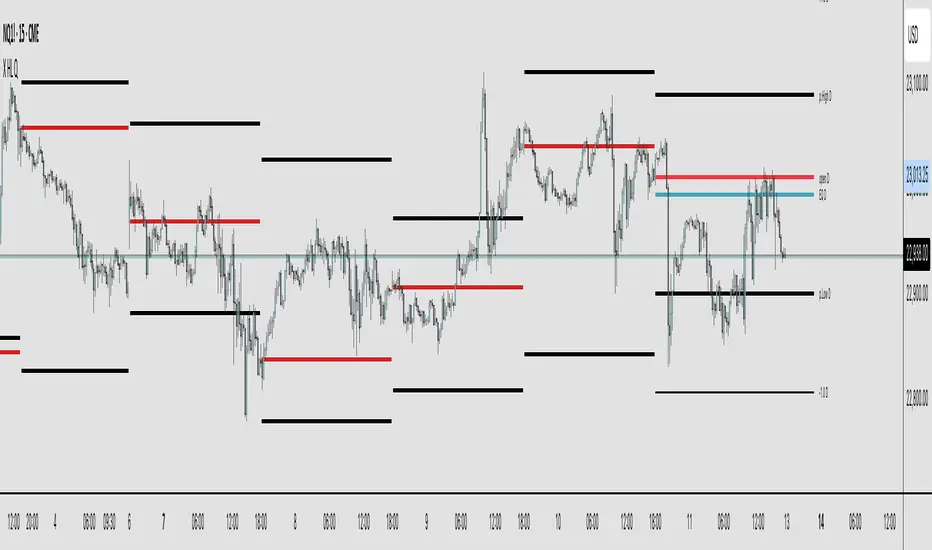
X HL QA market structure tool designed to frame price action within a defined context of prior session dynamics. It accomplishes this by anchoring a set of reference levels to the high, low, and open prices of a user-specified higher timeframe (e.g., 4H, 1D, etc.) and projecting those levels onto the current chart for ongoing analysis.
At its core, the indicator establishes a reference range—derived from the previous completed instance of the selected timeframe—and overlays this on the current timeframe. This range serves as a foundational structure for price interpretation in the current session.
Building upon this framework, the script constructs a set of symmetrical quadrants (or deviation zones) both inside and outside of the prior range. These include:
The midpoint (EQ) of the prior range
Levels at ±0.25x, ±0.75x, ±1.0x, ±1.5x, and ±2.0x the range height
These levels act as contextual zones that traders can use to interpret price behavior—whether it's consolidating within the prior range, approaching fair value (EQ), or expanding into directional continuation or reversal zones beyond the range.
The script operates in both real-time and historical contexts. On live bars, it dynamically updates the key levels to provide an evolving view of current price positioning. Simultaneously, it supports the display of historical levels for past sessions, enabling robust backtesting and comparative analysis of price behavior relative to previous quadrant structures.
Ultimately, this tool serves as a positional map, helping traders assess where price is trading relative to significant levels from the prior session, offering insights into potential support/resistance, overextension, or mean reversion scenarios.
Key Technical Features
Multi-Timeframe Support:
request.security() is used to pull data from a user-defined higher timeframe regardless of the current chart interval.
Visual Flexibility:
Toggle between "line" and "channel" mode.
Line color, width, and visibility are all user-controlled.
Anchoring Options:
Deviation levels can be calculated from either the previous period's open or its EQ (midpoint), giving flexibility depending on analytical preference.
Efficient Labeling:
Labels are only rendered on the last bar and are automatically cleared and redrawn to prevent duplication.
Label style, size, text color, and background color are all user-configurable.
Trading Application
This indicator is especially suited for:
1. Mean Reversion Strategies
When price moves beyond +1.0 or +1.5 deviations from the EQ or open, it may signal overextension and a potential snap back to the midpoint or range.
2. Breakout Confirmation
Sustained price action beyond ±1.0 levels may indicate trend strength or continuation beyond historical balance zones.
3. Contextual Range Awareness
EQ and Open provide structure from which traders can judge whether price is in a state of balance or imbalance.
Labels offer at-a-glance interpretation of key levels across any chosen timeframe.
4. Fractal and Multi-Session Analysis
Analysts can layer daily, weekly, and monthly versions of this indicator to observe confluence or divergence of higher timeframe structure.
Liquidity Point LinesLiquidity Point Lines
The "Liquidity Point Lines" indicator helps traders identify potential areas of liquidity in the market by drawing lines at specific price levels where significant "liquidation events" may have occurred. These events are determined by analyzing the MACD Histogram and identifying pivot points that suggest strong movements, which are often associated with the flushing out of short or long positions.
How It Works
This indicator leverages the MACD Histogram to gauge the strength of price momentum. It then identifies pivot highs and lows within the MACD Histogram's values. When a significant pivot is detected, the indicator interprets this as a potential "liquidity point" — a price level where a substantial amount of buy or sell orders (often due to liquidations) may have been executed.
The indicator distinguishes between:
Shorts Liquidation Points (Resistance): These are identified when the MACD Histogram registers a pivot high, suggesting a strong upward movement that could have liquidated short positions. Lines are drawn at the high price of the bar where this pivot occurred.
Longs Liquidation Points (Support): Conversely, these are identified when the MACD Histogram registers a pivot low, indicating a strong downward movement that might have liquidated long positions. Lines are drawn at the low price of the bar where this pivot occurred.
Key Features and Settings
The "Liquidity Point Lines" indicator offers extensive customization to tailor its sensitivity and visual representation:
MACD Settings for Liquidity: Configure the underlying MACD calculation with adjustable Fast Length, Slow Length, Source, Signal Smoothing, and MA Types (SMA/EMA) for both the Oscillator and Signal Line.
Liquidity Points Settings:
Pivot Lookback Left/Right: Define the number of bars to look back on either side to identify a pivot in the MACD Histogram.
Dynamic Strength Thresholds: This powerful feature allows the indicator to dynamically calculate the significance of a liquidation event. When enabled, it uses the average absolute histogram value over a specified Dynamic Threshold Lookback Period and applies Small and Medium Threshold Factors to determine the strength (Small, Medium, or Large) of the liquidity point.
Fixed Strength Thresholds: If dynamic thresholds are disabled, you can set fixed numerical values for Small and Medium Histogram Thresholds to define the strength categories.
Color & Style Customization: Assign distinct colors for Small, Medium, and Large liquidation points, choose the Line Style (Solid, Dashed, Dotted), and set the Label Text Color.
Label X Offset (To Right): Adjust the horizontal position of the liquidity point labels on your chart.
Liquidity Points Management:
Max Active Liquidity Lines: Control the maximum number of liquidity lines displayed simultaneously on your chart. Older lines are automatically removed to maintain clarity, except for lines that have been "touched" (i.e., price has interacted with that liquidity level).
Visual Interpretation
Each liquidity line is colored according to the strength of the detected liquidation event, making it easy to visually assess the potential significance of the price level. Lines extend to the right, serving as ongoing reference points. When the price interacts with a liquidity line (i.e., "touches" it), the line and its corresponding label are removed, indicating that the liquidity at that level may have been absorbed.
This indicator can be a valuable tool for identifying potential support and resistance levels, understanding market reactions to "liquidation cascades," and informing your trading decisions.

The Sequences of FibonacciThe Sequences of Fibonacci - Advanced Multi-Timeframe Confluence Analysis System
THEORETICAL FOUNDATION & MATHEMATICAL INNOVATION
The Sequences of Fibonacci represents a revolutionary approach to market analysis that synthesizes classical Fibonacci mathematics with modern adaptive signal processing. This indicator transcends traditional Fibonacci retracement tools by implementing a sophisticated multi-dimensional confluence detection system that reveals hidden market structure through mathematical precision.
Core Mathematical Framework
Dynamic Fibonacci Grid System:
Unlike static Fibonacci tools, this system calculates highest highs and lowest lows across true Fibonacci sequence periods (8, 13, 21, 34, 55 bars) creating a dynamic grid of mathematical support and resistance levels that adapt to market structure in real-time.
Multi-Dimensional Confluence Detection:
The engine employs advanced mathematical clustering algorithms to identify areas where multiple derived Fibonacci retracement levels (0.382, 0.500, 0.618) from different timeframe perspectives converge. These "Confluence Zones" are mathematically classified by strength:
- CRITICAL Zones: 8+ converging Fibonacci levels
- HIGH Zones: 6-7 converging levels
- MEDIUM Zones: 4-5 converging levels
- LOW Zones: 3+ converging levels
Adaptive Signal Processing Architecture:
The system implements adaptive Stochastic RSI calculations with dynamic overbought/oversold levels that adjust to recent market volatility rather than using fixed thresholds. This prevents false signals during changing market conditions.
COMPREHENSIVE FEATURE ARCHITECTURE
Quantum Field Visualization System
Dynamic Price Field Mathematics:
The Quantum Field creates adaptive price channels based on EMA center points and ATR-based amplitude calculations, influenced by the Unified Field metric. This visualization system helps traders understand:
- Expected price volatility ranges
- Potential overextension zones
- Mathematical pressure points in market structure
- Dynamic support/resistance boundaries
Field Amplitude Calculation:
Field Amplitude = ATR × (1 + |Unified Field| / 10)
The system generates three quantum levels:
- Q⁰ Level: 0.618 × Field Amplitude (Primary channel)
- Q¹ Level: 1.0 × Field Amplitude (Secondary boundary)
- Q² Level: 1.618 × Field Amplitude (Extreme extension)
Advanced Market Analysis Dashboard
Unified Field Analysis:
A composite metric combining:
- Price momentum (40% weighting)
- Volume momentum (30% weighting)
- Trend strength (30% weighting)
Market Resonance Calculation:
Measures price-volume correlation over 14 periods to identify harmony between price action and volume participation.
Signal Quality Assessment:
Synthesizes Unified Field, Market Resonance, and RSI positioning to provide real-time evaluation of setup potential.
Tiered Signal Generation Logic
Tier 1 Signals (Highest Conviction):
Require ALL conditions:
- Adaptive StochRSI setup (exiting dynamic OB/OS levels)
- Classic StochRSI divergence confirmation
- Strong reversal bar pattern (adaptive ATR-based sizing)
- Level rejection from Confluence Zone or Fibonacci level
- Supportive Unified Field context
Tier 2 Signals (Enhanced Opportunity Detection):
Generated when Tier 1 conditions aren't met but exceptional circumstances exist:
- Divergence candidate patterns (relaxed divergence requirements)
- Exceptionally strong reversal bars at critical levels
- Enhanced level rejection criteria
- Maintained context filtering
Intelligent Visualization Features
Fractal Matrix Grid:
Multi-layer visualization system displaying:
- Shadow Layer: Foundational support (width 5)
- Glow Layer: Core identification (width 3, white)
- Quantum Layer: Mathematical overlay (width 1, dotted)
Smart Labeling System:
Prevents overlap using ATR-based minimum spacing while providing:
- Fibonacci period identification
- Topological complexity classification (0, I, II, III)
- Exact price levels
- Strength indicators (○ ◐ ● ⚡)
Wick Pressure Analysis:
Dynamic visualization showing momentum direction through:
- Multi-beam projection lines
- Particle density effects
- Progressive transparency for natural flow
- Strength-based sizing adaptation
PRACTICAL TRADING IMPLEMENTATION
Signal Interpretation Framework
Entry Protocol:
1. Confluence Zone Approach: Monitor price approaching High/Critical confluence zones
2. Adaptive Setup Confirmation: Wait for StochRSI to exit adaptive OB/OS levels
3. Divergence Verification: Confirm classic or candidate divergence patterns
4. Reversal Bar Assessment: Validate strong rejection using adaptive ATR criteria
5. Context Evaluation: Ensure Unified Field provides supportive environment
Risk Management Integration:
- Stop Placement: Beyond rejected confluence zone or Fibonacci level
- Position Sizing: Based on signal tier and confluence strength
- Profit Targets: Next significant confluence zone or quantum field boundary
Adaptive Parameter System
Dynamic StochRSI Levels:
Unlike fixed 80/20 levels, the system calculates adaptive OB/OS based on recent StochRSI range:
- Adaptive OB: Recent minimum + (range × OB percentile)
- Adaptive OS: Recent minimum + (range × OS percentile)
- Lookback Period: Configurable 20-100 bars for range calculation
Intelligent ATR Adaptation:
Bar size requirements adjust to market volatility:
- High Volatility: Reduced multiplier (bars naturally larger)
- Low Volatility: Increased multiplier (ensuring significance)
- Base Multiplier: 0.6× ATR with adaptive scaling
Optimization Guidelines
Timeframe-Specific Settings:
Scalping (1-5 minutes):
- Fibonacci Rejection Sensitivity: 0.3-0.8
- Confluence Threshold: 2-3 levels
- StochRSI Lookback: 20-30 bars
Day Trading (15min-1H):
- Fibonacci Rejection Sensitivity: 0.5-1.2
- Confluence Threshold: 3-4 levels
- StochRSI Lookback: 40-60 bars
Swing Trading (4H-1D):
- Fibonacci Rejection Sensitivity: 1.0-2.0
- Confluence Threshold: 4-5 levels
- StochRSI Lookback: 60-80 bars
Asset-Specific Optimization:
Cryptocurrency:
- Higher rejection sensitivity (1.0-2.5) for volatile conditions
- Enable Tier 2 signals for increased opportunity detection
- Shorter adaptive lookbacks for rapid market changes
Forex Major Pairs:
- Moderate sensitivity (0.8-1.5) for stable trending
- Focus on Higher/Critical confluence zones
- Longer lookbacks for institutional flow detection
Stock Indices:
- Conservative sensitivity (0.5-1.0) for institutional participation
- Standard confluence thresholds
- Balanced adaptive parameters
IMPORTANT USAGE CONSIDERATIONS
Realistic Performance Expectations
This indicator provides probabilistic advantages based on mathematical confluence analysis, not guaranteed outcomes. Signal quality varies with market conditions, and proper risk management remains essential regardless of signal tier.
Understanding Adaptive Features:
- Adaptive parameters react to historical data, not future market conditions
- Dynamic levels adjust to past volatility patterns
- Signal quality reflects mathematical alignment probability, not certainty
Market Context Awareness:
- Strong trending markets may produce fewer reversal signals
- Range-bound conditions typically generate more confluence opportunities
- News events and fundamental factors can override technical analysis
Educational Value
Mathematical Concepts Introduced:
- Multi-dimensional confluence analysis
- Adaptive signal processing techniques
- Dynamic parameter optimization
- Mathematical field theory applications in trading
- Advanced Fibonacci sequence applications
Skill Development Benefits:
- Understanding market structure through mathematical lens
- Recognition of multi-timeframe confluence principles
- Appreciation for adaptive vs. static analysis methods
- Integration of classical Fibonacci with modern signal processing
UNIQUE INNOVATIONS
First-Ever Implementations
1. True Fibonacci Sequence Periods: First indicator using authentic Fibonacci numbers (8,13,21,34,55) for timeframe analysis
2. Mathematical Confluence Clustering: Advanced algorithm identifying true Fibonacci level convergence
3. Adaptive StochRSI Boundaries: Dynamic OB/OS levels replacing fixed thresholds
4. Tiered Signal Architecture: Democratic signal weighting with quality classification
5. Quantum Field Price Visualization: Mathematical field representation of price dynamics
Visualization Breakthroughs
- Multi-Layer Fibonacci Grid: Three-layer rendering with intelligent spacing
- Dynamic Confluence Zones: Strength-based color coding and sizing
- Adaptive Parameter Display: Real-time visualization of dynamic calculations
- Mathematical Field Effects: Quantum-inspired price channel visualization
- Progressive Transparency Systems: Natural visual flow without chart clutter
COMPREHENSIVE DASHBOARD SYSTEM
Multi-Size Display Options
Small Dashboard: Core metrics for mobile/limited screen space
Normal Dashboard: Balanced information density for standard desktop use
Large Dashboard: Complete analysis suite including adaptive parameter values
Real-Time Metrics Tracking
Market Analysis Section:
- Unified Field strength with visual meter
- Market Resonance percentage
- Signal Quality assessment with emoji indicators
- Market Bias classification (Bullish/Bearish/Neutral)
Confluence Intelligence:
- Total active zones count
- High/Critical zone identification
- Nearest zone distance and strength
- Price-to-zone ATR measurement
Adaptive Parameters (Large Dashboard):
- Current StochRSI OB/OS levels
- Active ATR multiplier for bar sizing
- Volatility ratio for adaptive scaling
- Real-time StochRSI positioning
TECHNICAL SPECIFICATIONS
Pine Script Version: v5 (Latest)
Calculation Method: Real-time with confirmed bar processing
Maximum Objects: 500 boxes, 500 lines, 500 labels
Dashboard Positions: 4 corner options with size selection
Visual Themes: Quantum, Holographic, Crystalline, Plasma
Alert Integration: Complete alert system for all signal types
Performance Optimizations:
- Efficient confluence zone calculation using advanced clustering
- Smart label spacing prevents overlap
- Progressive transparency for visual clarity
- Memory-optimized array management
EDUCATIONAL FRAMEWORK
Learning Progression
Beginner Level:
- Understanding Fibonacci sequence applications
- Recognition of confluence zone concepts
- Basic signal interpretation
- Dashboard metric comprehension
Intermediate Level:
- Adaptive parameter optimization
- Multi-timeframe confluence analysis
- Signal quality assessment techniques
- Risk management integration
Advanced Level:
- Mathematical field theory applications
- Custom parameter optimization strategies
- Market regime adaptation techniques
- Professional trading system integration
DEVELOPMENT ACKNOWLEDGMENT
Special acknowledgment to @AlgoTrader90 - the foundational concepts of this system came from him and we developed it through a collaborative discussions about multi-timeframe Fibonacci analysis. While the original framework came from AlgoTrader90's innovative approach, this implementation represents a complete evolution of the logic with enhanced mathematical precision, adaptive parameters, and sophisticated signal filtering to deliver meaningful, actionable trading signals.
CONCLUSION
The Sequences of Fibonacci represents a quantum leap in technical analysis, successfully merging classical Fibonacci mathematics with cutting-edge adaptive signal processing. Through sophisticated confluence detection, intelligent parameter adaptation, and comprehensive market analysis, this system provides traders with unprecedented insight into market structure and potential reversal points.
The mathematical foundation ensures lasting relevance while the adaptive features maintain effectiveness across changing market conditions. From the dynamic Fibonacci grid to the quantum field visualization, every component reflects a commitment to mathematical precision, visual elegance, and practical utility.
Whether you're a beginner seeking to understand market confluence or an advanced trader requiring sophisticated analytical tools, this system provides the mathematical framework for informed decision-making based on time-tested Fibonacci principles enhanced with modern computational techniques.
Trade with mathematical precision. Trade with the power of confluence. Trade with The Sequences of Fibonacci.
"Mathematics is the language with which God has written the universe. In markets, Fibonacci sequences reveal the hidden harmonies that govern price movement, and those who understand these mathematical relationships hold the key to anticipating market behavior."
* Galileo Galilei (adapted for modern markets)
— Dskyz, Trade with insight. Trade with anticipation.

Previous Daily High/LowThe previous day’s high and low are critical price levels that traders use to identify potential support, resistance, and intraday trading opportunities. These levels represent the highest and lowest prices reached during the prior trading session and often act as reference points for future price action.
Why Are Previous Daily High/Low Important?
Support & Resistance Zones
The previous day’s low often acts as support (buyers defend this level).
The previous day’s high often acts as resistance (sellers defend this level).
Breakout Trading
A move above the previous high suggests bullish momentum.
A move below the previous low suggests bearish momentum.
Mean Reversion Trading
Traders fade moves toward these levels, expecting reversals.
Example: Buying near the previous low in an uptrend.
Institutional Order Flow
Market makers and algos often reference these levels for liquidity.
How to Use Previous Daily High/Low in Trading
1. Breakout Strategy
Long Entry: Price breaks & closes above previous high → bullish continuation.
Short Entry: Price breaks & closes below previous low → bearish continuation.
2. Reversal Strategy
Long at Previous Low: If price pulls back to the prior day’s low in an uptrend.
Short at Previous High: If price rallies to the prior day’s high in a downtrend.
3. Range-Bound Markets
Buy near previous low, sell near previous high if price oscillates between them.
Example Trade Setup
Scenario: Price opens near the previous day’s high.
Bullish Case: A breakout above it targets next resistance.
Bearish Case: Rejection at the high signals a pullback.

Previous Daily OHLCPrevious Daily OHLC Indicator
Overview:
This professional TradingView indicator displays the previous day's key price levels (Open, High, Low, Close, and 50% midpoint) as horizontal lines on your chart. These levels are essential for traders who use previous day data as support and resistance zones in their technical analysis.
What It Does
Displays Previous Day Levels: Automatically shows horizontal lines for yesterday's OHLC data
Real-Time Updates: Lines update dynamically each new trading day
Fully Customizable: Complete control over which levels to display and how they appear
Smart Line Management: Choose between showing lines for recent bars or across the entire chart
Professional Labels: Clear labels with optional price values for each level
Color Coded System: Distinct colors for each level type for instant recognition
Key Features
Five Important Price Levels
Previous Day Open: Yesterday's opening price - often acts as psychological level
Previous Day High: Yesterday's highest price - key resistance level for breakout trading
Previous Day Low: Yesterday's lowest price - important support level for breakdowns
Previous Day Close: Yesterday's closing price - significant reference point
50% Midpoint: Calculated midpoint between previous day's high and low - bias indicator