Fakeout, Breakout & Trend Switch Detector - TrendPredator FOTrendPredator Fakeout Highlighter (FO)
The TrendPredator Fakeout Highlighter is designed to enhance multi-timeframe trend analysis by identifying key market behaviors that indicate trend strength, weakness, and potential reversals. Inspired by Stacey Burke’s trading approach, this tool focuses on trend-following, momentum shifts, and trader traps, helping traders capitalize on high-probability setups.
At its core, this indicator highlights peak formations—anchor points where price often locks in trapped traders before making decisive moves. These principles align with George Douglas Taylor’s 3-day cycle and Steve Mauro’s BTMM method, making the FO Highlighter a powerful tool for reading market structure. As markets are fractal, this analysis works on any timeframe.
How It Works
The TrendPredator FO highlights key price action signals by coloring candles based on their bias state on the current timeframe.
It tracks four major elements:
Breakout/Breakdown Bars – Did the candle close in a breakout or breakdown relative to the last candle?
Fakeout Bars (Trend Close) – Did the candle break a prior high/low and close back inside, but still in line with the trend?
Fakeout Bars (Counter-Trend Close) – Did the candle break a prior high/low, close back inside, and against the trend?
Switch Bars – Did the candle lose/ reclaim the breakout/down level of the last bar that closed in breakout/down, signalling a possible trend shift?
Reading the Trend with TrendPredator FO
The annotations in this example are added manually for illustration.
- Breakouts → Strong Trend
Multiple candles closing in breakout signal a healthy and strong trend.
- Fakeouts (Trend Close) → First Signs of Weakness
Candles that break out but close back inside suggest a potential slowdown—especially near key levels.
- Fakeouts (Counter-Trend Close) → Stronger Reversal Signal
Closing against the trend strengthens the reversal signal.
- Switch Bars → Momentum Shift
A shift in trend is confirmed when price crosses back through the last closed breakout candles breakout level, trapping traders and fuelling a move in the opposite direction.
- Breakdowns → Trend Reversal Confirmed
Once price breaks away from the peak formation, closing in breakdown, the trend shift is validated.
Customization & Settings
- Toggle individual candle types on/off
- Customize colors for each signal
- Set the number of historical candles displayed
Example Use Cases
1. Weekly Template Analysis
The weekly template is a core concept in Stacey Burke’s trading style. FO highlights individual candle states. With this the state of the trend and the developing weekly template can be evaluated precisely. The analysis is done on the daily timeframe and we are looking especially for overextended situations within a week, after multiple breakouts and for peak formations signalling potential reversals. This is helpful for thesis generation before a session and also for backtesting. The annotations in this example are added manually for illustration.
📈 Example: Weekly Template Analysis snapshot on daily timeframe
2. High Timeframe 5-Star Setup Analysis (Stacey Burke "ain't coming back" ACB Template)
This analysis identifies high-probability trade opportunities when daily breakout or down closes occur near key monthly levels mid-week, signalling overextensions and potentially large parabolic moves. Key signals for this are breakout or down closes occurring on a Wednesday. This is helpful for thesis generation before a session and also for backtesting. The annotations in this example are added manually for illustration. Also an indicator can bee seen on this chart shading every Wednesday to identify the signal.
📉 Example: High Timeframe Setup snapshot
3. Low Timeframe Entry Confirmation
FO helps confirm entry signals after a setup is identified, allowing traders to time their entries and exits more precisely. For this the highlighted Switch and/ or Fakeout bars can be highly valuable.
📊 Example (M15 Entry & Exit): Entry and Exit Confirmation snapshot
📊 Example (M5 Scale-In Strategy): Scaling Entries snapshot
The annotations in this examples are added manually for illustration.
Disclaimer
This indicator is for educational purposes only and does not guarantee profits.
None of the information provided shall be considered financial advice.
Users are fully responsible for their trading decisions and outcomes.
Search in scripts for "Fractal"

Cometreon_Public📚 Cometreon Public Library – Advanced Functions for Pine Script
This library contains advanced functions used in my public indicators on TradingView. The goal is to make the code more modular and efficient, allowing users to call pre-built functions for complex calculations without rewriting them from scratch.
🔹 Currently Available Functions:
1️⃣ Moving Average Function – Provides multiple types of moving averages to choose from, including:
SMA (Simple Moving Average)
EMA (Exponential Moving Average)
WMA (Weighted Moving Average)
RMA (Smoothed Moving Average)
HMA (Hull Moving Average)
JMA (Jurik Moving Average)
DEMA (Double Exponential Moving Average)
TEMA (Triple Exponential Moving Average)
LSMA (Least Squares Moving Average)
VWMA (Volume-Weighted Moving Average)
SMMA (Smoothed Moving Average)
KAMA (Kaufman’s Adaptive Moving Average)
ALMA (Arnaud Legoux Moving Average)
FRAMA (Fractal Adaptive Moving Average)
VIDYA (Variable Index Dynamic Average)
2️⃣ Custom RSI – Uses the Moving Average function to modify the calculation method, with an additional option for a dynamic version.
3️⃣ Custom MACD – Uses the Moving Average function to modify the calculation method, with an additional option for a dynamic version.
4️⃣ Custom Alligator – Uses the Moving Average function to modify generic calculations, allowing users to change the calculation method.

Market DNA: Structure, Volume, Range, and SessionsMarket DNA: Structure, Volume, Range, and Sessions**
The Market DNA indicator combines market structure, volume analysis, trading ranges, and global trading sessions into a single, comprehensive tool for traders. It helps identify key price levels, volume patterns, consolidation phases, and active market periods, enabling informed trading decisions.
Market Structure Detects swing highs and lows using `ta.pivothigh` and `ta.pivotlow`, plotting them as red/green triangles to highlight support/resistance and trend reversals.
- Fractal Volume Zones (FVG): Highlights areas of significant buying/selling pressure by comparing current volume to an average over a lookback period; high-volume zones are marked with a semi-transparent blue background.
- Trading Range: Defines a price channel using the Average True Range (ATR) and a multiplier, creating upper/lower bands to identify consolidation, breakouts, and potential trade levels.
- Market Sessions: Highlights major global trading sessions (Asia, Europe, US) with colored backgrounds (purple, teal, yellow) to indicate liquidity and volatility shifts.
How It Works
- Swing points help analyze trends and reversals.
- FVG confirms price movements with high volume for stronger signals.
- Trading range bands assist in identifying breakout opportunities and setting stops/take-profits.
- Session highlights allow traders to adapt strategies based on regional activity.
Customization
- Adjust `swing_length` for sensitivity in detecting turning points.
- Modify `volume_lookback` to control volume averaging.
- Tune `range_multiplier` for wider/narrower trading bands.
- Enable/disable session highlighting via `session_highlight`.
Use Cases
- Identify trends and key levels using swing points and FVG.
- Spot breakout opportunities with trading range bands.
- Adapt strategies to regional trading sessions for optimal timing.
This all-in-one indicator provides a clear, customizable view of the market, empowering traders to make data-driven decisions across asset classes and timeframes.

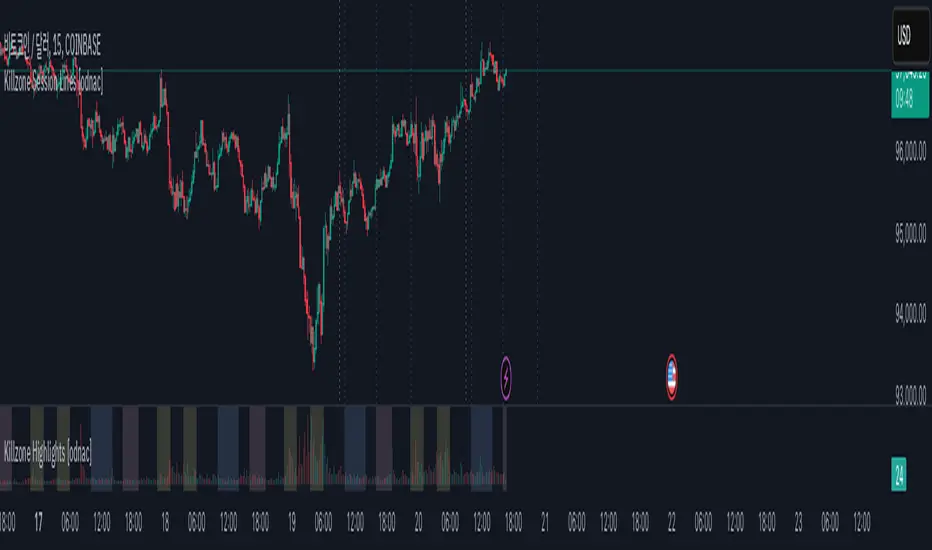
Killzone Session Lines [odnac]This Pine Script indicator displays vertical lines marking the start of key market sessions, known as Killzones, for both today and yesterday. These lines help traders identify important trading hours for the Asia, Europe, and New York sessions.
Killzone Vertical Lines:
Draws vertical lines for the start of the Asia, Europe, and New York sessions.
Displays lines for both today and the previous day to compare price action across sessions.
Customizable Time Settings:
Users can set the exact start hour and minute for each Killzone.
Time zones adjust automatically based on the chart's time zone.
Visual Customization:
Change the color, width, and style of the vertical lines (solid, dotted, dashed).
Toggle each session's lines individually for a cleaner chart.
Previous Start Lines:
Optional lines for the opening of today, the previous day, and the previous week, providing historical context for support and resistance levels.
Why Use This Indicator?
Session Awareness: Know exactly when major market sessions start to identify potential volatility spikes.
Historical Context: Compare today’s price action with previous sessions to spot recurring patterns.
Clean Charting: Automatic updates prevent clutter, keeping your workspace organized.
Flexible Customization: Tailor the display to fit your trading style and preferences.
Dynamic SL - 1 Pip (Up and Down)The Dynamic SL - 1 Pip Up and Down indicator creates two dynamic lines that follow the price at a distance of 1 pip above and below the closing price. This feature can be particularly useful for traders who want to visualize small stop-loss (SL) levels or track price movement in a highly responsive manner.
Unlike traditional stop-loss indicators, this script ensures that the lines only last for 5 seconds, keeping the chart clean and focusing only on the most relevant price movement.
Key Features
✔ Dynamic Stop-Loss Visualization:
The script draws a green line above the price (+1 pip).
A red line below the price (-1 pip) is also drawn.
✔ Auto-Clearing for a Clean Chart:
Each line lasts for 5 seconds only before automatically disappearing.
This prevents unnecessary clutter on the chart and ensures only the latest price movements are visualized.
✔ Adaptable to Multiple Assets:
Automatically calculates the pip size based on the instrument type:
Forex → Uses 0.0001 per pip.
Futures & Stocks → Uses the minimum tick size.
✔ Ideal for High-Frequency Traders & Scalpers:
Designed for 1-minute (M1) or lower timeframes where traders need to monitor price action closely.
Helps visualize ultra-tight stop-loss levels in scalping strategies.

EBL - Enigma BOS Logic: A Comprehensive Multi-Timeframe Trend anThe EBL (Enigma BOS Logic) script is designed for traders seeking an advanced and versatile tool for identifying market trends, breakouts, and critical price levels. This indicator leverages multi-timeframe analysis, trend filtering, and customizable guidance line settings to provide an all-in-one solution for informed trading decisions.
What Does EBL Do?
EBL identifies critical breakout levels (BOS - Break of Structure) on up to three selected timeframes and dynamically plots them as horizontal guidance lines. It combines these levels with trend analysis and user-defined filters to show only the most relevant data. The script offers flexibility to adapt to different trading styles, whether you're a scalper, day trader, or swing trader.
Key Features:
Multi-Timeframe Analysis:
Users can select three distinct timeframes (e.g., 4H, 30m, 15m).
Execution timeframe (e.g., 1m or 5m) overlays the lines from the selected higher timeframes for real-time precision.
Customizable Guidance Lines:
Define line length (horizontal bars) and choose whether lines extend to the current price.
Individual color settings for bullish and bearish lines.
Trend Detection Filter:
Automatically determines the overall market trend based on the 50-period SMA on each selected timeframe.
Displays only bullish lines during uptrends and bearish lines during downtrends.
Time-Limited Display:
Option to show only lines from the last three days, reducing clutter and focusing on recent price action.
Alerts:
Trigger alerts when price breaks above or below critical levels on any selected timeframe.
Users can choose to receive alerts only for specific timeframes.
How Does It Work?
Break of Structure (BOS):
The script captures key high and low levels on each selected timeframe.
Levels are dynamically updated as the market evolves.
Trend Filtering:
Trend direction is determined for each timeframe based on whether the close is above or below its 50-period SMA.
The overall trend combines signals from all three timeframes, providing a balanced and holistic view of the market.
User Control:
Customize everything: timeframes, colors, line behavior, and alert conditions.
Adjust filters to focus on your preferred time horizon (e.g., last 3 days).
How to Use:
Select up to three timeframes based on your trading strategy (e.g., 4H for macro view, 30m for intermediate trends, and 15m for precision).
Enable or disable the trend filter to control whether lines reflect the market's directional bias.
Configure alerts for breakout levels that align with your strategy.
Use the execution timeframe to see how higher timeframe levels interact with real-time price action.
Who Is It For?
This indicator is ideal for:
Trend Traders who want a clear view of directional bias across multiple timeframes.
Breakout Traders who need to identify key resistance and support levels dynamically.
Scalpers and Day Traders who require real-time precision by overlaying higher timeframe levels on lower execution timeframes.
Underlying Concepts:
Break of Structure (BOS): Highlights significant market pivot points, essential for identifying breakout opportunities.
Multi-Timeframe Confluence: Combines insights from various timeframes to create a balanced understanding of price behavior.
Trend Filtering: Ensures clarity by only displaying levels that align with the overall market direction.
EBL - Enigma BOS Logic is not just another breakout indicator. It is a comprehensive tool that combines multi-timeframe analysis, trend detection, and user-centric customization to empower traders with actionable insights. Whether you're analyzing macro trends or executing precision trades, EBL adapts to your strategy and provides clarity in the chaos of the market.

Twitter Model ICT [TradingFinder] MMXM ERL D + FVG + M15 MSS/SMT🔵 Introduction
The Twitter Model ICT is a trading approach based on ICT (Inner Circle Trader) models, focusing on price movement between external and internal liquidity in lower timeframes. This model integrates key concepts such as Market Structure Shift (MSS), Smart Money Technique (SMT) divergence, and CISD level break to identify precise entry points in the market.
The primary goal of this model is to determine key liquidity levels, such as the previous day’s high and low (PDH/PDL) and align them with the Fair Value Gap (FVG) in the 1-hour timeframe. The overall strategy involves framing trades around the 1H FVG and using the M15 Market Structure Shift (MSS) for entry confirmation.
The Twitter Model ICT is designed to utilize external liquidity levels, such as PDH/PDL, as key entry zones. The model identifies FVG in the 1-hour timeframe, which acts as a magnet for price movement. Additionally, traders confirm entries using M15 Market Structure Shift (MSS) and SMT divergence.
Bullish Twitter Model :
In a bullish setup, the price sweeps the previous day’s low (PDL), and after confirming reversal signals, buys are executed in internal liquidity zones. Conversely, in a bearish setup, the price sweeps the previous day’s high (PDH), and after confirming weakness signals, sells are executed.
Bearish Twitter Model :
In short setups, entries are only executed above the Midnight Open, while in long setups, entries are taken below the Midnight Open. Adhering to these principles allows traders to define precise entry and exit points and analyze price movement with greater accuracy based on liquidity and market structure.
🔵 How to Use
The Twitter Model ICT is a liquidity-based trading strategy that analyzes price movements relative to the previous day’s high and low (PDH/PDL) and Fair Value Gap (FVG). This model is applicable in both bullish and bearish directions and utilizes the 1-hour (1H) and 15-minute (M15) timeframes for entry confirmation.
The price first sweeps an external liquidity level (PDH or PDL) and then provides an entry opportunity based on Market Structure Shift (MSS) and SMT divergence. Additionally, the entry should be positioned relative to the Midnight Open, meaning long entries should occur below the Midnight Open and short entries above it.
🟣 Bullish Twitter Model
In a bullish setup, the price first sweeps the previous day’s low (PDL) and reaches an external liquidity level. Then, in the 1-hour timeframe (1H), a bullish Fair Value Gap (FVG) forms, which serves as the price target.
To confirm the entry, a Market Structure Shift (MSS) in the 15-minute timeframe (M15) should be observed, signaling a trend reversal to the upside. Additionally, SMT divergence with correlated assets can indicate weakness in selling pressure.
Under these conditions, a long position is taken below the Midnight Open, with a stop-loss placed at the lowest point of the recent bearish move. The price target for this trade is the FVG in the 1-hour timeframe.
🟣 Bearish Twitter Model
In a bearish setup, the price first sweeps the previous day’s high (PDH) and reaches an external liquidity level. Then, in the 1-hour timeframe (1H), a bearish Fair Value Gap (FVG) is identified, serving as the trade target.
To confirm entry, a Market Structure Shift (MSS) in the 15-minute timeframe (M15) should form, signaling a trend shift to the downside. If an SMT divergence is present, it can provide additional confirmation for the trade.
Once these conditions are met, a short position is taken above the Midnight Open, with a stop-loss placed at the highest level of the recent bullish move. The trade's price target is the FVG in the 1-hour timeframe.
🔵 Settings
Bar Back Check : Determining the return of candles to identify the CISD level.
CISD Level Validity : CISD level validity period based on the number of candles.
Daily Position : Determines whether only the first signal of the day is considered or if signals are evaluated throughout the entire day.
Session : Specifies in which trading sessions the indicator will be active.
Second Symbol : This setting allows you to select another asset for comparison with the primary asset. By default, "XAUUSD" (Gold) is set as the second symbol, but you can change it to any currency pair, stock, or cryptocurrency. For example, you can choose currency pairs like EUR/USD or GBP/USD to identify divergences between these two assets.
Divergence Fractal Periods : This parameter defines the number of past candles to consider when identifying divergences. The default value is 2, but you can change it to suit your preferences. This setting allows you to detect divergences more accurately by selecting a greater number of candles.
The indicator allows displaying sessions based on various time zones. The user can select one of the following options :
UTC (Coordinated Universal Time)
Local Time of the Session
User’s Local Time
Show Open Price : Displays the New York market opening price.
Show PDH / PDL : Displays the previous day’s high and low to identify potential entry points.
Show SMT Divergence : Displays lines and labels for bullish ("+SMT") and bearish ("-SMT") divergences.
🔵 Conclusion
The Twitter Model ICT is an effective approach for analyzing and executing trades in financial markets, utilizing a combination of liquidity principles, market structure, and SMT confirmations to identify optimal entry and exit points.
By analyzing the previous day’s high and low (PDH/PDL), Fair Value Gaps (FVG), and Market Structure Shift (MSS) in the 1H and M15 timeframes, traders can pinpoint liquidity-driven trade opportunities. Additionally, considering the Midnight Open level helps traders avoid random entries and ensures better trade placement.
By applying this model, traders can interpret market movements based on liquidity flow and structural changes, allowing them to fine-tune their trading decisions with higher precision. Ultimately, the Twitter Model ICT provides a structured and logical approach for traders who seek to trade based on liquidity behavior and trend shifts in the market.

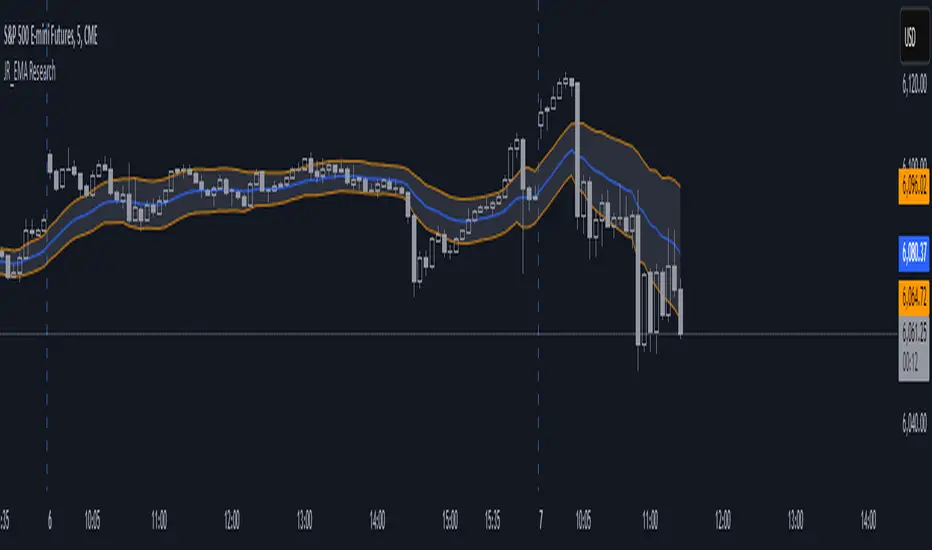
EMA Study Script for Price Action Traders, v2JR_EMA Research Tool Documentation
Version 2 Enhancements
Version 2 of the JR_EMA Research Tool introduces several powerful features that make it particularly valuable for studying price action around Exponential Moving Averages (EMAs). The key improvements focus on tracking and analyzing price-EMA interactions:
1. Cross Detection and Counting
- Implements flags for crossing bars that instantly identify when price crosses above or below the EMA
- Maintains running counts of closes above and below the EMA
- This feature helps students understand the persistence of trends and the frequency of EMA interactions
2. Bar Number Tracking
- Records the specific bar number when EMA crosses occur
- Stores the previous crossing bar number for reference
- Enables precise measurement of time between crosses, helping identify typical trend durations
3. Variable Reset Management
- Implements sophisticated reset logic for all counting variables
- Ensures accuracy when analyzing multiple trading sessions
- Critical for maintaining clean data when studying patterns across different timeframes
4. Cross Direction Tracking
- Monitors the direction of the last EMA cross
- Helps students identify the current trend context
- Essential for understanding trend continuation vs reversal scenarios
Educational Applications
Price-EMA Relationship Studies
The tool provides multiple ways to study how price interacts with EMAs:
1. Visual Analysis
- Customizable EMA bands show typical price deviation ranges
- Color-coded fills help identify "normal" vs "extreme" price movements
- Three different band calculation methods offer varying perspectives on price volatility
2. Quantitative Analysis
- Real-time tracking of closes above/below EMA
- Running totals help identify persistent trends
- Cross counting helps understand typical trend duration
Research Configurations
EMA Configuration
- Adjustable EMA period for studying different trend timeframes
- Customizable EMA color for visual clarity
- Ideal for comparing different EMA periods' effectiveness
Bands Configuration
Three distinct calculation methods:
1. Full Average Bar Range (ABR)
- Uses the entire range of price movement
- Best for studying overall volatility
2. Body Average Bar Range
- Focuses on the body of the candle
- Excellent for studying conviction in price moves
3. Standard Deviation
- Traditional statistical approach
- Useful for comparing to other technical studies
Signal Configuration
- Optional signal plotting for entry/exit studies
- Helps identify potential trading opportunities
- Useful for backtesting strategy ideas
Using the Tool for Study
Basic Analysis Steps
1. Start with the default 20-period EMA
2. Observe how price interacts with the EMA line
3. Monitor the data window for quantitative insights
4. Use band settings to understand normal price behavior
Advanced Analysis
1. Pattern Recognition
- Use the cross counting system to identify typical pattern lengths
- Study the relationship between cross frequency and trend strength
- Compare different timeframes for fractal analysis
2. Volatility Studies
- Compare different band calculation methods
- Identify market regimes through band width changes
- Study the relationship between volatility and trend persistence
3. Trend Analysis
- Use the closing price count system to measure trend strength
- Study the relationship between trend duration and subsequent reversals
- Compare different EMA periods for optimal trend following
Best Practices for Research
1. Systematic Approach
- Start with longer timeframes and work down
- Document observations about price behavior in different market conditions
- Compare results across multiple symbols and timeframes
2. Data Collection
- Use the data window to record significant events
- Track the number of bars between crosses
- Note market conditions when signals appear
3. Optimization Studies
- Test different EMA periods for your market
- Compare band calculation methods for your trading style
- Document which settings work best in different market conditions
Technical Implementation Notes
This tool is particularly valuable for educational purposes because it combines visual and quantitative analysis in a single interface, allowing students to develop both intuitive and analytical understanding of price-EMA relationships.
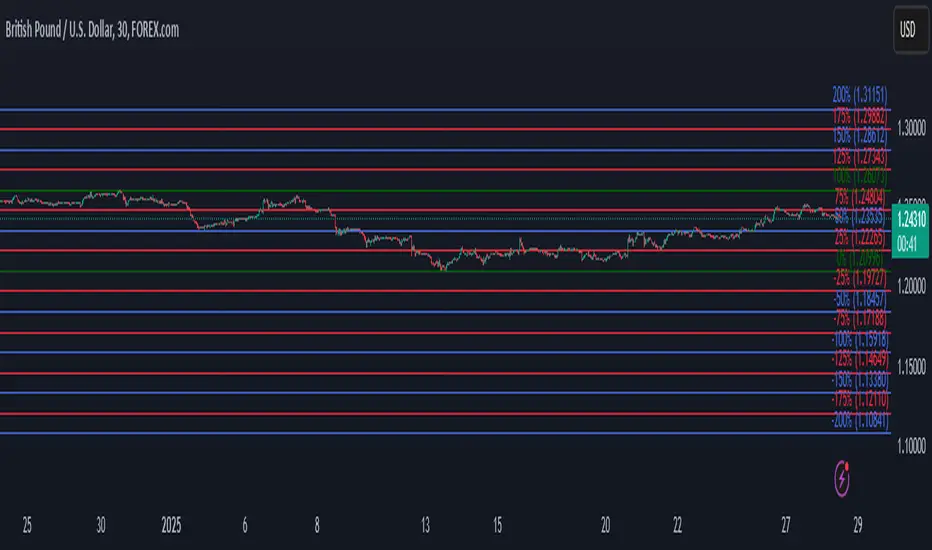
Automatic Fibonacci retracement based on the highest high and loThe chart is fractal, meaning that what happens can always be broken down into smaller portions.
This is often seen in various AR (Algorithmic Rules) concepts, such as breakers, order blocks, etc., where the price reacts.
I’ve visualized this behavior with this indicator.
This indicator takes the highest high and the lowest low from the past 5 weeks, excluding the current week.
The lowest low will represent 0%, and the highest high will represent 100% (green lines).
It then divides this range into 25%, 50%, 75%, and 100% levels (red and blue lines).
The indicator works on all charts and all timeframes, automatically adjusting when you switch charts or timeframes. No manual input is required.
Additionally, above 100%, it will create levels at 125%, 150%, 175%, and 200%, while below 0%, it will create levels at -25%, -50%, -75%, and -100%.
Your chart will now be divided into these 25% levels, allowing you to observe how the price either respects or breaks through them.
Again, this isn’t something “groundbreaking,” but simply a visual aid to identify levels where the price finds support/resistance or breaks through.
It helps me gain a broader perspective and determine whether my trade is moving in the right direction or if I should remain cautious.
Combo The "Combo" Indicator is a visual tool for TradingView that allows traders to clearly display their analysis based on OrderBloque concepts.
Key points to understand:
The indicator does NOT perform automatic market analysis
It serves as a configurable visualization tool for your personal analysis
Key Features:
Manual Configuration: You select a timeframe and function for each variable (V1 to V4)
Function Options:
VC (Volume Confirmation)
FP (Fractal Point)
LI (Liquidity)
EX (Execution)
Combinations like VC, VC, VC (EX)
Timeframe Range: Selectable from 5 minutes to 1 month
Tabular Display: Shows your inputs in a clear table on the chart
Customizable Appearance: Adjustable table position, colors, and text size

MultiTime Stochastics ProMultiTime Stochastics Pro
This indicator is an enhanced version of the stochastic indicator, featuring two separate stochastics. This functionality allows you to adjust the settings and time frame for each stochastic individually, enabling a more precise analysis of market fluctuations.
The Double Stochastic indicator enables you to simultaneously analyze the market in different time frames with two separate stochastics. One of the standout features of this indicator is that when the chart's time frame changes, each stochastic is displayed according to the time set for it and does not change in other time frames. This feature provides greater flexibility and accuracy in market analysis.
How the Indicator Works
This indicator calculates two separate stochastics:
The first stochastic (K1 and D1) with its own specific time frame and settings.
The second stochastic (K2 and D2) with a different time frame and settings.
These two stochastics are displayed simultaneously on one chart, and overbought and oversold lines are also included.
How to Use
Parameter Adjustment : Adjust the parameters K1 Length, D1 Smoothing, and K1 Time Frame as desired. Do the same for the second stochastic.
Signal Analysis : Analyze buy and sell signals based on the stochastic values and the overbought and oversold lines.
Advantages
Greater Precision : With two separate stochastics, you can follow market fluctuations with greater accuracy.
Flexibility : The ability to individually set the time frame and parameters for each stochastic makes this indicator highly flexible.
Stronger Signals : The simultaneous display of two stochastics allows you to receive stronger buy and sell signals.
Multi-time frame Analysis : The ability to analyze the market in different time frames simultaneously.
This indicator is suitable for traders seeking more precise and flexible market analysis tools. I hope these explanations help you publish your indicator in the best possible way!

ENIGMA Signals with Retests Select higher Time FrameENIGMA Signals with Retests – Script Description
The "ENIGMA Signals with Retests" script is a unique indicator designed for traders who prefer precision trading based on price action retests of key levels derived from higher timeframes. This tool is ideal for those employing multi-timeframe analysis strategies, helping them detect high-probability trade entries when the price interacts with significant support and resistance levels.
What Does This Script Do?
This indicator identifies key levels from a higher timeframe selected by the user (e.g., 4-hour or daily), then tracks price action on lower timeframes to provide actionable buy and sell signals when the price retests these levels. It visually plots the key levels on the chart and triggers alerts for potential trade opportunities when conditions are met.
How It Works
Key Level Detection:
The script uses custom functions to detect recent swing highs and swing lows on the selected higher timeframe (such as 4H or Daily). These levels represent potential areas of support and resistance where price reactions are likely to occur.
Multi-Timeframe Analysis:
The indicator leverages the request.security() function to retrieve price data from the user-defined higher timeframe and plots horizontal lines on the chart for the most recent swing highs and lows.
Retest-Based Signals:
Once the key levels are plotted, the script continuously monitors the price on the lower timeframe:
A Buy Signal is triggered when the price closes below a key high level and then moves back above it, indicating a potential bullish retest.
A Sell Signal is triggered when the price closes above a key low level and then moves back below it, indicating a potential bearish retest.
These retest signals are displayed as green and red arrows on the chart, helping traders identify optimal entry points.
Alerts for Retests:
The script includes built-in alert conditions that notify traders when a valid retest signal occurs. This allows traders to react promptly without constantly monitoring the chart.
How to Use the Script
Select Your Key Timeframe:
From the input settings, choose a higher timeframe that suits your trading style (e.g., 4H for intraday trading or Daily for swing trading).
Adjust Visual Preferences:
Customize the line style (solid, dashed, or dotted) and length of the plotted levels.
Toggle labels for the levels on or off as per your preference.
Trade Execution:
Once a retest signal appears on the lower timeframe, consider entering a trade in the direction of the signal. The buy signal suggests a potential long entry, while the sell signal indicates a potential short entry.
Set Alerts:
Use the alert conditions provided to get notified whenever a valid retest occurs. This helps in reducing screen time and improving trading efficiency.
Underlying Concepts
This script is grounded in the principles of support and resistance, retests, and breakout trading. By focusing on multi-timeframe key levels, it aligns with widely used trading concepts like:
Breakout and Retest: Entering trades after a confirmed breakout and successful retest of a significant level.
Swing Highs and Lows: Recognizing swing points to identify strong price reaction zones.
Multi-Timeframe Confluence: Enhancing trade probability by ensuring that the signals on lower timeframes correspond with key levels from higher timeframes.
Why This Script Is Unique
Unlike many generic trend-following or scalping indicators, "ENIGMA Signals with Retests" offers:
Precision Signals: It only provides signals when specific retest conditions are met, reducing false signals and noise.
Multi-Timeframe Customization: Users can tailor the higher timeframe to their strategy, making it versatile for various trading styles.
Alert Functionality: Alerts are integrated, allowing traders to stay updated without constantly monitoring the charts.
This script is perfect for traders looking for a systematic way to trade retests of key levels across multiple timeframes. Whether you're a scalper, day trader, or swing trader, "ENIGMA Signals with Retests" can help improve your precision and timing in the market.

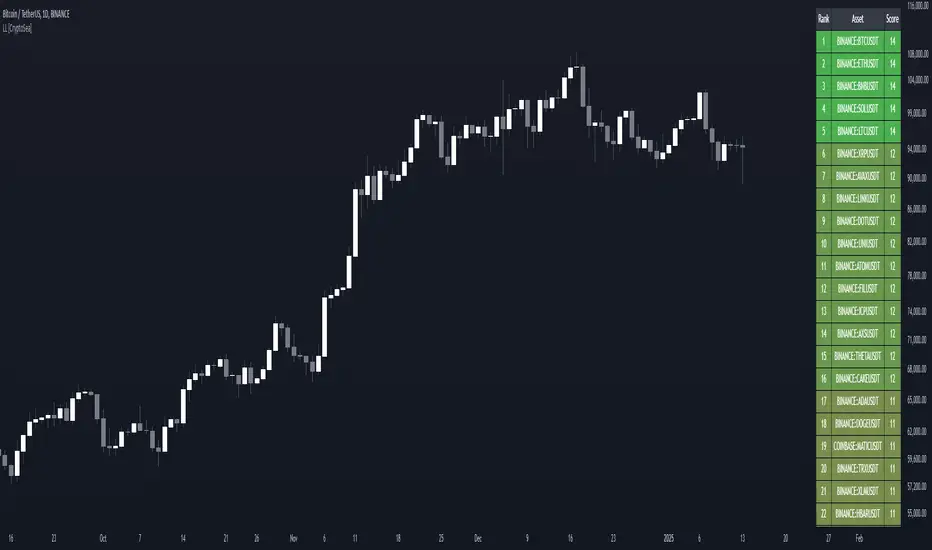
Lead-Lag Market Detector [CryptoSea]The Lead-Lag Market Detector is an advanced tool designed to help traders identify leading and lagging assets within a chosen market. This indicator leverages correlation analysis to rank assets based on their influence, making it ideal for traders seeking to optimise their portfolio or spot key market trends.
Key Features
Dynamic Asset Ranking: Utilises real-time correlation calculations to rank assets by their influence on the market, helping traders identify market leaders and laggers.
Customisable Parameters: Includes adjustable lookback periods and correlation thresholds to adapt the analysis to different market conditions and trading styles.
Comprehensive Asset Coverage: Supports up to 30 assets, offering broad market insights across cryptocurrencies, stocks, or other markets.
Gradient-Enhanced Table Display: Presents results in a colour-coded table, where assets are ranked dynamically with influence scores, aiding in quick visual analysis.
In the example below, the ranking highlights how assets tend to move in groups. For instance, BTCUSDT, ETHUSDT, BNBUSDT, SOLUSDT, and LTCUSDT are highly correlated and moving together as a group. Similarly, another group of correlated assets includes XRPUSDT, FILUSDT, APEUSDT, XTZUSDT, THETAUSDT, and CAKEUSDT. This grouping of assets provides valuable insights for traders to diversify or spread exposure.
If you believe one asset in a group is likely to perform well, you can spread your exposure into other correlated assets within the same group to capitalise on their collective movement. Additionally, assets like AVAXUSDT and ZECUSDT, which appear less correlated or uncorrelated with the rest, may offer opportunities to act as potential hedges in your trading strategy.
How it Works
Correlation-Based Scoring: Calculates pairwise correlations between assets over a user-defined lookback period, identifying assets with high influence scores as market leaders.
Customisable Thresholds: Allows traders to define a correlation threshold, ensuring the analysis focuses only on significant relationships between assets.
Dynamic Score Calculation: Scores are updated dynamically based on the timeframe and input settings, providing real-time insights into market behaviour.
Colour-Enhanced Results: The table display uses gradients to visually distinguish between leading and lagging assets, simplifying data interpretation.
Application
Portfolio Optimisation: Identifies influential assets to help traders allocate their portfolio effectively and reduce exposure to lagging assets.
Market Trend Identification: Highlights leading assets that may signal broader market trends, aiding in strategic decision-making.
Customised Trading Strategies: Adapts to various trading styles through extensive input settings, ensuring the analysis meets the specific needs of each trader.
The Lead-Lag Market Detector by is an essential tool for traders aiming to uncover market leaders and laggers, navigate complex market dynamics, and optimise their trading strategies with precision and insight.
ELC Indicator**ELC Indicator – Enigma Liquidity Concept**
The ELC Indicator is a cutting-edge tool designed for traders who want to leverage price action and liquidity concepts for high-precision trading opportunities. Unlike conventional indicators that rely purely on trend-following or oscillatory methods, ELC incorporates a unique combination of market structure, Fibonacci retracement levels, and dynamic EMA filtering to detect key buy and sell zones. This original approach helps traders capture the most relevant market movements and anticipate potential reversals with higher confidence.
---
### **What the ELC Indicator Does**
The primary goal of the ELC Indicator is to identify liquidity zones and plot Fibonacci-based levels around detected buy or sell signals. It continuously monitors price action to identify instances where significant liquidity grabs occur, signaled by breakouts beyond recent highs or lows. Once a signal is detected, the indicator plots horizontal lines at key Fibonacci ratios (0%, 25%, 50%, 75%, 100%, 120%, and 180%) to give traders a clear visual framework for potential retracement or extension levels.
Additionally, the indicator includes a dynamic EMA filter, which ensures that buy signals are only triggered when the price is above the EMA and sell signals when the price is below the EMA. This filtering mechanism helps reduce false signals in choppy markets and aligns trades with the broader trend direction.
---
### **Key Features**
1. **Buy & Sell Signals**
- Buy signals are generated when a liquidity grab occurs below the previous low, and the closing price is above the candle body midpoint and the EMA.
- Sell signals are triggered when a liquidity grab occurs above the previous high, and the closing price is below the candle body midpoint and the EMA.
- Visual cues are provided via small upward (green) and downward (red) triangles on the chart.
2. **Fibonacci Levels**
- For each buy or sell signal, the indicator plots multiple horizontal lines at key Fibonacci levels. These levels can help traders set realistic profit targets and stop-loss levels.
- The plotted lines can be customized in terms of style (solid, dotted, dashed) and color (buy and sell line colors).
3. **Dynamic EMA Filtering**
- A customizable EMA filter is integrated into the logic to align trades with the prevailing trend.
- The EMA length is adjustable, allowing traders to fine-tune the indicator based on their trading style and market conditions.
4. **Alert System**
- Alerts can be enabled for both buy and sell signals, ensuring traders never miss an opportunity even when away from the screen.
- Alerts are triggered once per bar, ensuring timely notifications without excessive noise.
5. **Customizable Signal Visibility**
- Traders can toggle the visibility of the last 9 buy and sell signals. When this option is disabled, only the most recent signal is displayed, helping to declutter the chart.
---
### **How to Use the ELC Indicator**
- **Trend Following**: The ELC Indicator works well in trending markets by filtering signals based on the EMA direction. Traders can use the plotted Fibonacci levels to enter trades, set profit targets, and manage risk.
- **Reversal Trading**: The liquidity grab detection mechanism allows traders to capture potential market reversals. By waiting for price retracements to key Fibonacci levels after a signal, traders can enter trades with a favorable risk-to-reward ratio.
- **Scalping & Day Trading**: With its ability to plot key intraday levels and generate real-time alerts, the ELC Indicator is particularly useful for scalpers and day traders looking to exploit short-term market inefficiencies.
---
### **Concepts Underlying the Calculations**
1. **Liquidity Grabs**: The ELC Indicator’s core logic is based on detecting instances where the market moves beyond a recent high or low, triggering a liquidity grab. This often signals a potential reversal or continuation, depending on broader market conditions.
2. **Fibonacci Ratios**: Once a signal is detected, key Fibonacci levels are plotted to provide traders with actionable zones for trade entries, profit targets, or stop-loss placements.
3. **EMA Filtering**: The EMA acts as a dynamic trend filter, ensuring that signals are aligned with the dominant market direction. This reduces the likelihood of entering trades against the prevailing trend.
---
### **Why ELC is Unique**
The ELC Indicator stands out by combining multiple powerful trading concepts—liquidity, Fibonacci ratios, and EMA filtering—into a single tool that provides actionable and visually intuitive information. Unlike traditional trend-following indicators that lag behind price action, ELC proactively identifies key market turning points based on liquidity events. Its customizable features, real-time alerts, and comprehensive plotting of Fibonacci levels make it a versatile tool for traders across various styles and timeframes.
Whether you're a scalper looking for intraday opportunities or a swing trader aiming to capture larger moves, the ELC Indicator offers a robust framework for identifying and executing high-probability trades.
---
### **How to Get Started**
1. Add the ELC Indicator to your chart.
2. Customize the EMA length, line colors, and style based on your preference.
3. Enable alerts to receive real-time notifications of buy and sell signals.
4. Use the plotted Fibonacci levels to plan your trade entries, profit targets, and stop-loss levels.
5. Combine the signals from ELC with your existing market analysis for optimal results.
---
This unique approach makes the ELC Indicator a valuable tool for traders seeking precision, clarity, and consistency in their trading decisions.

PIP Algorithm
# **Script Overview (For Non-Coders)**
1. **Purpose**
- The script tries to capture the essential “shape” of price movement by selecting a limited number of “key points” (anchors) from the latest bars.
- After selecting these anchors, it draws straight lines between them, effectively simplifying the price chart into a smaller set of points without losing major swings.
2. **How It Works, Step by Step**
1. We look back a certain number of bars (e.g., 50).
2. We start by drawing a straight line from the **oldest** bar in that range to the **newest** bar—just two points.
3. Next, we find the bar whose price is *farthest away* from that straight line. That becomes a new anchor point.
4. We “snap” (pin) the line to go exactly through that new anchor. Then we re-draw (re-interpolate) the entire line from the first anchor to the last, in segments.
5. We repeat the process (adding more anchors) until we reach the desired number of points. Each time, we choose the biggest gap between our line and the actual price, then re-draw the entire shape.
6. Finally, we connect these anchors on the chart with red lines, visually simplifying the price curve.
3. **Why It’s Useful**
- It highlights the most *important* bends or swings in the price over the chosen window.
- Instead of plotting every single bar, it condenses the information down to the “key turning points.”
4. **Key Takeaway**
- You’ll see a small number of red line segments connecting the **most significant** points in the price data.
- This is especially helpful if you want a simplified view of recent price action without minor fluctuations.
## **Detailed Logic Explanation**
# **Script Breakdown (For Coders)**
//@version=5
indicator(title="PIP Algorithm", overlay=true)
// 1. Inputs
length = input.int(50, title="Lookback Length")
num_points = input.int(5, title="Number of PIP Points (≥ 3)")
// 2. Helper Functions
// ---------------------------------------------------------------------
// reInterpSubrange(...):
// Given two “anchor” indices in `linesArr`, linearly interpolate
// the array values in between so that the subrange forms a straight line
// from linesArr to linesArr .
reInterpSubrange(linesArr, segmentLeft, segmentRight) =>
float leftVal = array.get(linesArr, segmentLeft)
float rightVal = array.get(linesArr, segmentRight)
int segmentLen = segmentRight - segmentLeft
if segmentLen > 1
for i = segmentLeft + 1 to segmentRight - 1
float ratio = (i - segmentLeft) / segmentLen
float interpVal = leftVal + (rightVal - leftVal) * ratio
array.set(linesArr, i, interpVal)
// reInterpolateAllSegments(...):
// For the entire “linesArr,” re-interpolate each subrange between
// consecutive breakpoints in `lineBreaksArr`.
// This ensures the line is globally correct after each new anchor insertion.
reInterpolateAllSegments(linesArr, lineBreaksArr) =>
array.sort(lineBreaksArr, order.asc)
for i = 0 to array.size(lineBreaksArr) - 2
int leftEdge = array.get(lineBreaksArr, i)
int rightEdge = array.get(lineBreaksArr, i + 1)
reInterpSubrange(linesArr, leftEdge, rightEdge)
// getMaxDistanceIndex(...):
// Return the index (bar) that is farthest from the current “linesArr.”
// We skip any indices already in `lineBreaksArr`.
getMaxDistanceIndex(linesArr, closeArr, lineBreaksArr) =>
float maxDist = -1.0
int maxIdx = -1
int sizeData = array.size(linesArr)
for i = 1 to sizeData - 2
bool isBreak = false
for b = 0 to array.size(lineBreaksArr) - 1
if i == array.get(lineBreaksArr, b)
isBreak := true
break
if not isBreak
float dist = math.abs(array.get(linesArr, i) - array.get(closeArr, i))
if dist > maxDist
maxDist := dist
maxIdx := i
maxIdx
// snapAndReinterpolate(...):
// "Snap" a chosen index to its actual close price, then re-interpolate the entire line again.
snapAndReinterpolate(linesArr, closeArr, lineBreaksArr, idxToSnap) =>
if idxToSnap >= 0
float snapVal = array.get(closeArr, idxToSnap)
array.set(linesArr, idxToSnap, snapVal)
reInterpolateAllSegments(linesArr, lineBreaksArr)
// 3. Global Arrays and Flags
// ---------------------------------------------------------------------
// We store final data globally, then use them outside the barstate.islast scope to draw lines.
var float finalCloseData = array.new_float()
var float finalLines = array.new_float()
var int finalLineBreaks = array.new_int()
var bool didCompute = false
var line pipLines = array.new_line()
// 4. Main Logic (Runs Once at the End of the Current Bar)
// ---------------------------------------------------------------------
if barstate.islast
// A) Prepare closeData in forward order (index 0 = oldest bar, index length-1 = newest)
float closeData = array.new_float()
for i = 0 to length - 1
array.push(closeData, close )
// B) Initialize linesArr with a simple linear interpolation from the first to the last point
float linesArr = array.new_float()
float firstClose = array.get(closeData, 0)
float lastClose = array.get(closeData, length - 1)
for i = 0 to length - 1
float ratio = (length > 1) ? (i / float(length - 1)) : 0.0
float val = firstClose + (lastClose - firstClose) * ratio
array.push(linesArr, val)
// C) Initialize lineBreaks with two anchors: 0 (oldest) and length-1 (newest)
int lineBreaks = array.new_int()
array.push(lineBreaks, 0)
array.push(lineBreaks, length - 1)
// D) Iteratively insert new breakpoints, always re-interpolating globally
int iterationsNeeded = math.max(num_points - 2, 0)
for _iteration = 1 to iterationsNeeded
// 1) Re-interpolate entire shape, so it's globally up to date
reInterpolateAllSegments(linesArr, lineBreaks)
// 2) Find the bar with the largest vertical distance to this line
int maxDistIdx = getMaxDistanceIndex(linesArr, closeData, lineBreaks)
if maxDistIdx == -1
break
// 3) Insert that bar index into lineBreaks and snap it
array.push(lineBreaks, maxDistIdx)
array.sort(lineBreaks, order.asc)
snapAndReinterpolate(linesArr, closeData, lineBreaks, maxDistIdx)
// E) Save results into global arrays for line drawing outside barstate.islast
array.clear(finalCloseData)
array.clear(finalLines)
array.clear(finalLineBreaks)
for i = 0 to array.size(closeData) - 1
array.push(finalCloseData, array.get(closeData, i))
array.push(finalLines, array.get(linesArr, i))
for b = 0 to array.size(lineBreaks) - 1
array.push(finalLineBreaks, array.get(lineBreaks, b))
didCompute := true
// 5. Drawing the Lines in Global Scope
// ---------------------------------------------------------------------
// We cannot create lines inside barstate.islast, so we do it outside.
array.clear(pipLines)
if didCompute
// Connect each pair of anchors with red lines
if array.size(finalLineBreaks) > 1
for i = 0 to array.size(finalLineBreaks) - 2
int idxLeft = array.get(finalLineBreaks, i)
int idxRight = array.get(finalLineBreaks, i + 1)
float x1 = bar_index - (length - 1) + idxLeft
float x2 = bar_index - (length - 1) + idxRight
float y1 = array.get(finalCloseData, idxLeft)
float y2 = array.get(finalCloseData, idxRight)
line ln = line.new(x1, y1, x2, y2, extend=extend.none)
line.set_color(ln, color.red)
line.set_width(ln, 2)
array.push(pipLines, ln)
1. **Data Collection**
- We collect the **most recent** `length` bars in `closeData`. Index 0 is the oldest bar in that window, index `length-1` is the newest bar.
2. **Initial Straight Line**
- We create an array called `linesArr` that starts as a simple linear interpolation from `closeData ` (the oldest bar’s close) to `closeData ` (the newest bar’s close).
3. **Line Breaks**
- We store “anchor points” in `lineBreaks`, initially ` `. These are the start and end of our segment.
4. **Global Re-Interpolation**
- Each time we want to add a new anchor, we **re-draw** (linear interpolation) for *every* subrange ` [lineBreaks , lineBreaks ]`, ensuring we have a globally consistent line.
- This avoids the “local subrange only” approach, which can cause clustering near existing anchors.
5. **Finding the Largest Distance**
- After re-drawing, we compute the vertical distance for each bar `i` that isn’t already a line break. The bar with the biggest distance from the line is chosen as the next anchor (`maxDistIdx`).
6. **Snapping and Re-Interpolate**
- We “snap” that bar’s line value to the actual close, i.e. `linesArr = closeData `. Then we globally re-draw all segments again.
7. **Repeat**
- We repeat these insertions until we have the desired number of points (`num_points`).
8. **Drawing**
- Finally, we connect each consecutive pair of anchor points (`lineBreaks`) with a `line.new(...)` call, coloring them red.
- We offset the line’s `x` coordinate so that the anchor at index 0 lines up with `bar_index - (length - 1)`, and the anchor at index `length-1` lines up with `bar_index` (the current bar).
**Result**:
You get a simplified representation of the price with a small set of line segments capturing the largest “jumps” or swings. By re-drawing the entire line after each insertion, the anchors tend to distribute more *evenly* across the data, mitigating the issue where anchors bunch up near each other.
Enjoy experimenting with different `length` and `num_points` to see how the simplified lines change!

Bitcoin Exponential Profit Strategy### Strategy Description:
The **Bitcoin Trading Strategy** is an **Exponential Moving Average (EMA) crossover strategy** designed to identify bullish trends for Bitcoin.
1. **Indicators**:
- **Fast EMA (default 9 periods)**: Represents the short-term trend.
- **Slow EMA (default 21 periods)**: Represents the longer-term trend.
2. **Entry Condition**:
- A **bullish crossover** occurs when the Fast EMA crosses above the Slow EMA.
- The strategy enters a **long position** with a user-defined order size (default 0.01 BTC).
3. **Exit Conditions**:
- **Take Profit**: Closes the position when the profit target is reached (default $100).
- **Stop Loss**: Closes the position when the price drops below the stop loss level (default $50).
- **Bearish Crossunder**: Closes the position when the Fast EMA crosses below the Slow EMA.
4. **Visual Signals**:
- **BUY signals**: Displayed when a bullish crossover occurs.
- **SELL signals**: Displayed when a bearish crossunder occurs.
This strategy is optimized for trend-following behavior, ensuring positions are aligned with upward-moving trends while managing risk through clear stop-loss and take-profit levels.

IU EMA Channel StrategyIU EMA Channel Strategy
Overview:
The IU EMA Channel Strategy is a simple yet effective trend-following strategy that uses two Exponential Moving Averages (EMAs) based on the high and low prices. It provides clear entry and exit signals by identifying price crossovers relative to the EMAs while incorporating a built-in Risk-to-Reward Ratio (RTR) for effective risk management.
Inputs ( Settings ):
- RTR (Risk-to-Reward Ratio): Define the ratio for risk-to-reward (default = 2).
- EMA Length: Adjust the length of the EMA channels (default = 100).
How the Strategy Works
1. EMA Channels:
- High-based EMA: EMA calculated on the high price.
- Low-based EMA: EMA calculated on the low price.
The area between these two EMAs creates a "channel" that visually highlights potential support and resistance zones.
2. Entry Rules:
- Long Entry: When the price closes above the high-based EMA (crossover).
- Short Entry: When the price closes below the low-based EMA (crossunder).
These entries ensure trades are taken in the direction of momentum.
3. Stop Loss (SL) and Take Profit (TP):
- Stop Loss:
- For long positions, the SL is set at the previous bar's low.
- For short positions, the SL is set at the previous bar's high.
- Take Profit:
- TP is automatically calculated using the Risk-to-Reward Ratio (RTR) you define.
- Example: If RTR = 2, the TP will be 2x the risk distance.
4. Exit Rules:
- Positions are closed at either the stop loss or the take profit level.
- The strategy manages exits automatically to enforce disciplined risk management.
Visual Features
1. EMA Channels:
- The high and low EMAs are dynamically color-coded:
- Green: Price is above the EMA (bullish condition).
- Red: Price is below the EMA (bearish condition).
- The area between the EMAs is shaded for better visual clarity.
2. Stop Loss and Take Profit Zones:
- SL and TP levels are plotted for both long and short positions.
- Zones are filled with:
- Red: Stop Loss area.
- Green: Take Profit area.
Be sure to manage your risk and position size properly.

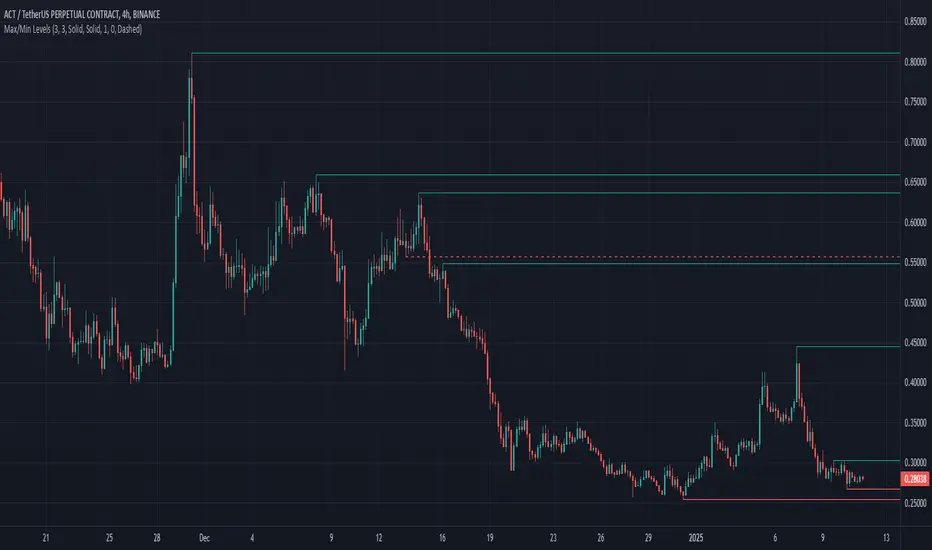
Max/Min LevelsHighlights highs and lows that match the search criteria. A high is considered to be broken if the candlestick breaks through its shadow
A three-candlestick pattern will match the parameters:
Candle before - 1
Candle after - 1
A five-candlestick pattern will match the parameters:
Candle before - 2
Candle after - 2
Enigma End Game Indicator
Enigma End Game Indicator Description
The Enigma End Game indicator is a powerful tool designed to enhance the way traders approach support and resistance, combining mainstream technical analysis with a unique, dynamic perspective. At its core, this indicator enables traders to adapt to market conditions in real time by applying a blend of classic and modern interpretations of support and resistance levels.
In traditional support and resistance analysis, we recognize the significant price points where the market has historically reversed or consolidated. However, the *Enigma End Game* indicator takes this one step further by analyzing each individual candle's high as a potential resistance level and each low as support. This allows the trader to stay more agile, as the market constantly updates and evolves. The dynamic nature of this method acknowledges that price movements are fractal in nature, meaning that these levels are not static but adjust in response to price action on multiple timeframes.
### How It Works:
When using the *Enigma End Game* indicator, it doesn't simply plot buy and sell signals automatically. Instead, the indicator highlights key levels based on the interaction between price and historical price action. Here's how it operates:
1. **Buy Logic:**
The indicator identifies bullish signals based on the *Enigma* logic, but it does not trigger an immediate buy. Instead, it plots arrows above or below the candles, indicating the key price levels where price action has shifted. Traders then focus on these areas, particularly looking for buy opportunities *below* these levels during key market sessions (such as London or New York) while aligning with both mainstream support and resistance and *Enigma* levels.
2. **Sell Logic:**
Similarly, when the indicator identifies a sell signal, it plots an arrow above the candle where price action has reversed. This does not immediately suggest selling. Traders wait for a price retracement back to the previously breached low (for a sell order) or high (for a buy order), observing price action closely on lower timeframes (such as the 1-minute chart) to refine entry points. The entry is triggered when price starts to show signs of reversing at these levels, further validated by mainstream and *Enigma* support/resistance.
### Practical Example – XAU/USD (Gold):
For instance, in the settings of the *Enigma End Game* indicator, if we select the 5-minute (5MN) timeframe as the key level, the indicator will only plot the first 3 arrows following the *Enigma* logic. The arrows will appear above or below the candle that was breached, indicating a potential trend reversal. In this scenario, the first arrow marks the point where price broke a significant support or resistance level. Afterward, the trader watches for a subsequent candle to close below (in the case of a sell) the previous candle’s low, confirming a bearish bias.
Now, the trader does not rush into a sell order. Instead, they wait for the price to pull back towards the previously breached low. At this point, the trader can use a lower timeframe (like the 1-minute chart) to identify both mainstream support and resistance levels and *Enigma* levels above the main 5-minute key level. These additional levels provide a clearer understanding of where price might reverse and give the trader a stronger edge in refining their entry point.
The trader then sets a sell order *above* the price level of the previous low, but only once signs show that price is retracing and ready to fall again. The price point where this retracement occurs, confirmed by both mainstream and *Enigma* levels, becomes the entry signal for the trade.
### Summary:
The *Enigma End Game* indicator combines time-tested principles of support and resistance with a more modern, adaptive view, empowering traders to read the market with greater precision. It guides you to wait for optimal entries, based on dynamic support and resistance levels that change with each price movement. By combining signals on higher timeframes with refined entries on lower timeframes, traders gain a unique advantage in navigating both obvious and hidden levels of support and resistance, ultimately improving their ability to time trades with higher probability of success.
This indicator allows for a more calculated, strategic approach to trading—highlighting the right moments to enter the market while providing the flexibility to adjust to different market conditions.
The *ENIGMA Signals with Retests* indicator is a versatile trading tool that combines key market sessions with dynamic support and resistance levels. It uses logic to identify potential buy and sell signals based on the behavior of recent price swings (highs and lows) and offers flexibility with the number of arrows plotted per session. The user can customize settings like arrow frequency, line styles, and session times, allowing for personalized trading strategies.
The indicator detects buy and sell signals by checking if the price breaks the previous swing high (for buy signals) or swing low (for sell signals). It then stores these levels and draws horizontal lines on the chart, representing critical price levels where traders can expect potential price reactions.
A key feature of this indicator is its ability to limit the number of arrows per session, ensuring a cleaner chart and reducing signal clutter. Horizontal lines are drawn at the identified buy or sell levels, with the option to display labels like "BUY - AT OR BELOW" and "SELL - AT OR ABOVE" to further clarify entry points.
The indicator also incorporates session filtering, allowing traders to focus on specific market sessions (Asia, London, and New York) for more relevant signals, and it ensures that no more than a user-defined number of arrows are plotted within a session.

Levy Flight Relative Strength Index [SeerQuant]Lévy Flight Relative Strength Index
A nuanced improvement on the classic RSI, the Lévy Flight RSI leverages the Lévy Flight model to calculate dynamic weighted gains and losses, offering improved responsiveness and smoothness in trend detection compared to the regular RSI. Ideal for traders seeking a balance between precision and adaptability, the Lévy Flight RSI is packed with customizable features and a sleek, modern aesthetic.
-----------------------------------------------------------------
🧠 What is Lévy Flight Modelling?
Lévy Flight modelling is a concept derived from probability theory and fractal mathematics, widely applied in fields such as finance and physics. In trading, Lévy Flights describe a random walk process characterized by small, frequent movements interspersed with larger, less frequent movements. This behaviour reflects real-world price dynamics, where markets often exhibit periods of relative calm followed by sharp, volatile movements. The Lévy Flight model introduces a weighting mechanism that amplifies extreme price changes while smoothing smaller ones, providing a more nuanced view of market trends.
In the context of the Lévy Flight RSI, this model enhances traditional RSI calculations by dynamically weighting price changes (gains and losses) based on their magnitude. This results in an RSI that is more responsive to significant price movements, making it ideal for detecting shifts in momentum and market direction.
-----------------------------------------------------------------
🌟 Key Features:
- Dynamic Lévy Flight Modelling: Adjust alpha (1 to 2) for responsive or smooth signals, making it perfect for varying market conditions.
- Custom RSI Smoothing: Choose from multiple moving average types, including TEMA, DEMA, HMA, ALMA, and more, to match your trading style.
- Visually Intuitive: Neon-inspired gradient colours and centered histogram provide instant insights into market conditions.
- Customizable Overbought/Oversold Levels: Clearly defined thresholds, with additional shaded regions for strength identification.
-----------------------------------------------------------------
⚙️ How the Code Works
The Lévy Flight RSI enhances the traditional RSI calculation by incorporating two primary elements:
Dynamic Weighting Using Lévy Flight:
The code calculates the price change (change) on each bar and applies a power function (alpha) to these changes. Gains are raised to the power of alpha (for positive price changes), and losses are similarly transformed (for negative price changes).
The parameter alpha (ranging from 1 to 2) determines the sensitivity of the weighting. Lower values emphasize responsiveness, while higher values smooth out signals.
Enhanced Moving Averages:
The weighted gains and losses are smoothed using a customizable moving average. Options include traditional averages like SMA and EMA, and more advanced ones like TEMA, HMA, and ALMA. These smoothed values are used to calculate the final RSI value.
-----------------------------------------------------------------
📈 Why Use Lévy Flight RSI?
This unique RSI indicator captures price momentum with enhanced sensitivity to market dynamics. Whether you’re trend-following, scalping, or identifying reversals, the Lévy Flight RSI provides robust insights to refine your trading decisions.
-----------------------------------------------------------------
🔧 Inputs:
RSI Settings: Control RSI length, calculation source, and smoothing type.
Lévy Flight Settings: Adjust alpha to tune the indicator's responsiveness.
Style Customization: Tailor the appearance with different colour themes and gradients.
-----------------------------------------------------------------

Ensemble Alerts█ OVERVIEW
This indicator creates highly customizable alert conditions and messages by combining several technical conditions into groups , which users can specify directly from the "Settings/Inputs" tab. It offers a flexible framework for building and testing complex alert conditions without requiring code modifications for each adjustment.
█ CONCEPTS
Ensemble analysis
Ensemble analysis is a form of data analysis that combines several "weaker" models to produce a potentially more robust model. In a trading context, one of the most prevalent forms of ensemble analysis is the aggregation (grouping) of several indicators to derive market insights and reinforce trading decisions. With this analysis, traders typically inspect multiple indicators, signaling trade actions when specific conditions or groups of conditions align.
Simplifying ensemble creation
Combining indicators into one or more ensembles can be challenging, especially for users without programming knowledge. It usually involves writing custom scripts to aggregate the indicators and trigger trading alerts based on the confluence of specific conditions. Making such scripts customizable via inputs poses an additional challenge, as it often involves complicated input menus and conditional logic.
This indicator addresses these challenges by providing a simple, flexible input menu where users can easily define alert criteria by listing groups of conditions from various technical indicators in simple text boxes . With this script, you can create complex alert conditions intuitively from the "Settings/Inputs" tab without ever writing or modifying a single line of code. This framework makes advanced alert setups more accessible to non-coders. Additionally, it can help Pine programmers save time and effort when testing various condition combinations.
█ FEATURES
Configurable alert direction
The "Direction" dropdown at the top of the "Settings/Inputs" tab specifies the allowed direction for the alert conditions. There are four possible options:
• Up only : The indicator only evaluates upward conditions.
• Down only : The indicator only evaluates downward conditions.
• Up and down (default): The indicator evaluates upward and downward conditions, creating alert triggers for both.
• Alternating : The indicator prevents alert triggers for consecutive conditions in the same direction. An upward condition must be the first occurrence after a downward condition to trigger an alert, and vice versa for downward conditions.
Flexible condition groups
This script features six text inputs where users can define distinct condition groups (ensembles) for their alerts. An alert trigger occurs if all the conditions in at least one group occur.
Each input accepts a comma-separated list of numbers with optional spaces (e.g., "1, 4, 8"). Each listed number, from 1 to 35, corresponds to a specific individual condition. Below are the conditions that the numbers represent:
1 — RSI above/below threshold
2 — RSI below/above threshold
3 — Stoch above/below threshold
4 — Stoch below/above threshold
5 — Stoch K over/under D
6 — Stoch K under/over D
7 — AO above/below threshold
8 — AO below/above threshold
9 — AO rising/falling
10 — AO falling/rising
11 — Supertrend up/down
12 — Supertrend down/up
13 — Close above/below MA
14 — Close below/above MA
15 — Close above/below open
16 — Close below/above open
17 — Close increase/decrease
18 — Close decrease/increase
19 — Close near Donchian top/bottom (Close > (Mid + HH) / 2)
20 — Close near Donchian bottom/top (Close < (Mid + LL) / 2)
21 — New Donchian high/low
22 — New Donchian low/high
23 — Rising volume
24 — Falling volume
25 — Volume above average (Volume > SMA(Volume, 20))
26 — Volume below average (Volume < SMA(Volume, 20))
27 — High body to range ratio (Abs(Close - Open) / (High - Low) > 0.5)
28 — Low body to range ratio (Abs(Close - Open) / (High - Low) < 0.5)
29 — High relative volatility (ATR(7) > ATR(40))
30 — Low relative volatility (ATR(7) < ATR(40))
31 — External condition 1
32 — External condition 2
33 — External condition 3
34 — External condition 4
35 — External condition 5
These constituent conditions fall into three distinct categories:
• Directional pairs : The numbers 1-22 correspond to pairs of opposing upward and downward conditions. For example, if one of the inputs includes "1" in the comma-separated list, that group uses the "RSI above/below threshold" condition pair. In this case, the RSI must be above a high threshold for the group to trigger an upward alert, and the RSI must be below a defined low threshold to trigger a downward alert.
• Non-directional filters : The numbers 23-30 correspond to conditions that do not represent directional information. These conditions act as filters for both upward and downward alerts. Traders often use non-directional conditions to refine trending or mean reversion signals. For instance, if one of the input lists includes "30", that group uses the "Low relative volatility" condition. The group can trigger an upward or downward alert only if the 7-period Average True Range (ATR) is below the 40-period ATR.
• External conditions : The numbers 31-35 correspond to external conditions based on the plots from other indicators on the chart. To set these conditions, use the source inputs in the "External conditions" section near the bottom of the "Settings/Inputs" tab. The external value can represent an upward, downward, or non-directional condition based on the following logic:
▫ Any value above 0 represents an upward condition.
▫ Any value below 0 represents a downward condition.
▫ If the checkbox next to the source input is selected, the condition becomes non-directional . Any group that uses the condition can trigger upward or downward alerts only if the source value is not 0.
To learn more about using plotted values from other indicators, see this article in our Help Center and the Source input section of our Pine Script™ User Manual.
Group markers
Each comma-separated list represents a distinct group , where all the listed conditions must occur to trigger an alert. This script assigns preset markers (names) to each condition group to make the active ensembles easily identifiable in the generated alert messages and labels. The markers assigned to each group use the format "M", where "M" is short for "Marker" and "x" is the group number. The titles of the inputs at the top of the "Settings/Inputs" tab show these markers for convenience.
For upward conditions, the labels and alert messages show group markers with upward triangles (e.g., "M1▲"). For downward conditions, they show markers with downward triangles (e.g., "M1▼").
NOTE: By default, this script populates the "M1" field with a pre-configured list for a mean reversion group ("2,18,24,28"). The other fields are empty. If any "M*" input does not contain a value, the indicator ignores it in the alert calculations.
Custom alert messages
By default, the indicator's alert message text contains the activated markers and their direction as a comma-separated list. Users can override this message for upward or downward alerts with the two text fields at the bottom of the "Settings/Inputs" tab. When the fields are not empty , the alerts use that text instead of the default marker list.
NOTE: This script generates alert triggers, not the alerts themselves. To set up an alert based on this script's conditions, open the "Create Alert" dialog box, then select the "Ensemble Alerts" and "Any alert() function call" options in the "Condition" tabs. See the Alerts FAQ in our Pine Script™ User Manual for more information.
Condition visualization
This script offers organized visualizations of its conditions, allowing users to inspect the behaviors of each condition alongside the specified groups. The key visual features include:
1) Conditional plots
• The indicator plots the history of each individual condition, excluding the external conditions, as circles at different levels. Opposite conditions appear at positive and negative levels with the same absolute value. The plots for each condition show values only on the bars where they occur.
• Each condition's plot is color-coded based on its type. Aqua and orange plots represent opposing directional conditions, and purple plots represent non-directional conditions. The titles of the plots also contain the condition numbers to which they apply.
• The plots in the separate pane can be turned on or off with the "Show plots in pane" checkbox near the top of the "Settings/Inputs" tab. This input only toggles the color-coded circles, which reduces the graphical load. If you deactivate these visuals, you can still inspect each condition from the script's status line and the Data Window.
• As a bonus, the indicator includes "Up alert" and "Down alert" plots in the Data Window, representing the combined upward and downward ensemble alert conditions. These plots are also usable in additional indicator-on-indicator calculations.
2) Dynamic labels
• The indicator draws a label on the main chart pane displaying the activated group markers (e.g., "M1▲") each time an alert condition occurs.
• The labels for upward alerts appear below chart bars. The labels for downward alerts appear above the bars.
NOTE: This indicator can display up to 500 labels because that is the maximum allowed for a single Pine script.
3) Background highlighting
• The indicator can highlight the main chart's background on bars where upward or downward condition groups activate. Use the "Highlight background" inputs in the "Settings/Inputs" tab to enable these highlights and customize their colors.
• Unlike the dynamic labels, these background highlights are available for all chart bars, irrespective of the number of condition occurrences.
█ NOTES
• This script uses Pine Script™ v6, the latest version of TradingView's programming language. See the Release notes and Migration guide to learn what's new in v6 and how to convert your scripts to this version.
• This script imports our new Alerts library, which features functions that provide high-level simplicity for working with complex compound conditions and alerts. We used the library's `compoundAlertMessage()` function in this indicator. It evaluates items from "bool" arrays in groups specified by an array of strings containing comma-separated index lists , returning a tuple of "string" values containing the marker of each activated group.
• The script imports the latest version of the ta library to calculate several technical indicators not included in the built-in `ta.*` namespace, including Double Exponential Moving Average (DEMA), Triple Exponential Moving Average (TEMA), Fractal Adaptive Moving Average (FRAMA), Tilson T3, Awesome Oscillator (AO), Full Stochastic (%K and %D), SuperTrend, and Donchian Channels.
• The script uses the `force_overlay` parameter in the label.new() and bgcolor() calls to display the drawings and background colors in the main chart pane.
• The plots and hlines use the available `display.*` constants to determine whether the visuals appear in the separate pane.
Look first. Then leap.

SMT Divergence ICT 01 [TradingFinder] Smart Money Technique🔵 Introduction
SMT Divergence (short for Smart Money Technique Divergence) is a trading technique in the ICT Concepts methodology that focuses on identifying divergences between two positively correlated assets in financial markets.
These divergences occur when two assets that should move in the same direction move in opposite directions. Identifying these divergences can help traders spot potential reversal points and trend changes.
Bullish and Bearish divergences are clearly visible when an asset forms a new high or low, and the correlated asset fails to do so. This technique is applicable in markets like Forex, stocks, and cryptocurrencies, and can be used as a valid signal for deciding when to enter or exit trades.
Bullish SMT Divergence : This type of divergence occurs when one asset forms a higher low while the correlated asset forms a lower low. This divergence is typically a sign of weakness in the downtrend and can act as a signal for a trend reversal to the upside.
Bearish SMT Divergence : This type of divergence occurs when one asset forms a higher high while the correlated asset forms a lower high. This divergence usually indicates weakness in the uptrend and can act as a signal for a trend reversal to the downside.
🔵 How to Use
SMT Divergence is an analytical technique that identifies divergences between two correlated assets in financial markets.
This technique is used when two assets that should move in the same direction move in opposite directions.
Identifying these divergences can help you pinpoint reversal points and trend changes in the market.
🟣 Bullish SMT Divergence
This divergence occurs when one asset forms a higher low while the correlated asset forms a lower low. This divergence indicates weakness in the downtrend and can signal a potential price reversal to the upside.
In this case, when the correlated asset is forming a lower low, and the main asset is moving lower but the correlated asset fails to continue the downward trend, there is a high probability of a trend reversal to the upside.
🟣 Bearish SMT Divergence
Bearish divergence occurs when one asset forms a higher high while the correlated asset forms a lower high. This type of divergence indicates weakness in the uptrend and can signal a potential trend reversal to the downside.
When the correlated asset fails to make a new high, this divergence may be a sign of a trend reversal to the downside.
🟣 Confirming Signals with Correlation
To improve the accuracy of the signals, use assets with strong correlation. Forex pairs like OANDA:EURUSD and OANDA:GBPUSD , or cryptocurrencies like COINBASE:BTCUSD and COINBASE:ETHUSD , or commodities such as gold ( FX:XAUUSD ) and silver ( FX:XAGUSD ) typically have significant correlation. Identifying divergences between these assets can provide a strong signal for a trend change.
🔵 Settings
Second Symbol : This setting allows you to select another asset for comparison with the primary asset. By default, "XAUUSD" (Gold) is set as the second symbol, but you can change it to any currency pair, stock, or cryptocurrency. For example, you can choose currency pairs like EUR/USD or GBP/USD to identify divergences between these two assets.
Divergence Fractal Periods : This parameter defines the number of past candles to consider when identifying divergences. The default value is 2, but you can change it to suit your preferences. This setting allows you to detect divergences more accurately by selecting a greater number of candles.
Bullish Divergence Line : Displays a line showing bullish divergence from the lows.
Bearish Divergence Line : Displays a line showing bearish divergence from the highs.
Bullish Divergence Label : Displays the "+SMT" label for bullish divergences.
Bearish Divergence Label : Displays the "-SMT" label for bearish divergences.
🔵 Conclusion
SMT Divergence is an effective tool for identifying trend changes and reversal points in financial markets based on identifying divergences between two correlated assets. This technique helps traders receive more accurate signals for market entry and exit by analyzing bullish and bearish divergences.
Identifying these divergences can provide opportunities to capitalize on trend changes in Forex, stocks, and cryptocurrency markets. Using SMT Divergence along with risk management and confirming signals with other technical analysis tools can improve the accuracy of trading decisions and reduce risks from sudden market changes.

AadTrend [InvestorUnknown]The AadTrend indicator is an experimental trading tool that combines a user-selected moving average with the Average Absolute Deviation (AAD) from this moving average. This combination works similarly to the Supertrend indicator but offers additional flexibility and insights. In addition to generating Long and Short signals, the AadTrend indicator identifies RISK-ON and RISK-OFF states for each trade direction, highlighting areas where taking on more risk may be considered.
Core Concepts and Features
Moving Average (User-Selected Type)
The indicator allows users to select from various types of moving averages to suit different trading styles and market conditions:
Simple Moving Average (SMA)
Exponential Moving Average (EMA)
Hull Moving Average (HMA)
Double Exponential Moving Average (DEMA)
Triple Exponential Moving Average (TEMA)
Relative Moving Average (RMA)
Fractal Adaptive Moving Average (FRAMA)
Average Absolute Deviation (AAD)
The Average Absolute Deviation measures the average distance between each data point and the mean, providing a robust estimation of volatility.
aad(series float src, simple int length, simple string avg_type) =>
avg = // Moving average as selected by the user
abs_deviations = math.abs(src - avg)
ta.sma(abs_deviations, length)
This provides a volatility measure that adapts to recent market conditions.
Combining Moving Average and AAD
The indicator creates upper and lower bands around the moving average using the AAD, similar to how the Supertrend indicator uses Average True Range (ATR) for its bands.
AadTrend(series float src, simple int length, simple float aad_mult, simple string avg_type) =>
// Calculate AAD (volatility measure)
aad_value = aad(src, length, avg_type)
// Calculate the AAD-based moving average by scaling the price data with AAD
avg = switch avg_type
"SMA" => ta.sma(src, length)
"EMA" => ta.ema(src, length)
"HMA" => ta.hma(src, length)
"DEMA" => ta.dema(src, length)
"TEMA" => ta.tema(src, length)
"RMA" => ta.rma(src, length)
"FRAMA" => ta.frama(src, length)
avg_p = avg + (aad_value * aad_mult)
avg_m = avg - (aad_value * aad_mult)
var direction = 0
if ta.crossover(src, avg_p)
direction := 1
else if ta.crossunder(src, avg_m)
direction := -1
A chart displaying the moving average with upper and lower AAD bands enveloping the price action.
Signals and Trade States
1. Long and Short Signals
Long Signal: Generated when the price crosses above the upper AAD band,
Short Signal: Generated when the price crosses below the lower AAD band.
2. RISK-ON and RISK-OFF States
These states provide additional insight into the strength of the current trend and potential opportunities for taking on more risk.
RISK-ON Long: When the price moves significantly above the upper AAD band after a Long signal.
RISK-OFF Long: When the price moves back below the upper AAD band, suggesting caution.
RISK-ON Short: When the price moves significantly below the lower AAD band after a Short signal.
RISK-OFF Short: When the price moves back above the lower AAD band.
Highlighted areas on the chart representing RISK-ON and RISK-OFF zones for both Long and Short positions.
A chart showing the filled areas corresponding to trend directions and RISK-ON zones
Backtesting and Performance Metrics
While the AadTrend indicator focuses on generating signals and highlighting risk areas, it can be integrated with backtesting frameworks to evaluate performance over historical data.
Integration with Backtest Library:
import InvestorUnknown/BacktestLibrary/1 as backtestlib
Customization and Calibration
1. Importance of Calibration
Default Settings Are Experimental: The default parameters are not optimized for any specific market condition or asset.
User Calibration: Traders should adjust the length, aad_mult, and avg_type parameters to align the indicator with their trading strategy and the characteristics of the asset being analyzed.
2. Factors to Consider
Market Volatility: Higher volatility may require adjustments to the aad_mult to avoid false signals.
Trading Style: Short-term traders might prefer faster-moving averages like EMA or HMA, while long-term traders might opt for SMA or FRAMA.
Alerts and Notifications
The AadTrend indicator includes built-in alert conditions to notify traders of significant market events:
Long and Short Alerts:
alertcondition(long_alert, "LONG (AadTrend)", "AadTrend flipped ⬆LONG⬆")
alertcondition(short_alert, "SHORT (AadTrend)", "AadTrend flipped ⬇Short⬇")
RISK-ON and RISK-OFF Alerts:
alertcondition(risk_on_long, "RISK-ON LONG (AadTrend)", "RISK-ON LONG (AadTrend)")
alertcondition(risk_off_long, "RISK-OFF LONG (AadTrend)", "RISK-OFF LONG (AadTrend)")
alertcondition(risk_on_short, "RISK-ON SHORT (AadTrend)", "RISK-ON SHORT (AadTrend)")
alertcondition(risk_off_short, "RISK-OFF SHORT (AadTrend)", "RISK-OFF SHORT (AadTrend)")
Important Notes and Disclaimer
Experimental Nature: The AadTrend indicator is experimental and should be used with caution.
No Guaranteed Performance: Past performance is not indicative of future results. Backtesting results may not reflect real trading conditions.
User Responsibility: Traders and investors should thoroughly test and calibrate the indicator settings before applying it to live trading.
Risk Management: Always use proper risk management techniques, including stop-loss orders and position sizing.
