ATR Daily BandThis indicator draws an upper and lower band for each day. It uses the Average True Range calculation (with configurable lookback) and places the band at 1ATR above and 1ATR below the daily open.
I use this indicator as a simple gauge to tell how significant price movement is, and get a feel for the daily volatility. Due to the fractal nature of price action, it can be difficult to determine if a price movement is significant while zoomed in on a single intraday chart. Using this indicator, I can tell if the price action is approaching the ATR or if it's just staying within the band.
Strategies: Useful for both mean reversion and momentum strategies. It's up to you to decide how this metric will fit into your trading strategy. I currently use this indicator to look for mean reversion setups, but that is due to the current market conditions and my personal trading style.
Search in scripts for "Fractal"

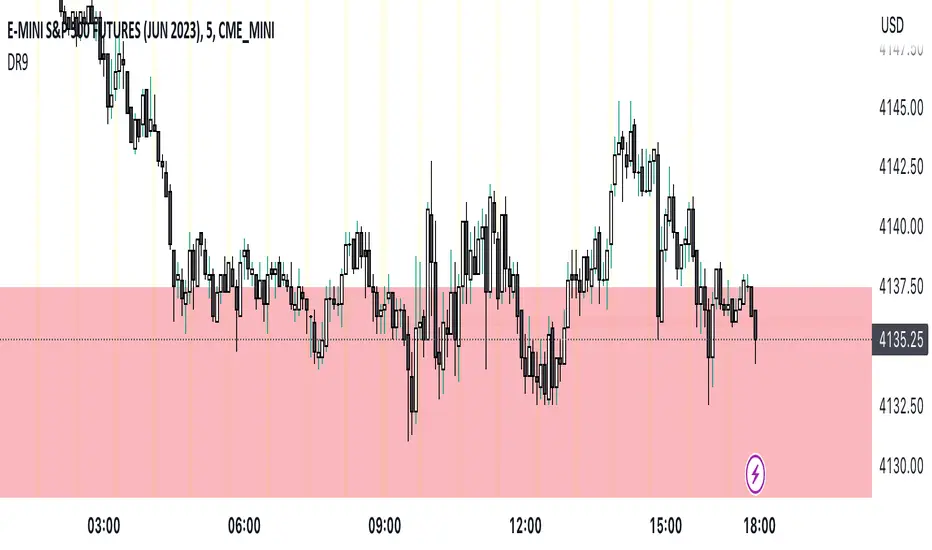
Digital Root 9 Time HighlightsTitle: Digital Root 9 Indicator
Description: The Digital Root 9 Indicator is a custom TradingView tool that identifies all times in which the digital root of the current time is 9. The digital root is calculated by summing the digits of the current time and then continuing to sum the resulting digits until a single digit is obtained. For instance, the time 3:33 has a digital root of 9 because 3+3+3=9.
What sets the Digital Root 9 Indicator apart from other TradingView indicators is its focus on identifying times with a numerological significance. It is particularly useful for traders who incorporate numerology into their trading strategies and are looking for a tool that highlights these significant times.
To use the Digital Root 9 Indicator, simply add it to your TradingView chart. The indicator will highlight all times when the digital root of the current time is 9, allowing you to see at a glance which times have numerological significance. You can customize the indicator's color scheme and other settings to suit your preferences.
The Digital Root 9 Indicator is intended to help traders identify times when the potential for luck and prosperity is heightened according to numerology. However, it should not be used as the sole basis for making trading decisions. It is important to conduct thorough analysis and risk management before making any trades.
The Digital Root 9 Indicator is suitable for use in any market condition and time frame.
FRAMA & CPMA Strategy [CSM]The script is an advanced technical analysis tool specifically designed for trading in financial markets, with a particular focus on the BankNifty market. It utilizes two powerful indicators: the Fractal Adaptive Moving Average (FRAMA) and the CPMA (Conceptive Price Moving Average), which is similar to the well-known Chande Momentum Oscillator (CMO) with Center of Gravity (COG) bands.
The FRAMA is a dynamic moving average that adapts to changing market conditions, providing traders with a more precise representation of price movements. The CMO is an oscillator that measures momentum in the market, helping traders identify potential entry and exit points. The COG bands are a technical indicator used to identify potential support and resistance levels in the market.
Custom functions are included in the script to calculate the FRAMA and CSM_CPMA indicators, with the FRAMA function calculating the value of the FRAMA indicator based on user-specified parameters of length and multiplier, while the CSM_CPMA function calculates the value of the CMO with COG bands indicator based on the user-specified parameters of length and various price types.
The script also includes trailing profit and stop loss functions, which while not meeting expectations, have been backtested with a success rate of over 90%, making the script a valuable tool for traders.
Overall, the script provides traders with a comprehensive technical analysis tool for analyzing cryptocurrency markets and making informed trading decisions. Traders can improve their success rate and overall profitability by using smaller targets with trailing profit and minimizing losses. Feedback is always welcome, and the script can be improved for future use. Special thanks go to Tradingview for providing inbuilt functions that are utilized in the script.

Descending Elliot Wave Patterns [theEccentricTrader]█ OVERVIEW
This indicator automatically draws descending Elliot Wave patterns and price projections derived from the ranges that constitute the patterns.
█ CONCEPTS
Green and Red Candles
• A green candle is one that closes with a close price equal to or above the price it opened.
• A red candle is one that closes with a close price that is lower than the price it opened.
Swing Highs and Swing Lows
• A swing high is a green candle or series of consecutive green candles followed by a single red candle to complete the swing and form the peak.
• A swing low is a red candle or series of consecutive red candles followed by a single green candle to complete the swing and form the trough.
Peak and Trough Prices (Basic)
• The peak price of a complete swing high is the high price of either the red candle that completes the swing high or the high price of the preceding green candle, depending on which is higher.
• The trough price of a complete swing low is the low price of either the green candle that completes the swing low or the low price of the preceding red candle, depending on which is lower.
Historic Peaks and Troughs
The current, or most recent, peak and trough occurrences are referred to as occurrence zero. Previous peak and trough occurrences are referred to as historic and ordered numerically from right to left, with the most recent historic peak and trough occurrences being occurrence one.
Range
The range is simply the difference between the current peak and current trough prices, generally expressed in terms of points or pips.
Support and Resistance
• Support refers to a price level where the demand for an asset is strong enough to prevent the price from falling further.
• Resistance refers to a price level where the supply of an asset is strong enough to prevent the price from rising further.
Support and resistance levels are important because they can help traders identify where the price of an asset might pause or reverse its direction, offering potential entry and exit points. For example, a trader might look to buy an asset when it approaches a support level , with the expectation that the price will bounce back up. Alternatively, a trader might look to sell an asset when it approaches a resistance level , with the expectation that the price will drop back down.
It's important to note that support and resistance levels are not always relevant, and the price of an asset can also break through these levels and continue moving in the same direction.
Upper Trends
• A return line uptrend is formed when the current peak price is higher than the preceding peak price.
• A downtrend is formed when the current peak price is lower than the preceding peak price.
• A double-top is formed when the current peak price is equal to the preceding peak price.
Lower Trends
• An uptrend is formed when the current trough price is higher than the preceding trough price.
• A return line downtrend is formed when the current trough price is lower than the preceding trough price.
• A double-bottom is formed when the current trough price is equal to the preceding trough price.
Muti-Part Upper and Lower Trends
• A multi-part return line uptrend begins with the formation of a new return line uptrend, or higher peak, and continues until a new downtrend, or lower peak, completes the trend.
• A multi-part downtrend begins with the formation of a new downtrend, or lower peak, and continues until a new return line uptrend, or higher peak, completes the trend.
• A multi-part uptrend begins with the formation of a new uptrend, or higher trough, and continues until a new return line downtrend, or lower trough, completes the trend.
• A multi-part return line downtrend begins with the formation of a new return line downtrend, or lower trough, and continues until a new uptrend, or higher trough, completes the trend.
Double Trends
• A double uptrend is formed when the current trough price is higher than the preceding trough price and the current peak price is higher than the preceding peak price.
• A double downtrend is formed when the current peak price is lower than the preceding peak price and the current trough price is lower than the preceding trough price.
Muti-Part Double Trends
• A multi-part double uptrend begins with the formation of a new uptrend that proceeds a new return line uptrend, and continues until a new downtrend or return line downtrend ends the trend.
• A multi-part double downtrend begins with the formation of a new downtrend that proceeds a new return line downtrend, and continues until a new uptrend or return line uptrend ends the trend.
Wave Cycles
A wave cycle is here defined as a complete two-part move between a swing high and a swing low, or a swing low and a swing high. The first swing high or swing low will set the course for the sequence of wave cycles that follow; for example a chart that begins with a swing low will form its first complete wave cycle upon the formation of the first complete swing high and vice versa.
Figure 1.
Fibonacci Retracement and Extension Ratios
The Fibonacci sequence is a series of numbers in which each number is the sum of the two preceding numbers, starting with 0 and 1. For example 0 + 1 = 1, 1 + 1 = 2, 1 + 2 = 3, and so on. Ultimately, we could go on forever but the first few numbers in the sequence are as follows: 0 , 1, 1, 2, 3, 5, 8, 13, 21, 34, 55, 89, 144.
The extension ratios are calculated by dividing each number in the sequence by the number preceding it. For example 0/1 = 0, 1/1 = 1, 2/1 = 2, 3/2 = 1.5, 5/3 = 1.6666..., 8/5 = 1.6, 13/8 = 1.625, 21/13 = 1.6153..., 34/21 = 1.6190..., 55/34 = 1.6176..., 89/55 = 1.6181..., 144/89 = 1.6179..., and so on. The retracement ratios are calculated by inverting this process and dividing each number in the sequence by the number proceeding it. For example 0/1 = 0, 1/1 = 1, 1/2 = 0.5, 2/3 = 0.666..., 3/5 = 0.6, 5/8 = 0.625, 8/13 = 0.6153..., 13/21 = 0.6190..., 21/34 = 0.6176..., 34/55 = 0.6181..., 55/89 = 0.6179..., 89/144 = 0.6180..., and so on.
1.618 is considered to be the 'golden ratio', found in many natural phenomena such as the growth of seashells and the branching of trees. Some now speculate the universe oscillates at a frequency of 0,618 Hz, which could help to explain such phenomena, but this theory has yet to be proven.
Traders and analysts use Fibonacci retracement and extension indicators, consisting of horizontal lines representing different Fibonacci ratios, for identifying potential levels of support and resistance. Fibonacci ranges are typically drawn from left to right, with retracement levels representing ratios inside of the current range and extension levels representing ratios extended outside of the current range. If the current wave cycle ends on a swing low, the Fibonacci range is drawn from peak to trough. If the current wave cycle ends on a swing high the Fibonacci range is drawn from trough to peak.
Elliot Wave Patterns
Ralph Nelson Elliott, authored his book on Elliott wave theory titled "The Wave Principle" in 1938. In this book, Elliott presented his theory of market behaviour, which he believed reflected the natural laws that govern human behaviour.
The Elliott Wave Theory is based on the principle that waves have a tendency to unfold in a specific sequence of five waves in the direction of the trend, followed by three waves leading in the opposite direction. This pattern is called a 5-3 wave pattern and is the foundation of Elliott's theory.
The five waves in the direction of the trend are labelled 1, 2, 3, 4, and 5, while the three waves in the opposite direction are labelled A, B, and C. Waves 1, 3, and 5 are impulse waves, while waves 2 and 4 are corrective waves. Waves A and C are also corrective waves, while wave B is an impulse wave.
According to Elliott, the pattern of waves is fractal in nature, meaning that it occurs on all time frames, from the smallest to the largest.
In Elliott Wave Theory, the distance that waves move from each other depends on the specific market conditions and the amplitude of the waves involved. There is no fixed rule or limit for how far waves should move from each other, however, there are several guidelines to help identify and measure wave distances. One of the most common guidelines is the Fibonacci ratios, which can be used to describe the relationships between wave lengths. For example, Elliott identified that wave 3 is typically the strongest and longest wave, and it tends to be 1.618 times the length of wave 1. Meanwhile, wave 2 tends to retrace between 50% and 78.6% of wave 1, and wave 4 tends to retrace between 38.2% and 78.6% of wave 3.
In general, the patterns are quite rare and the distances that the waves move in relation to one another is subject to interpretation. For such reasons, I have simply included the ratios of the current ranges as ratios of the preceding ranges in the wave labels and it will, ultimately, be up to the user to decide whether or not the patterns qualify as valid.
█ FEATURES
Inputs
• Show Projections
• Pattern Color
• Label Color
• Extend Current Projection Lines
█ LIMITATIONS
All green and red candle calculations are based on differences between open and close prices, as such I have made no attempt to account for green candles that gap lower and close below the close price of the preceding candle, or red candles that gap higher and close above the close price of the preceding candle. This may cause some unexpected behaviour on some markets and timeframes. I can only recommend using 24-hour markets, if and where possible, as there are far fewer gaps and, generally, more data to work with.

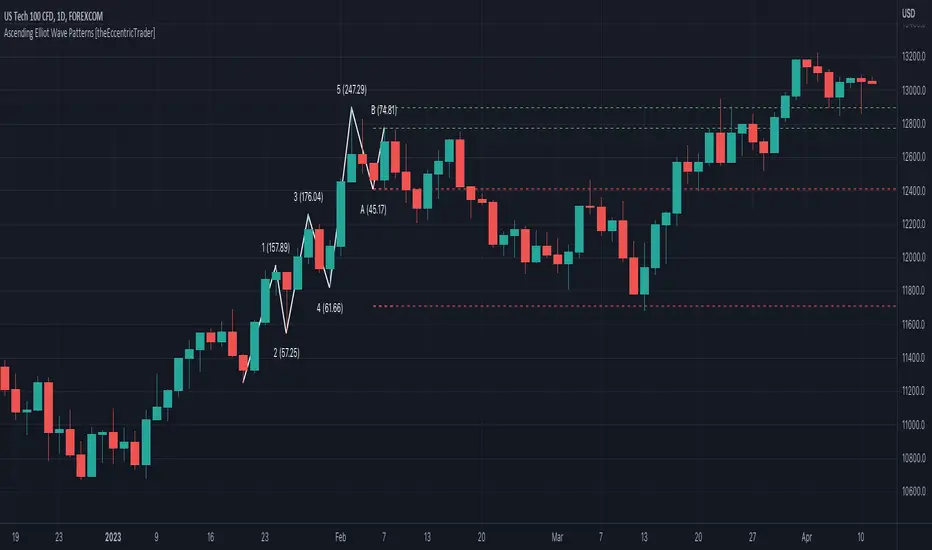
Ascending Elliot Wave Patterns [theEccentricTrader]█ OVERVIEW
This indicator automatically draws ascending Elliot Wave patterns and price projections derived from the ranges that constitute the patterns.
█ CONCEPTS
Green and Red Candles
• A green candle is one that closes with a close price equal to or above the price it opened.
• A red candle is one that closes with a close price that is lower than the price it opened.
Swing Highs and Swing Lows
• A swing high is a green candle or series of consecutive green candles followed by a single red candle to complete the swing and form the peak.
• A swing low is a red candle or series of consecutive red candles followed by a single green candle to complete the swing and form the trough.
Peak and Trough Prices (Basic)
• The peak price of a complete swing high is the high price of either the red candle that completes the swing high or the high price of the preceding green candle, depending on which is higher.
• The trough price of a complete swing low is the low price of either the green candle that completes the swing low or the low price of the preceding red candle, depending on which is lower.
Historic Peaks and Troughs
The current, or most recent, peak and trough occurrences are referred to as occurrence zero. Previous peak and trough occurrences are referred to as historic and ordered numerically from right to left, with the most recent historic peak and trough occurrences being occurrence one.
Range
The range is simply the difference between the current peak and current trough prices, generally expressed in terms of points or pips.
Support and Resistance
• Support refers to a price level where the demand for an asset is strong enough to prevent the price from falling further.
• Resistance refers to a price level where the supply of an asset is strong enough to prevent the price from rising further.
Support and resistance levels are important because they can help traders identify where the price of an asset might pause or reverse its direction, offering potential entry and exit points. For example, a trader might look to buy an asset when it approaches a support level , with the expectation that the price will bounce back up. Alternatively, a trader might look to sell an asset when it approaches a resistance level , with the expectation that the price will drop back down.
It's important to note that support and resistance levels are not always relevant, and the price of an asset can also break through these levels and continue moving in the same direction.
Upper Trends
• A return line uptrend is formed when the current peak price is higher than the preceding peak price.
• A downtrend is formed when the current peak price is lower than the preceding peak price.
• A double-top is formed when the current peak price is equal to the preceding peak price.
Lower Trends
• An uptrend is formed when the current trough price is higher than the preceding trough price.
• A return line downtrend is formed when the current trough price is lower than the preceding trough price.
• A double-bottom is formed when the current trough price is equal to the preceding trough price.
Muti-Part Upper and Lower Trends
• A multi-part return line uptrend begins with the formation of a new return line uptrend, or higher peak, and continues until a new downtrend, or lower peak, completes the trend.
• A multi-part downtrend begins with the formation of a new downtrend, or lower peak, and continues until a new return line uptrend, or higher peak, completes the trend.
• A multi-part uptrend begins with the formation of a new uptrend, or higher trough, and continues until a new return line downtrend, or lower trough, completes the trend.
• A multi-part return line downtrend begins with the formation of a new return line downtrend, or lower trough, and continues until a new uptrend, or higher trough, completes the trend.
Double Trends
• A double uptrend is formed when the current trough price is higher than the preceding trough price and the current peak price is higher than the preceding peak price.
• A double downtrend is formed when the current peak price is lower than the preceding peak price and the current trough price is lower than the preceding trough price.
Muti-Part Double Trends
• A multi-part double uptrend begins with the formation of a new uptrend that proceeds a new return line uptrend, and continues until a new downtrend or return line downtrend ends the trend.
• A multi-part double downtrend begins with the formation of a new downtrend that proceeds a new return line downtrend, and continues until a new uptrend or return line uptrend ends the trend.
Wave Cycles
A wave cycle is here defined as a complete two-part move between a swing high and a swing low, or a swing low and a swing high. The first swing high or swing low will set the course for the sequence of wave cycles that follow; for example a chart that begins with a swing low will form its first complete wave cycle upon the formation of the first complete swing high and vice versa.
Figure 1.
Fibonacci Retracement and Extension Ratios
The Fibonacci sequence is a series of numbers in which each number is the sum of the two preceding numbers, starting with 0 and 1. For example 0 + 1 = 1, 1 + 1 = 2, 1 + 2 = 3, and so on. Ultimately, we could go on forever but the first few numbers in the sequence are as follows: 0 , 1, 1, 2, 3, 5, 8, 13, 21, 34, 55, 89, 144.
The extension ratios are calculated by dividing each number in the sequence by the number preceding it. For example 0/1 = 0, 1/1 = 1, 2/1 = 2, 3/2 = 1.5, 5/3 = 1.6666..., 8/5 = 1.6, 13/8 = 1.625, 21/13 = 1.6153..., 34/21 = 1.6190..., 55/34 = 1.6176..., 89/55 = 1.6181..., 144/89 = 1.6179..., and so on. The retracement ratios are calculated by inverting this process and dividing each number in the sequence by the number proceeding it. For example 0/1 = 0, 1/1 = 1, 1/2 = 0.5, 2/3 = 0.666..., 3/5 = 0.6, 5/8 = 0.625, 8/13 = 0.6153..., 13/21 = 0.6190..., 21/34 = 0.6176..., 34/55 = 0.6181..., 55/89 = 0.6179..., 89/144 = 0.6180..., and so on.
1.618 is considered to be the 'golden ratio', found in many natural phenomena such as the growth of seashells and the branching of trees. Some now speculate the universe oscillates at a frequency of 0,618 Hz, which could help to explain such phenomena, but this theory has yet to be proven.
Traders and analysts use Fibonacci retracement and extension indicators, consisting of horizontal lines representing different Fibonacci ratios, for identifying potential levels of support and resistance. Fibonacci ranges are typically drawn from left to right, with retracement levels representing ratios inside of the current range and extension levels representing ratios extended outside of the current range. If the current wave cycle ends on a swing low, the Fibonacci range is drawn from peak to trough. If the current wave cycle ends on a swing high the Fibonacci range is drawn from trough to peak.
Elliot Wave Patterns
Ralph Nelson Elliott, authored his book on Elliott wave theory titled "The Wave Principle" in 1938. In this book, Elliott presented his theory of market behaviour, which he believed reflected the natural laws that govern human behaviour.
The Elliott Wave Theory is based on the principle that waves have a tendency to unfold in a specific sequence of five waves in the direction of the trend, followed by three waves leading in the opposite direction. This pattern is called a 5-3 wave pattern and is the foundation of Elliott's theory.
The five waves in the direction of the trend are labelled 1, 2, 3, 4, and 5, while the three waves in the opposite direction are labelled A, B, and C. Waves 1, 3, and 5 are impulse waves, while waves 2 and 4 are corrective waves. Waves A and C are also corrective waves, while wave B is an impulse wave.
According to Elliott, the pattern of waves is fractal in nature, meaning that it occurs on all time frames, from the smallest to the largest.
In Elliott Wave Theory, the distance that waves move from each other depends on the specific market conditions and the amplitude of the waves involved. There is no fixed rule or limit for how far waves should move from each other, however, there are several guidelines to help identify and measure wave distances. One of the most common guidelines is the Fibonacci ratios, which can be used to describe the relationships between wave lengths. For example, Elliott identified that wave 3 is typically the strongest and longest wave, and it tends to be 1.618 times the length of wave 1. Meanwhile, wave 2 tends to retrace between 50% and 78.6% of wave 1, and wave 4 tends to retrace between 38.2% and 78.6% of wave 3.
In general, the patterns are quite rare and the distances that the waves move in relation to one another is subject to interpretation. For such reasons, I have simply included the ratios of the current ranges as ratios of the preceding ranges in the wave labels and it will, ultimately, be up to the user to decide whether or not the patterns qualify as valid.
█ FEATURES
Inputs
• Show Projections
• Pattern Color
• Label Color
• Extend Current Projection Lines
█ LIMITATIONS
All green and red candle calculations are based on differences between open and close prices, as such I have made no attempt to account for green candles that gap lower and close below the close price of the preceding candle, or red candles that gap higher and close above the close price of the preceding candle. This may cause some unexpected behaviour on some markets and timeframes. I can only recommend using 24-hour markets, if and where possible, as there are far fewer gaps and, generally, more data to work with.
Market Structure & Liquidity: CHoCHs+Nested Pivots+FVGs+Sweeps//Purpose:
This indicator combines several tools to help traders track and interpret price action/market structure; It can be divided into 4 parts;
1. CHoCHs, 2. Nested Pivot highs & lows, 3. Grade sweeps, 4. FVGs.
This gives the trader a toolkit for determining market structure and shifts in market structure to help determine a bull or bear bias, whether it be short-term, med-term or long-term.
This indicator also helps traders in determining liquidity targets: wether they be voids/gaps (FVGS) or old highs/lows+ typical sweep distances.
Finally, the incorporation of HTF CHoCH levels printing on your LTF chart helps keep the bigger picture in mind and tells traders at a glance if they're above of below Custom HTF CHoCH up or CHoCH down (these HTF CHoCHs can be anything from Hourly up to Monthly).
//Nomenclature:
CHoCH = Change of Character
STH/STL = short-term high or low
MTH/MTL = medium-term high or low
LTH/LTL = long-term high or low
FVG = Fair value gap
CE = consequent encroachement (the midline of a FVG)
~~~ The Four components of this indicator ~~~
1. CHoCHs:
•Best demonstrated in the below charts. This was a method taught to me by @Icecold_crypto. Once a 3 bar fractal pivot gets broken, we count backwards the consecutive higher lows or lower highs, then identify the CHoCH as the opposite end of the candle which ended the consecutive backwards count. This CHoCH (UP or DOWN) then becomes a level to watch, if price passes through it in earnest a trader would consider shifting their bias as market structure is deemed to have shifted.
•HTF CHoCHs: Option to print Higher time frame chochs (default on) of user input HTF. This prints only the last UP choch and only the last DOWN choch from the input HTF. Solid line by default so as to distinguish from local/chart-time CHoCHs. Can be any Higher timeframe you like.
•Show on table: toggle on show table(above/below) option to show in table cells (top right): is price above the latest HTF UP choch, or is price below HTF DOWN choch (or is it sat between the two, in a state of 'uncertainty').
•Most recent CHoCHs which have not been met by price will extend 10 bars into the future.
• USER INPUTS: overall setting: SHOW CHOCHS | Set bars lookback number to limit historical Chochs. Set Live CHoCHs number to control the number of active recent chochs unmet by price. Toggle shrink chochs once hit to declutter chart and minimize old chochs to their origin bars. Set Multi-timeframe color override : to make Color choices auto-set to your preference color for each of 1m, 5m, 15m, H, 4H, D, W, M (where up and down are same color, but 'up' icon for up chochs and down icon for down chochs remain printing as normal)
2. Nested Pivot Highs & Lows; aka 'Pivot Highs & Lows (ST/MT/LT)'
•Based on a seperate, longer lookback/lookforward pivot calculation. Identifies Pivot highs and lows with a 'spikeyness' filter (filtering out weak/rounded/unimpressive Pivot highs/lows)
•by 'nested' I mean that the pivot highs are graded based on whether a pivot high sits between two lower pivot highs or vice versa.
--for example: STH = normal pivot. MTH is pivot high with a lower STH on either side. LTH is a pivot high with a lower MTH on either side. Same applies to pivot lows (STL/MTL/LTL)
•This is a useful way to measure the significance of a high or low. Both in terms of how much it might be typically swept by (see later) and what it would imply for HTF bias were we to break through it in earnest (more than just a sweep).
• USER INPUTS: overall setting: show pivot highs & lows | Bars lookback (historical pivots to show) | Pivots: lookback/lookforward length (determines the scale of your pivot highs/lows) | toggle on/off Apply 'Spikeyness' filter (filters out smooth/unimpressive pivot highs/lows). Set Spikeyness index (determines the strength of this filter if turned on) | Individually toggle on each of STH, MTH, LTH, STL, MTL, LTL along with their label text type , and size . Toggle on/off line for each of these Pivot highs/lows. | Set label spacer (atr multiples above / below) | set line style and line width
3. Grade Sweeps:
•These are directly related to the nested pivots described above. Most assets will have a typical sweep distance. I've added some of my expected sweeps for various assets in the indicator tooltips.
--i.e. Eur/Usd 10-20-30 pips is a typical 'grade' sweep. S&P HKEX:5 - HKEX:10 is a typical grade sweep.
•Each of the ST/MT/LT pivot highs and lows have optional user defined grade sweep boxes which paint above until filled (or user option for historical filled boxes to remain).
•Numbers entered into sweep input boxes are auto converted into appropriate units (i.e. pips for FX, $ or 'handles' for indices, $ for Crypto. Very low $ units can be input for low unit value crypto altcoins.
• USER INPUTS: overall setting: Show sweep boxes | individually select colors of each of STH, MTH, LTH, STL, MTL, LTL sweep boxes. | Set Grade sweep ($/pips) number for each of ST, MT, LT. This auto converts between pips and $ (i.e. FX vs Indices/Crypto). Can be a float as small or large as you like ($0.000001 to HKEX:1000 ). | Set box text position (horizontal & vertical) and size , and color . | Set Box width (bars) (for non extended/ non-auto-terminating at price boxes). | toggle on/off Extend boxes/lines right . | Toggle on/off Shrink Grade sweeps on fill (they will disappear in realtime when filled/passed through)
4. FVGs:
•Fair Value gaps. Represent 'naked' candle bodies where the wicks to either side do not meet, forming a 'gap' of sorts which has a tendency to fill, or at least to fill to midline (CE).
•These are ICT concepts. 'UP' FVGS are known as BISIs (Buyside imbalance, sellside inefficiency); 'DOWN' FVGs are known as SIBIs (Sellside imbalance, buyside inefficiency).
• USER INPUTS: overall setting: show FVGs | Bars lookback (history). | Choose to display: 'UP' FVGs (BISI) and/or 'DOWN FVGs (SIBI) . Choose to display the midline: CE , the color and the line style . Choose threshold: use CE (as opposed to Full Fill) |toggle on/off Shrink FVG on fill (CE hit or Full fill) (declutter chart/see backtesting history)
////••Alerts (general notes & cautionary notes)::
•Alerts are optional for most of the levels printed by this indicator. Set them via the three dots on indicator status line.
•Due to dynamic repainting of levels, alerts should be used with caution. Best use these alerts either for Higher time frame levels, or when closely monitoring price.
--E.g. You may set an alert for down-fill of the latest FVG below; but price will keep marching up; form a newer/higher FVG, and the alert will trigger on THAT FVG being down-filled (not the original)
•Available Alerts:
-FVG(BISI) cross above threshold(CE or full-fill; user choice). Same with FVG(SIBI).
-HTF last CHoCH down, cross below | HTF last CHoCH up, cross above.
-last CHoCH down, cross below | last CHoCH up, cross above.
-LTH cross above, MTH cross above, STH cross above | LTL cross below, MTL cross below, STL cross below.
////••Formatting (general)::
•all table text color is set from the 'Pivot highs & Lows (ST, MT, LT)' section (for those of you who prefer black backgrounds).
•User choice of Line-style, line color, line width. Same with Boxes. Icon choice for chochs. Char or label text choices for ST/MT/LT pivot highs & lows.
////••User Inputs (general):
•Each of the 4 components of this indicator can be easily toggled on/off independently.
•Quite a lot of options and toggle boxes, as described in full above. Please take your time and read through all the tooltips (hover over '!' icon) to get an idea of formatting options.
•Several Lookback periods defined in bars to control how much history is shown for each of the 4 components of this indicator.
•'Shrink on fill' settings on FVGs and CHoCHs: Basically a way to declutter chart; toggle on/off depending on if you're backtesting or reading live price action.
•Table Display: applies to ST/MT/LT pivot highs and to HTF CHoCHs; Toggle table on or off (in part or in full)
////••Credits:
•Credit to ICT (Inner Circle Trader) for some of the concepts used in this indicator (FVGS & CEs; Grade sweeps).
•Credit to @Icecold_crypto for the specific and novel concept of identifying CHoCHs in a simple, objective and effective manner (as demonstrated in the 1st chart below).
CHoCH demo page 1: shifting tweak; arrow diagrams to demonstrate how CHoCHs are defined:
CHoCH demo page 2: Simplified view; short lookback history; few CHoCHs, demo of 'latest' choch being extended into the future by 10 bars:
USAGE: Bitcoin Hourly using HTF daily CHoCHs:
USAGE-2: Cotton Futures (CT1!) 2hr. Painting a rather bullish picture. Above HTF UP CHoCH, Local CHoCHs show bullish order flow, Nice targets above (MTH/LTH + grade sweeps):
Full Demo; 5min chart; CHoCHs, Short term pivot highs/lows, grade sweeps, FVGs:
Full Demo, Eur/Usd 15m: STH, MTH, LTH grade sweeps, CHoCHs, Usage for finding bias (part A):
Full Demo, Eur/Usd 15m: STH, MTH, LTH grade sweeps, CHoCHs, Usage for finding bias, 3hrs later (part B):
Realtime Vs Backtesting(A): btc/usd 15m; FVGs and CHoCHs: shrink on fill, once filled they repaint discreetly on their origin bar only. Realtime (Shrink on fill, declutter chart):
Realtime Vs Backtesting(B): btc/usd 15m; FVGs and CHoCHs: DON'T shrink on fill; they extend to the point where price crosses them, and fix/paint there. Backtesting (seeing historical behaviour):

Liquidity Candles with Prev Day High/Low and Midnight OpenAlright, let's talk about how to use this fancy indicator. But first, let me warn you, using indicators is like driving a car, you can't just press the gas pedal and hope for the best. You need to know what you're doing, or else you'll crash and burn faster than a soufflé in a microwave.
Now, let's get started. The first thing you need to do is understand what this indicator is telling you. Think of it like a signalman at a train station. He's waving flags and giving hand signals to tell you whether it's safe to proceed or if you need to stop and wait. This indicator works the same way.
It's going to give you signals based on price movements, telling you whether it's safe to buy or sell. But don't get too excited, my friend. You still need to use your brain and make smart decisions. Don't just blindly follow the signals, or else you'll end up like a sheep being led to the slaughter.
Now, let's talk about some of ICT's smart money trading concepts. First up, we have "liquidity grabs". This is when the big boys in the market create false breakouts to shake out the weak hands. They're like school bullies stealing lunch money from the little kids. But you can avoid being a victim by watching for signs of a liquidity grab, and using your brain to decide whether it's a real breakout or just a trap.
Next up, we have "stop runs". This is when the big players purposely trigger stop-loss orders to get a better entry or exit. It's like a game of chicken, but with your money on the line. To avoid being run over, keep an eye on your stop-loss orders, and don't be too predictable in your trading.
Finally, we have "market structure". This is like the blueprint of the market, showing you where the support and resistance levels are. It's like a treasure map to finding the best trades. But don't forget that market structure can change over time, so keep updating your map and stay ahead of the game.
So there you have it, my friend. A quick tutorial on using this indicator, with a side of ICT's smart money trading concepts. But remember, indicators are just tools, and you're the one driving the car. Use your brain, stay alert, and don't be a sheep. Happy trading!
Divergent Trades LLC:
Disclaimer: The information provided by the Divergent Trades LLC indicator is for educational and informational purposes only. It should not be considered financial advice or a recommendation to buy, sell, or trade any financial instrument. Divergent Trades LLC is not responsible for any losses incurred as a result of using this indicator. Trading in the financial markets carries a high level of risk and may not be suitable for all investors. Before making any investment decisions, please consult with a financial advisor and do your own due diligence. Past performance is not indicative of future results. By using the Divergent Trades LLC indicator, you acknowledge that you have read and understand this disclaimer and agree to its terms and conditions.

occ3aka weighted fair price
The ultimate price source for all your stuff, unless you go completely nuts.
The ultimate way to build line charts & do pattern trading, unless you go completely nuts.
Why occ3?
You need a one-point estimate for every bar, a typical price of every bar aye? But then you see that every bar has a different distribution of prices. You can drop a stat test on every bar and pick median, mean, or whatever. But that's still prone to error (imagine borderline cases).
Instead, you can transform the task into a geometric one and say, "I wanna find the center of mass of all dem ticks within a particular interval (a day, a week, a century)". But lol ofc you won't do it, so lets's estimate it:
1) a straight line from Open to Close more/less estimates a regression line if you woulda dropped regression on all the ticks within a given interval;
2) centroid always lies on regression line, so it's always in between the endpoints of regression line. So that's why (open + close) /2;
3) Then, you remember that sequence matters, + generally the volume is higher near the close, so...;
4) Voila, (open + close + close) / 3
Why "fair" price?
Take a daily bar:
1) High & low were the best prices to sell & buy;
2) Opening & closing auctions had acceptable prices, in exchange for the the biggest potential to transact serious volume;
3) "Fair" price, logically, is somewhere in between the acceptable prices;
4) Market is fractal => the same principles propagate everywhere;
4) No, POCs and VPOCs don't make much sense as fair prices.
Nothing else to say, really advise to use it as a line chart if you trade price patterns.

Library_SmoothersLibrary "Library_Smoothers"
CorrectedMA(Src, Len)
CorrectedMA The strengths of the corrected Average (CA) is that the current value of the time series must exceed a the current volatility-dependent threshold, so that the filter increases or falls, avoiding false signals when the trend is in a weak phase.
Parameters:
Src
Len
Returns: The Corrected source.
EHMA(src, len)
EMA Exponential Moving Average.
Parameters:
src : Source to act upon
len
Returns: EMA of source
FRAMA(src, len, FC, SC)
FRAMA Fractal Adaptive Moving Average
Parameters:
src : Source to act upon
len : Length of moving average
FC : Fast moving average
SC : Slow moving average
Returns: FRAMA of source
Jurik(src, length, phase, power)
Jurik A low lag filter
Parameters:
src : Source
length : Length for smoothing
phase : Phase range is ±100
power : Mathematical power to use. Doesn't need to be whole numbers
Returns: Jurik of source
SMMA(src, len)
SMMA Smoothed moving average. Think of the SMMA as a hybrid of its better-known siblings — the simple moving average (SMA) and the exponential moving average (EMA).
Parameters:
src : Source
len
Returns: SMMA of source
SuperSmoother(src, len)
SuperSmoother
Parameters:
src : Source to smooth
len
Returns: SuperSmoother of the source
TMA(src, len)
TMA Triangular Moving Average
Parameters:
src : Source
len
Returns: TMA of source
TSF(src, len)
TSF Time Series Forecast. Uses linear regression.
Parameters:
src : Source
len
Returns: TSF of source
VIDYA(src, len)
VIDYA Chande's Variable Index Dynamic Average. See www.fxcorporate.com
Parameters:
src : Source
len
Returns: VIDYA of source
VAWMA(src, len, startingWeight, volumeDefault)
VAWMA = VWMA and WMA combined. Simply put, this attempts to determine the average price per share over time weighted heavier for recent values. Uses a triangular algorithm to taper off values in the past (same as WMA does).
Parameters:
src : Source
len : Length
startingWeight
volumeDefault : The default value to use when a chart has no volume.
Returns: The VAWMA of the source.
WWMA(src, len)
WWMA Welles Wilder Moving Average
Parameters:
src : Source
len
Returns: The WWMA of the source
ZLEMA(src, len)
ZLEMA Zero Lag Expotential Moving Average
Parameters:
src : Source
len
Returns: The ZLEMA of the source
SmootherType(mode, src, len, fastMA, slowMA, offset, phase, power, startingWeight, volumeDefault, Corrected)
Performs the specified moving average
Parameters:
mode : Name of moving average
src : the source to apply the MA type
len
fastMA : FRAMA fast moving average
slowMA : FRAMA slow moving average
offset : Linear regression offset
phase : Jurik phase
power : Jurik power
startingWeight : VAWMA starting weight
volumeDefault : VAWMA default volume
Corrected
Returns: The MA smoothed source

Swing Failure PatternThis script will remind you of a potential swing failure pattern (which is a grab for liquidity to go the other direction). You can't use this script on its own, hence the eyes to look for confluences ;-)
Eyes will appear when the current high/low takes out the high/low of the last (by default) 100 highs/lows and will close below/above that last high/low.
Extra settings:
- ignore the last x amount of bars
- choose a character instead of the eyes
- choose a color for the character
Happy trading! ;-)

SUPER MACD📈 MACD Indicator Update - Version 2
🔹 New Features and Improvements:
1️⃣ New MACD Calculation Options:
Users can now choose from various Moving Averages to calculate the MACD. The default options are SMA (Simple Moving Average) and EMA (Exponential Moving Average), but there are 14 other versions available to experiment with:
SMA (Simple Moving Average)
EMA (Exponential Moving Average)
WMA (Weighted Moving Average)
RMA (Smoothed Moving Average)
HMA (Hull Moving Average)
JMA (Jurik Moving Average)
DEMA (Double Exponential Moving Average)
TEMA (Triple Exponential Moving Average)
LSMA (Least Squares Moving Average)
VWMA (Volume-Weighted Moving Average)
SMMA (Smoothed Moving Average)
KAMA (Kaufman’s Adaptive Moving Average)
ALMA (Arnaud Legoux Moving Average)
FRAMA (Fractal Adaptive Moving Average)
VIDYA (Variable Index Dynamic Average)
2️⃣ Improved Input Visibility and Organization:
We’ve reorganized the inputs so that the most commonly used ones are now placed at the beginning for quicker and more convenient configuration.
3️⃣ Bug Fixes and Code Improvements:
Minor bugs have been fixed, and the code has been optimized for better stability and performance. The code is now cleaner and fully functional in version 6.
4️⃣ Cometreon Public Library Integration:
To lighten the code and improve its modularity, we’ve integrated the Cometreon public library. This makes the code more efficient and reduces the need to duplicate common functions.
☄️ With this update, the MACD indicator becomes even more versatile and user-friendly, offering a wide range of calculation methods and an improved interface!

Candlestick Pattern Criteria and Analysis Indicator█ OVERVIEW
Define, then locate the presence of a candle that fits a specific criteria. Run a basic calculation on what happens after such a candle occurs.
Here, I’m not giving you an edge, but I’m giving you a clear way to find one.
IMPORTANT NOTE: PLEASE READ:
THE INDICATOR WILL ALWAYS INITIALLY LOAD WITH A RUNTIME ERROR. WHEN INITIALLY LOADED THERE NO CRITERIA SELECTED.
If you do not select a criteria or run a search for a criteria that doesn’t exist, you will get a runtime error. If you want to force the chart to load anyway, enable the debug panel at the bottom of the settings menu.
Who this is for:
- People who want to engage in TradingView for tedious and challenging data analysis related to candlestick measurement and occurrence rate and signal bar relationships with subsequent bars. People who don’t know but want to figure out what a strong bullish bar or a strong bearish bar is.
Who this is not for:
- People who want to be told by an indicator what is good or bad or buy or sell. Also, not for people that don’t have any clear idea on what they think is a strong bullish bar or a strong bearish bar and aren’t willing to put in the work.
Recommendation: Use on the candle resolution that accurately reflects your typical holding period. If you typically hold a trade for 3 weeks, use 3W candles. If you hold a trade for 3 minutes, use 3m candles.
Tldr; Read the tool tips and everything above this line. Let me know any issues that arise or questions you have.
█ CONCEPTS
Many trading styles indicate that a certain candle construct implies a bearish or bullish future for price. That said, it is also common to add to that idea that the context matters. Of course, this is how you end up with all manner of candlestick patterns accounting for thousands of pages of literature. No matter the context though, we can distill a discretionary trader's decision to take a trade based on one very basic premise: “A trader decides to take a trade on the basis of the rightmost candle's construction and what he/she believes that candle construct implies about the future price.” This indicator vets that trader’s theory in the most basic way possible. It finds the instances of any candle construction and takes a look at what happens on the next bar. This current bar is our “Signal Bar.”
█ GUIDE
I said that we vet the theory in the most basic way possible. But, in truth, this indicator is very complex as a result of there being thousands of ways to define a ‘strong’ candle. And you get to define things on a very granular level with this indicator.
Features:
1. Candle Highlighting
When the user’s criteria is met, the candle is highlighted on the chart.
The following candle is highlighted based on whether it breaks out, breaks down, or is an inside bar.
2. User-Defined Criteria
Criteria that you define include:
Candle Type: Bull bars, Bear bars, or both
Candle Attributes
Average Size based on Standard Deviation or Average of all potential bars in price history
Search within a specific price range
Search within a specific time range
Clarify time range using defined sessions and with or without weekends
3. Strike Lines on Candle
Often you want to know how price reacts when it gets back to a certain candle. Also it might be true that candle types cluster in a price region. This can be identified visually by adding lines that extend right on candles that fit the criteria.
4. User-Defined Context
Labeled “Alternative Criteria,” this facet of the script allows the user to take the context provided from another indicator and import it into the indicator to use as a overriding criteria. To account for the fact that the external indicator must be imported as a float value, true (criteria of external indicator is met) must be imported as 1 and false (criteria of external indicator is not met) as 0. Basically a binary Boolean. This can be used to create context, such as in the case of a traditional fractal, or can be used to pair with other signals.
If you know how to code in Pinescript, you can save a copy and simply add your own code to the section indicated in the code and set your bull and bear variables accordingly and the code should compile just fine with no further editing needed.
Included with the script to maximize out-of-the-box functionality, there is preloaded as alternative criteria a code snippet. The criteria is met on the bull side when the current candle close breaks out above the prior candle high. The bear criteria is met when the close breaks below the prior candle. When Alternate Criteria is run by itself, this is the only criteria set and bars are highlighted when it is true. You can qualify these candles by adding additional attributes that you think would fit well.
Using Alternative Criteria, you are essentially setting a filter for the rest of the criteria.
5. Extensive Read Out in the Data Window (right side bar pop out window).
As you can see in the thumbnail, there is pasted a copy of the Data Window Dialogue. I am doubtful I can get the thumbnail to load up perfectly aligned. Its hard to get all these data points in here. It may be better suited for a table at this point. Let me know what you think.
The primary, but not exclusive, purpose of what is in the Data Window is to talk about how often your criteria happens and what happens on the next bar. There are a lot of pieces to this.
Red = Values pertaining to the size of the current bar only
Blue = Values pertaining or related to the total number of signals
Green = Values pertaining to the signal bars themselves, including their measurements
Purple = Values pertaining to bullish bars that happen after the signal bar
Fuchsia = Values pertaining to bearish bars that happen after the signal bar
Lime = Last four rows which are your percentage occurrence vs total signals percentages
The best way I can explain how to understand parts you don’t understand otherwise in the data window is search the title of the row in the code using ‘ctrl+f’ and look at it and see if it makes more sense.
█ [b}Available Candle Attributes
Candle attributes can be used in any combination. They include:
[*}Bodies
[*}High/Low Range
[*}Upper Wick
[*}Lower Wick
[*}Average Size
[*}Alternative Criteria
Criteria will evaluate each attribute independently. If none is set for a particular attribute it is bypassed.
Criteria Quantity can be in Ticks, Points, or Percentage. For percentage keep in mind if using anything involving the candle range will not work well with percentage.
Criteria Operators are “Greater Than,” “Less Than,” and “Threshold.” Threshold means within a range of two numbers.
█ Problems with this methodology and opportunities for future development:
#1 This kind of work is hard.
If you know what you’re doing you might be able to find success changing out the inputs for loops and logging results in arrays or matrices, but to manually go through and test various criteria is a lot of work. However, it is rewarding. At the time of publication in early Oct 2022, you will quickly find that you get MUCH more follow through on bear bars than bull bars. That should be obvious because we’re in the middle of a bear market, but you can still work with the parameters and contextual inputs to determine what maximizes your probability. I’ve found configurations that yield 70% probability across the full series of bars. That’s an edge. That means that 70% of the time, when this criteria is met, the next bar puts you in profit.
#2 The script is VERY heavy.
Takes an eternity to load. But, give it a break, it’s doing a heck of a lot! There is 10 unique arrays in here and a loop that is a bit heavy but gives us the debug window.
#3 If you don’t have a clear idea its hard to know where to start.
There are a lot of levers to pull on in this script. Knowing which ones are useful and meaningful is very challenging. Combine that with long load times… its not great.
#4 Your brain is the only thing that can optimize your results because the criteria come from your mind.
Machine learning would be much more useful here, but for now, you are the machine. Learn.
#5 You can’t save your settings.
So, when you find a good combo, you’ll have to write it down elsewhere for future reference. It would be nice if we could save templates on custom indicators like we can on some of the built in drawing tools, but I’ve had no success in that. So, I recommend screenshotting your settings and saving them in Notion.so or some other solid record keeping database. Then you can go back and retrieve those settings.
#6 no way to export these results into conditions that can be copy/pasted into another script.
Copy/Paste of labels or tables would be the best feature ever at this point. Because you could take the criteria and put it in a label, copy it and drop it into another strategy script or something. But… men can dream.
█ Opportunities to PineCoders Learn:
1. In this script I’m importing libraries, showing some of my libraries functionality. Hopefully that gives you some ideas on how to use them too.
The price displacement library (which I love!)
Creative and conventional ways of using debug()
how to display arrays and matrices on charts
I didn’t call in the library that holds the backtesting function. But, also demonstrating, you can always pull the library up and just copy/paste the function out of there and into your script. That’s fine to do a lot of the time.
2. I am using REALLY complicated logic in this script (at least for me). I included extensive descriptions of this ? : logic in the text of the script. I also did my best to bracket () my logic groups to demonstrate how they fit together, both for you and my future self.
3. The breakout, built-in, “alternative criteria” is actually a small bit of genius built in there if you want to take the time to understand that block of code and think about some of the larger implications of the method deployed.
As always, a big thank you to TradingView and the Pinescript community, the Pinescript pros who have mentored me, and all of you who I am privileged to help in their Pinescripting journey.
"Those who stay will become champions" - Bo Schembechler

Pips-Stepped, Adaptive-ER DSEMA w/ DSL [Loxx]Pips-Stepped, Adaptive-ER DSEMA w/ DSL is an Efficiency-Ratio-Adaptive, Double-Smoothed EMA with Pips Stepping and Discontinued Signal Lines. This combination reduces noise and improves signal quality.
What is Double Smoothed Exponential Moving Average (DSEMA) ?
The Double Smoothed Exponential Moving Average is a lot less laggy compared to a traditional EMA . It's also considered a leading indicator compared to the EMA , and is best utilized whenever smoothness and speed of reaction to market changes are required.
What is the efficiency ratio?
In statistical terms, the Efficiency Ratio tells us the fractal efficiency of price changes. ER fluctuates between 1 and 0, but these extremes are the exception, not the norm. ER would be 1 if prices moved up 10 consecutive periods or down 10 consecutive periods. ER would be zero if price is unchanged over the 10 periods.
Included:
Bar coloring
Signals
Alerts
EMA and FEMA Signal/ DSL smoothing
Loxx's Expanded Source Types

3C QFL Mean reversalWhat is QFL trading strategy?
QFL stands for Quickfingersluc, and sometimes it is referred to as the Base Strategy or Mean Reversals. Its main idea is about identifying the moment of panic selling and buying below the base level and utilizing Safety orders.
What is Base level or Support Level?
Base level or Support Level refers to the lowest price level that was reached before the moment the price started increasing again. At that level, you can notice that buyers of some cryptocurrencies make a strong reaction.
In this strategy we can also reverse the strategy and go short. But i must warn you that that is alot riskier.
QFL is meant to be used on higher TF's like 1hr, 2hr and 4hr. But this strategy also work well on lower Timeframes.
The script also simulates DCA strategy with parameters used in 3commas DCA bots for futures trading.
Experiment with parameters to find your trading setup.
Beware how large your total leveraged position is and how far can market go before you get liquidated!
Do that with the help of futures liquidation calculators you can find online!
Included:
An internal average price and profit calculating, instead of TV`s native one, which is subject to severe slippage.
A graphic interface, so levels are clearly visible and back-test analyzing made easier.
Long & Short direction of the strategy.
Table display a summary of past trades
Vertical colored lines appear when the new maximum deviation from the original price has
been reached
All the trading happens with total account capital, and all order sizes inputs are expressed in percent.

Market Sessions(4sessions)Special for CLUB SM))) Special for CLUB SM))) Special for CLUB SM))) Special for CLUB SM))) Special for CLUB SM))) Special for CLUB SM))) Special for CLUB SM))) Special for CLUB SM))) Special for CLUB SM))) Special for CLUB SM))) Special for CLUB SM))) Special for CLUB SM))) Special for CLUB SM))) Special for CLUB SM))) Special for CLUB SM))) Special for CLUB SM))) Special for CLUB SM))) Special for CLUB SM))) Special for CLUB SM))) Special for CLUB SM))) Special for CLUB SM))) Special for CLUB SM))) Special for CLUB SM))) Special for CLUB SM))) Special for CLUB SM))) Special for CLUB SM))) Special for CLUB SM))) Special for CLUB SM))) Special for CLUB SM))) Special for CLUB SM))) Special for CLUB SM))) Special for CLUB SM))) Special for CLUB SM))) Special for CLUB SM))) Special for CLUB SM))) Special for CLUB SM))) Special for CLUB SM))) Special for CLUB SM))) Special for CLUB SM))) Special for CLUB SM))) Special for CLUB SM))) Special for CLUB SM))) Special for CLUB SM))) Special for CLUB SM))) Special for CLUB SM))) Special for CLUB SM))) Special for CLUB SM))) Special for CLUB SM))) Special for CLUB SM))) Special for CLUB SM))) Special for CLUB SM))) Special for CLUB SM))) Special for CLUB SM))) Special for CLUB SM))) Special for CLUB SM))) Special for CLUB SM))) Special for CLUB SM))) Special for CLUB SM))) Special for CLUB SM))) Special for CLUB SM))) Special for CLUB SM))) Special for CLUB SM))) Special for CLUB SM))) Special for CLUB SM))) Special for CLUB SM))) Special for CLUB SM))) Special for CLUB SM))) Special for CLUB SM))) Special for CLUB SM))) Special for CLUB SM))) Special for CLUB SM))) Special for CLUB SM))) Special for CLUB SM))) Special for CLUB SM))) Special for CLUB SM))) Special for CLUB SM))) Special for CLUB SM))) Special for CLUB SM))) Special for CLUB SM))) Special for CLUB SM))) Special for CLUB SM))) Special for CLUB SM))) Special for CLUB SM))) Special for CLUB SM))) Special for CLUB SM))) Special for CLUB SM))) Special for CLUB SM))) Special for CLUB SM))) Special for CLUB SM))) Special for CLUB SM))) Special for CLUB SM))) Special for CLUB SM))) Special for CLUB SM))) Special for CLUB SM))) Special for CLUB SM))) Special for CLUB SM))) Special for CLUB SM))) Special for CLUB SM))) Special for CLUB SM))) Special for CLUB SM))) Special for CLUB SM))) Special for CLUB SM))) Special for CLUB SM))) Special for CLUB SM))) Special for CLUB SM))) Special for CLUB SM))) Special for CLUB SM))) Special for CLUB SM))) Special for CLUB SM))) Special for CLUB SM))) Special for CLUB SM))) Special for CLUB SM))) Special for CLUB SM))) Special for CLUB SM))) Special for CLUB SM))) Special for CLUB SM))) Special for CLUB SM))) Special for CLUB SM))) Special for CLUB SM))) Special for CLUB SM))) Special for CLUB SM))) Special for CLUB SM))) Special for CLUB SM))) Special for CLUB SM))) Special for CLUB SM))) Special for CLUB SM))) Special for CLUB SM))) Special for CLUB SM))) Special for CLUB SM))) Special for CLUB SM))) Special for CLUB SM))) Special for CLUB SM))) Special for CLUB SM))) Special for CLUB SM))) Special for CLUB SM))) Special for CLUB SM))) Special for CLUB SM))) Special for CLUB SM))) Special for CLUB SM))) Special for CLUB SM))) Special for CLUB SM))) Special for CLUB SM))) Special for CLUB SM))) Special for CLUB SM))) Special for CLUB SM))) Special for CLUB SM))) Special for CLUB SM))) Special for CLUB SM))) Special for CLUB SM))) Special for CLUB SM))) Special for CLUB SM))) Special for CLUB SM))) Special for CLUB SM))) Special for CLUB SM))) Special for CLUB SM))) Special for CLUB SM))) Special for CLUB SM))) Special for CLUB SM))) Special for CLUB SM))) Special for CLUB SM))) Special for CLUB SM))) Special for CLUB SM))) Special for CLUB SM))) Special for CLUB SM))) Special for CLUB SM))) Special for CLUB SM))) Special for CLUB SM))) Special for CLUB SM))) Special for CLUB SM))) Special for CLUB SM))) Special for CLUB SM))) Special for CLUB SM))) Special for CLUB SM))) Special for CLUB SM))) Special for CLUB SM))) Special for CLUB SM))) Special for CLUB SM))) Special for CLUB SM))) Special for CLUB SM))) Special for CLUB SM))) Special for CLUB SM))) Special for CLUB SM))) Special for CLUB SM))) Special for CLUB SM))) Special for CLUB SM))) Special for CLUB SM))) Special for CLUB SM))) Special for CLUB SM))) Special for CLUB SM))) Special for CLUB SM))) Special for CLUB SM))) Special for CLUB SM))) Special for CLUB SM))) Special for CLUB SM))) Special for CLUB SM))) Special for CLUB SM))) Special for CLUB SM))) Special for CLUB SM))) Special for CLUB SM))) Special for CLUB SM))) Special for CLUB SM))) Special for CLUB SM))) Special for CLUB SM))) Special for CLUB SM))) Special for CLUB SM))) Special for CLUB SM))) Special for CLUB SM))) Special for CLUB SM))) Special for CLUB SM))) Special for CLUB SM))) Special for CLUB SM))) Special for CLUB SM))) Special for CLUB SM))) Special for CLUB SM))) Special for CLUB SM))) Special for CLUB SM))) Special for CLUB SM))) Special for CLUB SM))) Special for CLUB SM))) Special for CLUB SM))) Special for CLUB SM))) Special for CLUB SM))) Special for CLUB SM))) Special for CLUB SM))) Special for CLUB SM))) Special for CLUB SM))) Special for CLUB SM))) Special for CLUB SM))) Special for CLUB SM))) Special for CLUB SM))) Special for CLUB SM))) Special for CLUB SM))) Special for CLUB SM))) Special for CLUB SM))) Special for CLUB SM))) Special for CLUB SM))) Special for CLUB SM))) Special for CLUB SM))) Special for CLUB SM))) Special for CLUB SM))) Special for CLUB SM))) Special for CLUB SM))) Special for CLUB SM))) Special for CLUB SM))) Special for CLUB SM))) Special for CLUB SM))) Special for CLUB SM))) Special for CLUB SM))) Special for CLUB SM))) Special for CLUB SM))) Special for CLUB SM))) Special for CLUB SM))) Special for CLUB SM))) Special for CLUB SM)))

SweetSweetLucia: OnceADayUpdated:
3 Bar Typical Price (Offset 1 Bar)
1 Bar Open Price
Crosses are Opening Crossings of Typical Price
Squares are Intraday Close over Typical Price
Line Graph is Close, with colors
Short, Medium, and Large Fractal Wave Moving Averages
Format is Price Action
Thanks

A_HMS_EMAsthis is an indicator that have many essentials in one indicator and prevent from adding many indicator in chart
Ichimoko clouds and 4 ema from number 19 , 33 , 66 , 199
and an spatial average ema with 2 color that help you to find trend
Histomentu is a great Indicator that combine RSI Composit by RSi line and show momentum of price movement by a histogram
for better use note that:
red line is composite line
green line is rsi line
when composite line run away from histogram momemtum increase rapidly
when composite and rsi line is in same way its time to get position .
some futures is hidden by default:
composite red and green signal line
rmi of price with to color with momentum 4
ema 13, 33 of rmi as signal line
finaly u can change any colors from setting
in background we determine some fills for better use of Indicator
for better use note that:
1_pivots show with tiny triangles bellow and above the candles
red triangles for hi pivots and green triangles for low povots
2_ema19 , 66 , 199 shown on chart by default and you can change its source or length from settings
3- ichimoko cloud help you to determine demand and supply zones that those points are price target to go.

loxxmas - moving averages used in Loxx's indis & stratsLibrary "loxxmas"
TODO:loxx moving averages used in indicators
kama(src, len, kamafastend, kamaslowend)
KAMA Kaufman adaptive moving average
Parameters:
src : float
len : int
kamafastend : int
kamaslowend : int
Returns: array
ama(src, len, fl, sl)
AMA, adaptive moving average
Parameters:
src : float
len : int
fl : int
sl : int
Returns: array
t3(src, len)
T3 moving average, adaptive moving average
Parameters:
src : float
len : int
Returns: array
adxvma(src, len)
ADXvma - Average Directional Volatility Moving Average
Parameters:
src : float
len : int
Returns: array
ahrma(src, len)
Ahrens Moving Average
Parameters:
src : float
len : int
Returns: array
alxma(src, len)
Alexander Moving Average - ALXMA
Parameters:
src : float
len : int
Returns: array
dema(src, len)
Double Exponential Moving Average - DEMA
Parameters:
src : float
len : int
Returns: array
dsema(src, len)
Double Smoothed Exponential Moving Average - DSEMA
Parameters:
src : float
len : int
Returns: array
ema(src, len)
Exponential Moving Average - EMA
Parameters:
src : float
len : int
Returns: array
fema(src, len)
Fast Exponential Moving Average - FEMA
Parameters:
src : float
len : int
Returns: array
hma(src, len)
Hull moving averge
Parameters:
src : float
len : int
Returns: array
ie2(src, len)
Early T3 by Tim Tilson
Parameters:
src : float
len : int
Returns: array
frama(src, len, FC, SC)
Fractal Adaptive Moving Average - FRAMA
Parameters:
src : float
len : int
FC : int
SC : int
Returns: array
instant(src, float)
Instantaneous Trendline
Parameters:
src : float
float : alpha
Returns: array
ilrs(src, int)
Integral of Linear Regression Slope - ILRS
Parameters:
src : float
int : len
Returns: array
laguerre(src, float)
Laguerre Filter
Parameters:
src : float
float : alpha
Returns: array
leader(src, int)
Leader Exponential Moving Average
Parameters:
src : float
int : len
Returns: array
lsma(src, int, int)
Linear Regression Value - LSMA (Least Squares Moving Average)
Parameters:
src : float
int : len
int : offset
Returns: array
lwma(src, int)
Linear Weighted Moving Average - LWMA
Parameters:
src : float
int : len
Returns: array
mcginley(src, int)
McGinley Dynamic
Parameters:
src : float
int : len
Returns: array
mcNicholl(src, int)
McNicholl EMA
Parameters:
src : float
int : len
Returns: array
nonlagma(src, int)
Non-lag moving average
Parameters:
src : float
int : len
Returns: array
pwma(src, int, float)
Parabolic Weighted Moving Average
Parameters:
src : float
int : len
float : pwr
Returns: array
rmta(src, int)
Recursive Moving Trendline
Parameters:
src : float
int : len
Returns: array
decycler(src, int)
Simple decycler - SDEC
Parameters:
src : float
int : len
Returns: array
sma(src, int)
Simple Moving Average
Parameters:
src : float
int : len
Returns: array
swma(src, int)
Sine Weighted Moving Average
Parameters:
src : float
int : len
Returns: array
slwma(src, int)
linear weighted moving average
Parameters:
src : float
int : len
Returns: array
smma(src, int)
Smoothed Moving Average - SMMA
Parameters:
src : float
int : len
Returns: array
super(src, int)
Ehlers super smoother
Parameters:
src : float
int : len
Returns: array
smoother(src, int)
Smoother filter
Parameters:
src : float
int : len
Returns: array
tma(src, int)
Triangular moving average - TMA
Parameters:
src : float
int : len
Returns: array
tema(src, int)
Tripple exponential moving average - TEMA
Parameters:
src : float
int : len
Returns: array
vwema(src, int)
Volume weighted ema - VEMA
Parameters:
src : float
int : len
Returns: array
vwma(src, int)
Volume weighted moving average - VWMA
Parameters:
src : float
int : len
Returns: array
zlagdema(src, int)
Zero-lag dema
Parameters:
src : float
int : len
Returns: array
zlagma(src, int)
Zero-lag moving average
Parameters:
src : float
int : len
Returns: array
zlagtema(src, int)
Zero-lag tema
Parameters:
src : float
int : len
Returns: array
threepolebuttfilt(src, int)
Three-pole Ehlers Butterworth
Parameters:
src : float
int : len
Returns: array
threepolesss(src, int)
Three-pole Ehlers smoother
Parameters:
src : float
int : len
Returns: array
twopolebutter(src, int)
Two-pole Ehlers Butterworth
Parameters:
src : float
int : len
Returns: array
twopoless(src, int)
Two-pole Ehlers smoother
Parameters:
src : float
int : len
Returns: array
JCFBaux Volatility [Loxx]JCFBaux is a volatility indicator that is used to detect early volatility spikes. To be used in conjunction with other momentum indicators for confluence. A Jurik-filtered signal line is included to provide a cutoff for when volatility is low. The JCFBaux is also used to calculate Jurik's "Composite Fractal Behavior". This is a directionless indicator. Many advanced traders will use JCFBaux as a drop in replacement for ADX DI.
What is Jurik Volty used in the Juirk Filter?
One of the lesser known qualities of Juirk smoothing is that the Jurik smoothing process is adaptive. "Jurik Volty" (a sort of market volatility ) is what makes Jurik smoothing adaptive. The Jurik Volty calculation can be used as both a standalone indicator and to smooth other indicators that you wish to make adaptive.
What is the Jurik Moving Average?
Have you noticed how moving averages add some lag (delay) to your signals? ... especially when price gaps up or down in a big move, and you are waiting for your moving average to catch up? Wait no more! JMA eliminates this problem forever and gives you the best of both worlds: low lag and smooth lines.
Ideally, you would like a filtered signal to be both smooth and lag-free. Lag causes delays in your trades, and increasing lag in your indicators typically result in lower profits. In other words, late comers get what's left on the table after the feast has already begun.

Adaptive Qualitative Quantitative Estimation (QQE) [Loxx]Adaptive QQE is a fixed and cycle adaptive version of the popular Qualitative Quantitative Estimation (QQE) used by forex traders. This indicator includes varoius types of RSI caculations and adaptive cycle measurements to find tune your signal.
Qualitative Quantitative Estimation (QQE):
The Qualitative Quantitative Estimation (QQE) indicator works like a smoother version of the popular Relative Strength Index (RSI) indicator. QQE expands on RSI by adding two volatility based trailing stop lines. These trailing stop lines are composed of a fast and a slow moving Average True Range (ATR).
There are many indicators for many purposes. Some of them are complex and some are comparatively easy to handle. The QQE indicator is a really useful analytical tool and one of the most accurate indicators. It offers numerous strategies for using the buy and sell signals. Essentially, it can help detect trend reversal and enter the trade at the most optimal positions.
Wilders' RSI:
The Relative Strength Index ( RSI ) is a well versed momentum based oscillator which is used to measure the speed (velocity) as well as the change (magnitude) of directional price movements. Essentially RSI , when graphed, provides a visual mean to monitor both the current, as well as historical, strength and weakness of a particular market. The strength or weakness is based on closing prices over the duration of a specified trading period creating a reliable metric of price and momentum changes. Given the popularity of cash settled instruments (stock indexes) and leveraged financial products (the entire field of derivatives); RSI has proven to be a viable indicator of price movements.
RSX RSI:
RSI is a very popular technical indicator, because it takes into consideration market speed, direction and trend uniformity. However, the its widely criticized drawback is its noisy (jittery) appearance. The Jurk RSX retains all the useful features of RSI , but with one important exception: the noise is gone with no added lag.
Rapid RSI:
Rapid RSI Indicator, from Ian Copsey's article in the October 2006 issue of Stocks & Commodities magazine.
RapidRSI resembles Wilder's RSI , but uses a SMA instead of a WilderMA for internal smoothing of price change accumulators.
VHF Adaptive Cycle:
Vertical Horizontal Filter (VHF) was created by Adam White to identify trending and ranging markets. VHF measures the level of trend activity, similar to ADX DI. Vertical Horizontal Filter does not, itself, generate trading signals, but determines whether signals are taken from trend or momentum indicators. Using this trend information, one is then able to derive an average cycle length.
Band-pass Adaptive Cycle:
Even the most casual chart reader will be able to spot times when the market is cycling and other times when longer-term trends are in play. Cycling markets are ideal for swing trading however attempting to “trade the swing” in a trending market can be a recipe for disaster. Similarly, applying trend trading techniques during a cycling market can equally wreak havoc in your account. Cycle or trend modes can readily be identified in hindsight. But it would be useful to have an objective scientific approach to guide you as to the current market mode.
There are a number of tools already available to differentiate between cycle and trend modes. For example, measuring the trend slope over the cycle period to the amplitude of the cyclic swing is one possibility.
We begin by thinking of cycle mode in terms of frequency or its inverse, periodicity. Since the markets are fractal ; daily, weekly, and intraday charts are pretty much indistinguishable when time scales are removed. Thus it is useful to think of the cycle period in terms of its bar count. For example, a 20 bar cycle using daily data corresponds to a cycle period of approximately one month.
When viewed as a waveform, slow-varying price trends constitute the waveform's low frequency components and day-to-day fluctuations (noise) constitute the high frequency components. The objective in cycle mode is to filter out the unwanted components--both low frequency trends and the high frequency noise--and retain only the range of frequencies over the desired swing period. A filter for doing this is called a bandpass filter and the range of frequencies passed is the filter's bandwidth.
Included:
-Toggle on/off bar coloring
-Customize RSI signal using fixed, VHF Adaptive, and Band-pass Adaptive calculations
-Choose from three different RSI types
Visuals:
-Red/Green line is the moving average of RSI
-Thin white line is the fast trend
-Dotted yellow line is the slow trend
Happy trading!

Aroon Oscillator of Adaptive RSI [Loxx]Aroon Oscillator of Adaptive RSI uses RSI to calculate AROON in attempt to capture more trend and momentum quicker than Aroon or RSI alone. Aroon Oscillator of Adaptive RSI has three different types of RSI calculations and the choice of either fixed, VHF Adaptive, or Band-pass Adaptive cycle measures to calculate RSI.
Arron Oscillator:
The Aroon Oscillator was developed by Tushar Chande in 1995 as part of the Aroon Indicator system. Chande’s intention for the system was to highlight short-term trend changes. The name Aroon is derived from the Sanskrit language and roughly translates to “dawn’s early light.”
The Aroon Oscillator is a trend-following indicator that uses aspects of the Aroon Indicator (Aroon Up and Aroon Down) to gauge the strength of a current trend and the likelihood that it will continue.
Aroon oscillator readings above zero indicate that an uptrend is present, while readings below zero indicate that a downtrend is present. Traders watch for zero line crossovers to signal potential trend changes. They also watch for big moves, above 50 or below -50 to signal strong price moves.
Wilders' RSI:
The Relative Strength Index (RSI) is a well versed momentum based oscillator which is used to measure the speed (velocity) as well as the change (magnitude) of directional price movements. Essentially RSI, when graphed, provides a visual mean to monitor both the current, as well as historical, strength and weakness of a particular market. The strength or weakness is based on closing prices over the duration of a specified trading period creating a reliable metric of price and momentum changes. Given the popularity of cash settled instruments (stock indexes) and leveraged financial products (the entire field of derivatives); RSI has proven to be a viable indicator of price movements.
RSX RSI:
RSI is a very popular technical indicator, because it takes into consideration market speed, direction and trend uniformity. However, the its widely criticized drawback is its noisy (jittery) appearance. The Jurk RSX retains all the useful features of RSI, but with one important exception: the noise is gone with no added lag.
Rapid RSI:
Rapid RSI Indicator, from Ian Copsey's article in the October 2006 issue of Stocks & Commodities magazine.
RapidRSI resembles Wilder's RSI, but uses a SMA instead of a WilderMA for internal smoothing of price change accumulators.
VHF Adaptive Cycle:
Vertical Horizontal Filter (VHF) was created by Adam White to identify trending and ranging markets. VHF measures the level of trend activity, similar to ADX DI. Vertical Horizontal Filter does not, itself, generate trading signals, but determines whether signals are taken from trend or momentum indicators. Using this trend information, one is then able to derive an average cycle length.
Band-pass Adaptive Cycle
Even the most casual chart reader will be able to spot times when the market is cycling and other times when longer-term trends are in play. Cycling markets are ideal for swing trading however attempting to “trade the swing” in a trending market can be a recipe for disaster. Similarly, applying trend trading techniques during a cycling market can equally wreak havoc in your account. Cycle or trend modes can readily be identified in hindsight. But it would be useful to have an objective scientific approach to guide you as to the current market mode.
There are a number of tools already available to differentiate between cycle and trend modes. For example, measuring the trend slope over the cycle period to the amplitude of the cyclic swing is one possibility.
We begin by thinking of cycle mode in terms of frequency or its inverse, periodicity. Since the markets are fractal ; daily, weekly, and intraday charts are pretty much indistinguishable when time scales are removed. Thus it is useful to think of the cycle period in terms of its bar count. For example, a 20 bar cycle using daily data corresponds to a cycle period of approximately one month.
When viewed as a waveform, slow-varying price trends constitute the waveform's low frequency components and day-to-day fluctuations (noise) constitute the high frequency components. The objective in cycle mode is to filter out the unwanted components--both low frequency trends and the high frequency noise--and retain only the range of frequencies over the desired swing period. A filter for doing this is called a bandpass filter and the range of frequencies passed is the filter's bandwidth.
Included:
-Toggle on/off bar coloring
-Customize RSI signal using fixed, VHF Adaptive, and Band-pass Adaptive calculations
-Choose from three different RSI types
Happy trading!
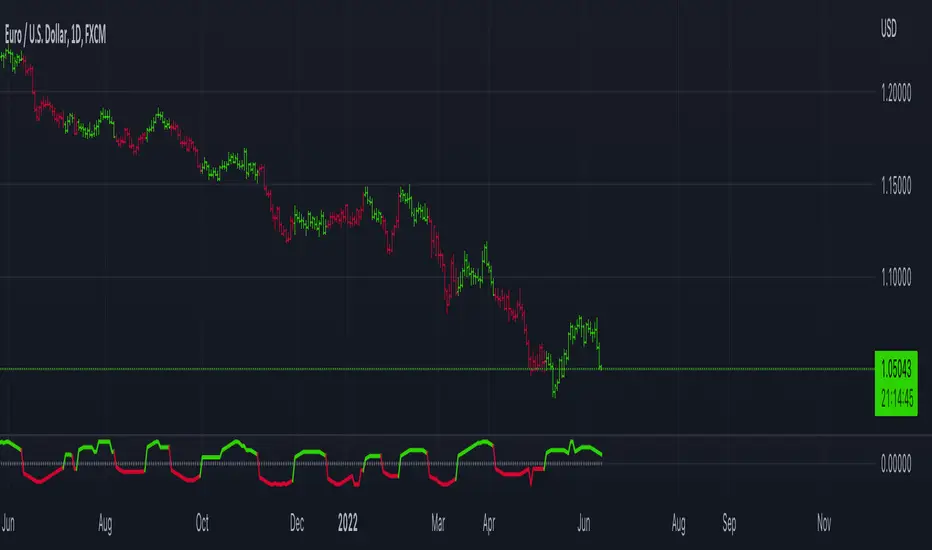
Adaptive, Zero lag Schaff Trend Cycle [Loxx]TASC's March 2008 edition Traders' Tips includes an article by John Ehlers titled "Measuring Cycle Periods," and describes the use of bandpass filters to estimate the length, in bars, of the currently dominant price cycle.
What are Dominant Cycles and Why should we use them?
Even the most casual chart reader will be able to spot times when the market is cycling and other times when longer-term trends are in play. Cycling markets are ideal for swing trading however attempting to “trade the swing” in a trending market can be a recipe for disaster. Similarly, applying trend trading techniques during a cycling market can equally wreak havoc in your account. Cycle or trend modes can readily be identified in hindsight. But it would be useful to have an objective scientific approach to guide you as to the current market mode.
There are a number of tools already available to differentiate between cycle and trend modes. For example, measuring the trend slope over the cycle period to the amplitude of the cyclic swing is one possibility.
We begin by thinking of cycle mode in terms of frequency or its inverse, periodicity. Since the markets are fractal ; daily, weekly, and intraday charts are pretty much indistinguishable when time scales are removed. Thus it is useful to think of the cycle period in terms of its bar count. For example, a 20 bar cycle using daily data corresponds to a cycle period of approximately one month.
When viewed as a waveform, slow-varying price trends constitute the waveform's low frequency components and day-to-day fluctuations (noise) constitute the high frequency components. The objective in cycle mode is to filter out the unwanted components--both low frequency trends and the high frequency noise--and retain only the range of frequencies over the desired swing period. A filter for doing this is called a bandpass filter and the range of frequencies passed is the filter's bandwidth.
Indicator Features
-Zero lag or Regular Schaff Trend Cycle calculation
- Fixed or Band-pass Dominant Cycle for Schaff Trend Cycle MA period inputs
-10 different moving average options for Zero lag calculations
-Separate Band-pass Dominant Cycle calculations for both Schaff Trend Cycle and MA calculations
- Slow-to-Fast Band-pass Dominant Cycle input to tweak the ratio of Schaff Trend Cycle MA input periods as they relate to each other

Hybrid, Zero lag, Adaptive cycle MACD [Loxx]TASC's March 2008 edition Traders' Tips includes an article by John Ehlers titled "Measuring Cycle Periods," and describes the use of bandpass filters to estimate the length, in bars, of the currently dominant price cycle.
What are Dominant Cycles and Why should we use them?
Even the most casual chart reader will be able to spot times when the market is cycling and other times when longer-term trends are in play. Cycling markets are ideal for swing trading however attempting to “trade the swing” in a trending market can be a recipe for disaster. Similarly, applying trend trading techniques during a cycling market can equally wreak havoc in your account. Cycle or trend modes can readily be identified in hindsight. But it would be useful to have an objective scientific approach to guide you as to the current market mode.
There are a number of tools already available to differentiate between cycle and trend modes. For example, measuring the trend slope over the cycle period to the amplitude of the cyclic swing is one possibility.
We begin by thinking of cycle mode in terms of frequency or its inverse, periodicity. Since the markets are fractal; daily, weekly, and intraday charts are pretty much indistinguishable when time scales are removed. Thus it is useful to think of the cycle period in terms of its bar count. For example, a 20 bar cycle using daily data corresponds to a cycle period of approximately one month.
When viewed as a waveform, slow-varying price trends constitute the waveform's low frequency components and day-to-day fluctuations (noise) constitute the high frequency components. The objective in cycle mode is to filter out the unwanted components--both low frequency trends and the high frequency noise--and retain only the range of frequencies over the desired swing period. A filter for doing this is called a bandpass filter and the range of frequencies passed is the filter's bandwidth .
Indicator Features
-Zero lag or Regular MACD/signal calculation
- Fixed or Band-pass Dominant Cycle for MACD and Signal MA period inputs
-10 different moving average options for both MACD and Signal MA calculations
-Separate Band-pass Dominant Cycle calculations for both MACD and Signal MA calculations
- Slow-to-Fast Band-pass Dominant Cycle input to tweak the ratio of MACD MA input periods as they relate to each other
