Eliza Ellis Improved FractalsA little side project of mine. may enhance further in the future. Used best for scalping. The longer you're in the market the more the news is waiting to eat you so I'd recommend using high volume and getting in and out quickly
Search in scripts for "Fractal"

DR/IDR, fractals, break + EMA Clouds + VWAPThis indicator is a powerful, multi-layered trading tool that combines three distinct forms of market analysis—volume, trend, and opening volatility—onto a single chart.
1. Opening Range Breakout (ORB) System
This is the foundation of the indicator, designed to capture the initial volatility and set key price boundaries for the trading day.
Time Focus: The indicator's primary analysis is centered on a specific, user-defined time period (default is 9:30 AM to 10:30 AM New York Time). Nothing related to the ORB drawing will appear on the chart before this session starts.
Wick High/Low (The Trigger): These lines track the absolute highest and lowest prices reached during the time window. They define the full extent of the initial range and are used to determine when a genuine breakout occurs.
Body High/Low (The Range & Targets): These lines track the highest and lowest open/close prices of the candles within the session. This area forms the central, shaded zone, representing the core consolidation area.
Range Shading: The background between the Body High and Body Low is shaded, but this visual feature only appears during the active forming time window (e.g., 9:30 AM to 10:30 AM) to maintain chart clarity.
Fractals: While the range is forming, the indicator detects 5-bar Williams Fractal patterns that occur inside the range. These small triangles (▲ or ▼) highlight minor reversal points established by the early trading action.
Breakout Signal: After the user-defined time window closes, the indicator waits. If a subsequent candle's price moves above the Wick High or below the Wick Low, a "BREAK" label is displayed on that candle. It is programmed to label only the first decisive break in each direction per day.
Extension Targets: When a breakout occurs, target lines are automatically projected above the Body High (for a bullish break) or below the Body Low (for a bearish break). The distance between these targets is calculated based on a user-defined fraction (e.g., 0.5 steps) of the total height of the Body Range.
Line Cutoff: For tidiness, you can set a "Stop Time" (e.g., 4:00 PM) after which the ORB lines will automatically disappear.
2. EMA Clouds (Trend and Momentum)
Four distinct Exponential Moving Average (EMA) clouds are plotted to provide a dynamic, multi-speed view of the market's trend and momentum.
Structure: Each "Cloud" is the shaded area between two EMAs (one shorter length and one longer length). The indicator includes four customizable pairs (defaulting to common settings like 8/9, 8/14, 34/50, and 14/21).
Trend Coloring: The clouds are color-coded:
Bullish (Greenish): The shorter EMA is trading above the longer EMA, signaling upward momentum.
Bearish (Reddish): The shorter EMA is trading below the longer EMA, signaling downward momentum.
Application: These clouds are used to confirm the overall market direction or identify potential zones of support and resistance.
3. Volume-Weighted Average Price (VWAP)
The VWAP is a crucial anchor for measuring the market's efficiency throughout the trading day.
Function: It calculates the average price of the asset, giving more weight to prices where higher volume was traded.
Context: It helps traders quickly determine if the current price is trading at a premium (above VWAP) or a discount (below VWAP) relative to the day's volume.
Reset: The VWAP line automatically resets at the beginning of each trading day.
Customization: The VWAP line can be toggled on or off, and its color and width are fully adjustable.

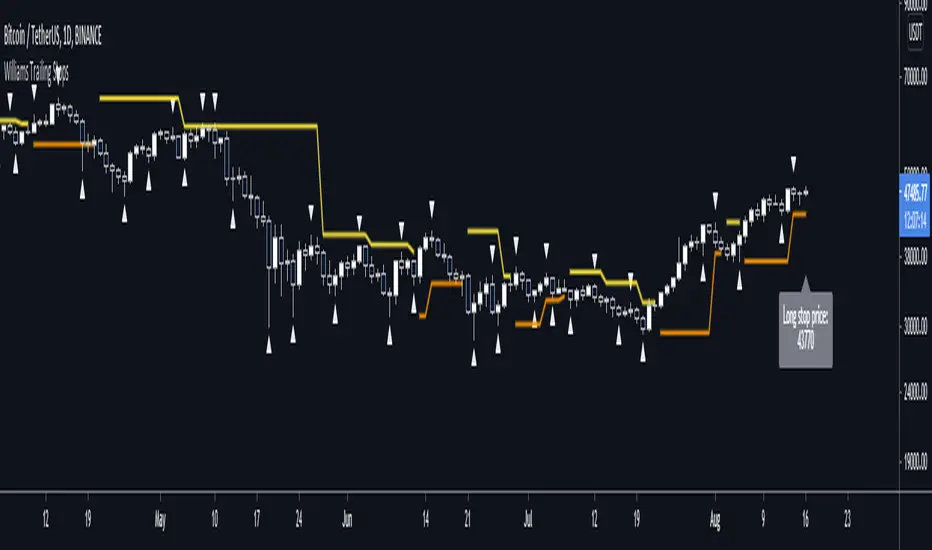
Williams Fractal Trailing StopsUnlike the built-in version, you can configure how many bars it takes to confirm a fractal. This indicator plots all Williams high and low fractals, and a stop line that trails the fractals up and down. Includes long and short stop alerts. You can choose whether the trail flips long-short based on the price being exceeded within a candle or on candle close. This indicator deals only with fractals and doesn't get into the Alligator or anything else.
I've commented it extensively, so that it might be useful for people learning Pinescript. Enjoy!
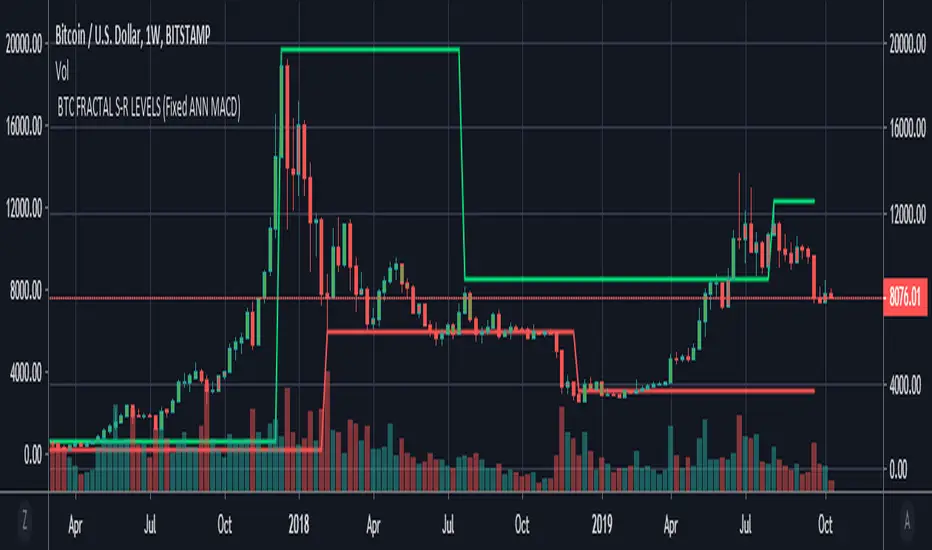
BTC FRACTAL ANN S-R LEVELS (Fixed ANN MACD)
This script is an adaptation of my deep learning system for Bitcoin to fractals.
Fractal codes are not belong to me. Original :
The code for the Deep learning (ANN MACD BTC) work belongs to me. Original:
I didn't get license for this script because the fractal codes don't belong to me.You can use it for any purpose.
This command can be a very helpful guide.You can use that fractals with your indicators for Bitcoin.
You can also combine these levels with ANN - MACD - BTC script.
Scripts about Artificial Neural Networks (ANN) will continue soon !
I hope it will help us to gain insight into technical analysis.
Best regards. Noldo.
[_ParkF]FractalTop gray line is the fractal resistance.
Bottom gray line is the fractal support.
Central red line is the average of the top&bottom fractal.
Fractals can be displayed as support and resistance, and the red fractal average line indicates a trend.
상단 회색선은 프랙탈 저항,
하단 회색선은 프랙탈 지지,
중앙 빨간선은 프랙탈 상,하단의 평균,
프랙탈은 지지와 저항으로 표시되고 빨간색 프랙탈 평균선은 추세입니다.

robotrading ZZ-8 fractalsThis is another version of my ZZ type strategy. This script now uses Bill Williams' fractals.
Strategy
Step 1: Calculate Bill Williams' Fractals
Step 2. A line is drawn from the fractal
Step 3. Create a stop order to enter the position on the line
Trading
If the price is above the lime line, open a long position (and close a short position).
If the price is below the red line, open a short position (and close a long position).
For
"Cryptocurrency / fiat or stablecoins" (BTC/USD, ETH/USDT, etc)
Timeframe 4 hours or more

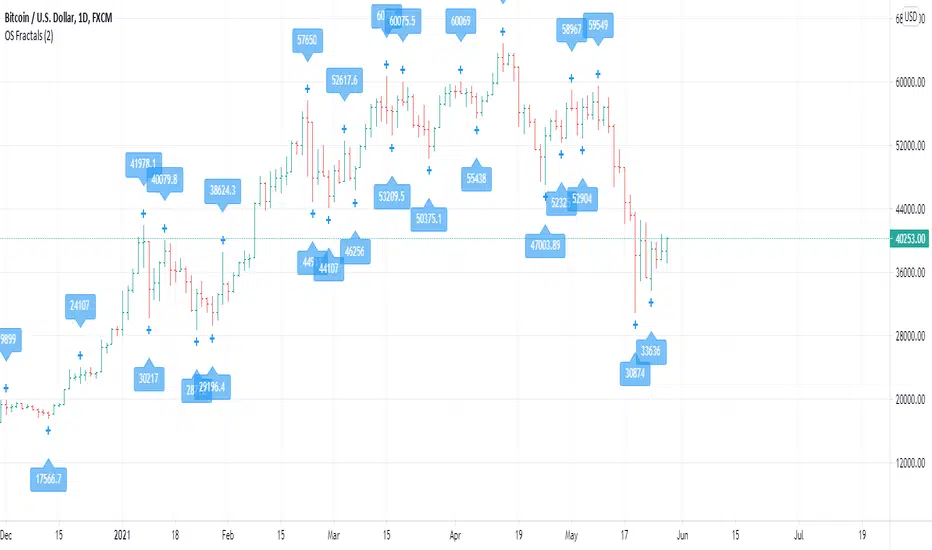
OS FractalsAn up fractal is formed when a high is both preceded and followed by lower highs. A down fractal is formed when a low is both preceded and followed by higher lows.
Bill Williams uses a period of 2 (2 after and 2 before) to define a fractal. This indicator has 2 as default but lets you decide the range you want.
The indicator lets you also select alerts when price crosses an up of down fractal, which would usually mean to entry a position. This indicator works best when used with an alligator, as long signals are valid above the Balance Line and short signals are valid when triggered below the Balance Line.
Any comments for improvement are welcome.
Hotch v1.02 RSI+Fractals/VWAP Bands/Smoothed Moving Average. In this script the RSI is used the limit number of displayed fractals to only those fractals that are triggered in the RSI Overbought and Oversold areas. This helps keep the chart cleaner looking when combined with other indicators so other icons that are plotted above and below candles are not covered up.
For example if the RSI drops below 30 the next fractal would be displayed.
If the RSI stays below 30 each fractal would be displayed.
If the RSI dips below 30 and returns above 30 before there is a fractal is displayed, the next valid fractal would still be displayed.
With optimization of the RSI values this indicator can be used in confluence with the included VWAP bands and Moving average to find trend reversal entry points for trades. Also recommended is to use a divergence identifying lower indicator as a secondary confirmation of trade entry.
Example of a potential long entry using the displayed chart.
1) RSI under 30
2) Price was recently outside of your chosen VWAP multiple.
3) a fractal was triggered.
Additionaly:
4) Use other indicators or other confluences for a stronger trade signal.
5) Use your preferred method of determining entry price stop loss and take profit.
NOTE: Fractals normally paint two bars behind the current bar. In this code, with the combination of the RSI and Fractal Trigger, the fractal paints an icon on the current bar.

BTC Fractal Momentum ExtremesDescription – BTC Fractal Momentum Extremes (BTCFME)
BTC Fractal Momentum Extremes (BTCFME) is a multi-factor, multi-method technical indicator designed to detect potential top and bottom reversal points in Bitcoin price action by integrating a confluence of unconventional signals. It combines fractals, adaptive momentum, volume dynamics, price velocity convergence, and market structure shifts — all filtered through real-time volatility and contextualized by temporal market conditions.
This tool is best used by traders looking to spot high-confidence turning points on intraday or swing timeframes, and works particularly well in volatile, momentum-driven environments.
Key Components & Methodology
BTCFME utilizes five independent signal-generation methods:
1. Fractal Volume Divergence
Detects reversal fractals in price (5-bar patterns) and validates them with volume anomalies:
Volume spikes (e.g., climax moves) or
Volume exhaustion (e.g., waning participation)
2. Adaptive Momentum Oscillator
Calculates momentum normalized by ATR-adjusted volatility, filtering out noise in choppy markets. It spots directional shifts when momentum inflects from extreme levels.
3. Market Structure Breaks
Identifies dynamic support and resistance using a configurable lookback, and flags potential breakouts or breakdowns from those levels.
4. Price Velocity Convergence
Analyzes the rate of change (velocity) and its acceleration. When both compress within a narrow volatility range, it signals a potential inflection zone.
5. Temporal Confluence Filter
Signals are only considered valid during active market hours (9 AM – 4 PM, excluding weekends) to reduce false positives during illiquid or inefficient trading periods.
Signal Logic & Sensitivity
Signals are generated when at least 3 out of 4 core methods agree, controlled by the Signal Sensitivity setting:
1 (High Sensitivity) = Trigger signals with fewer confirmations
5 (Low Sensitivity) = Require stronger multi-factor confluence
🔹 Buy (Bottom) Signals trigger when:
Bullish fractals appear
Momentum is deeply negative but improving
Price tests structure support
Velocity compresses below average
🔺 Sell (Top) Signals trigger when:
Bearish fractals with volume spikes appear
Momentum peaks and starts to decline
Price tests resistance
Velocity compresses near highs
Visual Features
Arrows: Buy signals = green arrow below candle. Sell signals = red arrow above candle.
Background Color: Indicates overall momentum regime (green = bullish bias, red = bearish, gray = neutral).
Dynamic Support & Resistance Lines: Based on recent swing highs/lows.
Signal Table (top-right): Shows real-time stats on:
Momentum value
Volatility factor
Volume strength (vs. 20-SMA)
Market structure status
Alerts
You can set alerts using the built-in conditions:
BTC Bottom Alert → Fires on potential market bottoms.
BTC Top Alert → Fires on potential market tops.
These alerts are filtered to avoid whipsaw conditions, by checking that opposite signals did not trigger in the last 2 candles.
How to Use
Timeframes: Best suited for 1H–4H and Daily BTC charts, but adaptable to others with parameter tuning.
Confirm with Price Action: Use BTCFME signals in conjunction with candlestick patterns or S/R zones for best results.
Adjust Sensitivity: Lower values catch more signals (good for scalping), higher values filter for stronger reversals (ideal for swing trades).
Use in Trending or Reversing Markets: BTCFME performs best during trending environments or volatile reversals — avoid during prolonged flat/ranging zones.
Notes & Recommendations
BTCFME is not a standalone buy/sell signal; combine it with risk management and trend confirmation tools.
Avoid using it during extremely low-volume sessions (e.g., late weekends).
Adjust parameters based on BTC's evolving volatility and your trading style.

Prometheus Fractal WaveThe Fractal Wave is an indicator that uses a fractal analysis to determine where reversals may happen. This is done through a Fractal process, making sure a price point is in a certain set and then getting a Distance metric.
Calculation:
A bullish Fractal is defined by the current bar’s high being less than the last bar’s high, and the last bar’s high being greater than the second to last bar’s high, and the last bar’s high being greater than the third to last bar’s high.
A bearish Fractal is defined by the current low being greater than the last bar’s low, and the last bar’s low being less than the second to last bar’s low, and the last bar’s low being less than the third to last bar’s low.
When there is that bullish or bearish fractal the value we store is either the last bar’s high or low respective to bullish or bearish fractal.
Once we have that value stored we either subtract the last bar’s low from the bullish Fractal value, and subtract the last bar’s high from the bearish Fractal value. Those are our Distances.
Code:
isBullishFractal() =>
high > high and high < high and high > high
isBearishFractal() =>
low < low and low > low and low < low
var float lastBullishFractal = na
var float lastBearishFractal = na
if isBullishFractal() and barstate.isconfirmed
lastBullishFractal := high
if isBearishFractal() and barstate.isconfirmed
lastBearishFractal := low
//------------------------------
//-------CACLULATION------------
//------------------------------
bullWaveDistance = na(lastBullishFractal) ? na : lastBullishFractal - low
bearWaveDistance = na(lastBearishFractal) ? na : high - lastBearishFractal
We then plot the bullish distance and the negative bearish distance.
The trade scenarios come from when one breaks the zero line and then goes back above or below. So if the last bullish distance was below 0 and is now above, or if the last negative bearish distance was above 0 and now below. We plot a green label below a candle for a bullish scenario, or a red label above a candle for a bearish one, you can turn them on or off.
Code:
plot(bullWaveDistance, color=color.green, title="Bull Wave Distance", linewidth=2)
plot(-bearWaveDistance, color=color.red, title="Bear Wave Distance", linewidth=2)
plot(0, "Zero Line", color=color.gray, display = display.pane)
bearish_reversal = plot_labels ? bullWaveDistance < 0 and bullWaveDistance > 0 : na
bullish_reversal = plot_labels ? -bearWaveDistance > 0 and -bearWaveDistance < 0 : na
plotshape(bullish_reversal, location=location.belowbar, color=color.green, style=shape.labelup, title="Bullish Fractal", text="↑", display = display.all - display.status_line, force_overlay = true)
plotshape(bearish_reversal, location=location.abovebar, color=color.red, style=shape.labeldown, title="Bearish Fractal", text="↓", display = display.all - display.status_line, force_overlay = true)
We can see in this daily NASDAQ:QQQ chart that the indicator gives us marks that can either be used as Reversal signals or as breathers in the trend.
Since it is designed to provide reversals, on something like Gold where the uptrend has been strong, the signals may be just short breathers, not full blown strong reversal signs.
The indicator works just as well intra day as it does on larger timeframes.
We encourage traders to not follow indicators blindly, none are 100% accurate. Please comment on any desired updates, all criticism is welcome!

Two Fractals TrendlinesThis study draws a trend line for the last two Bill Williams up-fractals and down-fractals.
Trend line break signals and alerts can optionally be added.

PivotThis library was designed to create three different datasets using Bill Williams fractals. The goal is to spot trends in reversal data and ultimately use these datasets to help predict future price reversals.
First, the pivot() function is used to initialize and populate three separate arrays (high pivot , low pivot , all pivots ). Since each high/low price depends on the bar_index, the bar_index, pivot direction(high/low), and high/low values are compressed into a string to maintain the data's integrity ("__"). Once each string array is populated and organized by bar_index, all three are returned inside a tuple. The return value must be deconstructed H,L,A =pivot() for each array's values to be accessed using getPivot() . This boilerplate allows for data to be accessed more efficiently in a recursive environment. getPivot() was designed to be used inside of a for or while block to populate matrices for further analyses. Again, getPivot() return values must be exposed through deconstruction. x,d,y =getPivot(). See code for more details.
pivot(int XLR) initializes and populates arrays
Parameters
XLR - number of bars to the left and right that must be lower for a high to be considered a pivotHigh, or vice versa. This number will drastically change the size and scope of the returned datasets. smaller values will produce much larger datasets, which might model short term price activity well. In contrast, larger values will produce smaller datasets which might model longer term price activity well.
Returns - tuple [string ]
getPivot(string arrayID, int index) accesses array data
Parameters
arrayID - the variable name for one of the three arrays returned by pivot().
index - the index of the provided array, with 0 being the most recent pivot point. can be set to " i " in a loop to access values recursively
Returns - tuple

Makuchaku's Trade Tools - Pivots/Fractals & CrossoversPivots/Fractals are at minimum a 3 candlestick pattern.
Bearish pivot/fractal is formed when a candle is flanked by 2 lower candles on either side
Bullish pivot/fractal is formed when a candle is flanked by 2 higher candles on either side
They are great to determine market structure.
This indicator also prints boxes when those pivots/fractals are crossed over, printing bearish & bullish boxes.

$MTF Fractal Echo DetectorMIL:MTVFR FRACTAL ECHO DETECTOR by Timmy741
The first public multi-timeframe fractal convergence system that actually works.
Market makers don’t move price randomly.
They test the same fractal structure on lower timeframes first → then execute the real move on higher timeframes.
This indicator catches the “echo” — when 3–5 timeframes are printing fractals at almost the exact same price level.
That’s not coincidence. That’s preparation.
FEATURES
• 5 simultaneous timeframes (1min → 4H by default)
• Real Williams Fractal detection (configurable period)
• Dynamic echo tolerance & minimum TF alignment
• Visual S/R zones from every timeframe
• Bullish / Bearish echo convergence signals
• Strength meter (3/5, 4/5, 5/5 TF alignment)
• Zero repainting — uses proper lookahead=off
• Fully Pine v6 typed + optimized
USE CASE
When you see a 4/5 or 5/5 echo:
→ That level is being defended or attacked with intent
→ 80%+ chance the next real move comes from there
→ Trade the breakout or reversal at that exact fractal cluster
Works insane on:
• BTC / ETH (all timeframes)
• Nasdaq / SPX futures
• Forex majors (especially GBP & gold)
• 2025 small-cap rotation setups
100% Open Source • MPL 2.0 • Built by Timmy741 • December 2024
If you know about fractal echoes… you already know.
#fractal #mtf #echo #williamsfractal #multitimeframe #smartmoney #ict #smc #orderflow #convergence #timmy741 #snr #structure

Alpha Fractal BandsWilliams fractals are remarkable support and resistance levels used by many traders. However, it can sometimes be challenging to use them frequently and get confirmation from other oscillators and indicators. With the new "Alpha Fractal Bands", a unique blend of Williams Fractals and Bollinger Bands emerges, offering a fresh perspective. Extremes can be utilized as price reversals or for taking profits. I look forward to hearing your thoughts. Best regards... Happy trading!
An easy solution for long positions is to:
Identify a bullish trend or a potential entry point for a long position.
Set a stop-loss order to limit potential losses if the trade goes against you.
Determine a target price or take-profit level to lock in profits.
Consider using technical indicators or analysis tools to confirm the strength of the bullish trend.
Regularly monitor the trade and make necessary adjustments based on market conditions.
An easy solution for short positions could be to follow these steps:
Identify a bearish trend or a potential entry point for a short position.
Set a stop-loss order to limit potential losses if the trade goes against you.
Determine a target price or take-profit level to lock in profits.
Consider using technical indicators or analysis tools to confirm the strength of the bearish trend.
Regularly monitor the trade and make necessary adjustments based on market conditions.
Remember, it's important to conduct thorough research and analysis before entering any trade and to manage your risk effectively.
To stay updated with the content, don't forget to follow and engage with it on TV, my friends. Remember to leave comments as well :)

Trend FriendTrend Friend — What it is and how to use it
I built Trend Friend to stop redrawing the same trendlines all day. It automatically connects confirmed swing points (fractals) and keeps the most relevant lines in front of you. The goal: give you clean, actionable structure without the guesswork.
What it does (in plain English)
Finds swing highs/lows using a Fractal Period you choose.
Draws auto-trendlines between the two most recent confirmed highs and the two most recent confirmed lows.
Colours by intent:
Lines drawn from highs (potential resistance / bearish) = Red
Lines drawn from lows (potential support / bullish) = Green
Keeps the chart tidy: The newest lines are styled as “recent,” older lines are dimmed as “historical,” and it prunes anything beyond your chosen limit.
Optional crosses & alerts: You can highlight when price closes across the most recent line and set alerts for new lines formed and upper/lower line crosses.
Structure labels: It tags HH, LH, HL, LL at the swing points, so you can quickly read trend/rotation.
How it works (under the hood)
A “fractal” here is a confirmed pivot: the highest high (or lowest low) with n bars on each side. That means pivots only confirm after n bars, so signals are cleaner and less noisy.
When a new pivot prints, the script connects it to the prior pivot of the same type (high→high, low→low). That gives you one “bearish” line from highs and one “bullish” line from lows.
The newest line is marked as recent (brighter), and the previous recent line becomes historical (dimmed). You can keep as many pairs as you want, but I usually keep it tight.
Inputs you’ll actually use
Fractal Period (n): this is the big one. It controls how swingy/strict the pivots are.
Lower n → more swings, more lines (faster, noisier)
Higher n → fewer swings, cleaner lines (slower, swing-trade friendly)
Max pair of lines: how many pairs (up+down) to keep on the chart. 1–3 is a sweet spot.
Extend: extend lines Right (my default) or Both ways if you like the context.
Line widths & colours: recent vs. historical are separate so you can make the active lines pop.
Show crosses: toggle the X markers when price crosses a line. I turn this on when I’m actively hunting breakouts/retests.
Reading the chart
Red lines (from highs): I treat these as potential resistance. A clean break + hold above a red line often flips me from “fade” to “follow.”
Green lines (from lows): Potential support. Same idea in reverse: break + hold below and I stop buying dips until I see structure reclaim.
HH / LH / HL / LL dots: quick read on structure.
HH/HL bias = uptrend continuation potential
LH/LL bias = downtrend continuation potential
Mixed prints = rotation/chop—tighten risk or wait for clarity.
My H1 guidance (fine-tuning Fractal Period)
If you’re mainly on H1 (my use case), tune like this:
Fast / aggressive: n = 6–8 (lots of signals, good for momentum days; more chop risk)
Balanced (recommended): n = 9–12 (keeps lines meaningful but responsive)
Slow / swing focus: n = 13–21 (filters noise; better for trend days and higher-TF confluence)
Rule of thumb: if you’re getting too many touches and whipsaws, increase n. If you’re late to obvious breaks, decrease n.
How I trade it (example workflow)
Pick your n for the session (H1: start at 9–12).
Mark the recent red & green lines. That’s your immediate structure.
Look for interaction:
Rejections from a line = fade potential back into the range.
Break + close across a line = watch the retest for continuation.
Confirm with context: session bias, HTF structure, and your own tools (VWAP, RSI, volume, FVG/OB, etc.).
Plan the trade: enter on retest or reclaim, stop beyond the line/last swing, target the opposite side or next structure.
Alerts (set and forget)
“New trendline formed” — fires when a new high/low pivot confirms and a fresh line is drawn.
“Upper/lower trendline crossed” — fires when price crosses the most recent red/green line.
Use these to track structure shifts without staring at the screen.
Good to know (honest limitations)
Confirmation lag: pivots need n bars on both sides, so signals arrive after the swing confirms. That’s by design—less noise, fewer fake lines.
Lines update as structure evolves: when a new pivot forms, the previous “recent” line becomes “historical,” and older ones can be removed based on your max setting.
Not an auto trendline crystal ball: it won’t predict which line holds or breaks—it just keeps the most relevant structure clean and up to date.
Final notes
Works on any timeframe; I built it with H1 in mind and scale to H4/D1 by increasing n.
Pairs nicely with session tools and VWAP for intraday, or with supply/demand / FVGs for swing planning.
Risk first: lines are structure, not guarantees. Manage position size and stops as usual.
Not financial advice. Trade your plan. Stay nimble.

MultiTimeFrame Fractals D W M [xdecow]This indicator shows fractals in different timeframes. With the possibility of coloring the bars with any combination of current, daily, weekly and monthly timeframes.
The return points are calculated as follows:
high > last 3 highs and close above highest low
low < last 3 lows and closes below lowest high
The direction of higher timeframes fractals tend to be more durable and reliable. This indicator helps to find the fractal alignment of different timeframes, so that you can look for trade opportunities in the same direction as the higher timeframes and improve your chances.

Price Action + Fractals DetectorThe Price Action Patterns Detector indicator also includes a Fractal (WICK.ED style). This way, you'll see Pinbar, Engulfing, Doji, Inside/Outside Bar, Morning/Evening Star formations, and fractals will appear. 🔥

Stoch_RSIStochastic RSI – Advanced Divergence Indicator
This custom indicator is an advanced version of the Stochastic RSI that not only smooths and refines the classic RSI input but also automatically detects both regular and hidden divergences using two powerful methods: fractal-based and pivot-based detection. Originally inspired by contributions from @fskrypt, @RicardoSantos, and later improved by developers like @NeoButane and @FYMD, this script has been fully refined for clarity and ease-of-use.
Key Features:
Dual Divergence Detection:
Fractal-Based Divergence: Uses a four-candle pattern to confirm top and bottom fractals for bullish and bearish divergences.
Pivot-Based Divergence: Employs TradingView’s built-in pivot functions for an alternate view of divergence conditions.
Customizable Settings:
The inputs are organized into logical groups (Stoch RSI settings, Divergence Options, Labels, and Market Open Settings) allowing you to adjust smoothing periods, RSI and Stochastic lengths, and divergence thresholds with a user-friendly interface.
Visual Enhancements:
Plots & Fills: The indicator plots both the K and D lines with corresponding fills and horizontal bands for quick visual reference.
Divergence Markers: Diamond shapes and labeled markers indicate regular and hidden divergences on the chart.
Market Open Highlighting: Optional histogram plots highlight the market open candle based on different timeframes for stocks versus non-forex symbols.
Intrinsic Event (Multi DC OS)Overview
This indicator implements an event-based approach to analyze price movements in the foreign exchange market, inspired by the intrinsic time framework introduced in Fractals and Intrinsic Time - A Challenge to Econometricians by U. A. Müller et al. (1995). It identifies significant price events using an intrinsic time perspective and supports multi-agent analysis to reflect the heterogeneous nature of financial markets. The script plots these events as lines and labels on the chart, offering a visual tool for traders to understand market dynamics at different scales.
Key Features
Intrinsic Events : The indicator detects directional change (DC) and overshoot (OS) events based on user-defined thresholds (delta), aligning with the paper’s concept of intrinsic time (Section 6). Intrinsic time redefines time based on market activity, expanding during volatile periods and contracting during inactive ones, rather than relying on a physical clock.
Multi-Agent Analysis : Supports up to five agents, each with its own threshold and color settings, reflecting the heterogeneous market hypothesis (Section 5). This allows the indicator to capture the perspectives of market participants with different time horizons, such as short-term FX dealers and long-term central banks.
How It Works
Intrinsic Events Detection : The script identifies two types of events using intrinsic time principles:
Directional Change (DC) : Triggered when the price reverses by the threshold (delta) against the current trend (e.g., a drop by delta in an uptrend signals a "Down DC").
Overshoot (OS) : Occurs when the price continues in the trend direction by the threshold (e.g., a rise by delta in an uptrend signals an "Up OS").
DC events are plotted as solid lines, and OS events as dashed lines, with labels like "Up DC" or "OS Down" for clarity. The label style adjusts based on the trend to ensure visibility.
Multi-Agent Setup : Each agent operates independently with its own threshold, mimicking market participants with varying time horizons (Section 5). Smaller thresholds detect frequent, short-term events, while larger thresholds capture broader, long-term movements.
Settings
Each agent can be configured with:
Enable Agent : Toggle the agent on or off.
Threshold (%) : The percentage threshold (delta) for detecting DC and OS events (default values: 0.1%, 0.2%, 0.5%, 1%, 2% for agents 1–5).
Up Mode Color : Color for lines and labels in up mode (DC events).
Down Mode Color : Color for lines and labels in down mode (OS events).
Usage Notes
This indicator is designed for the foreign exchange market, leveraging its high liquidity, as noted in the paper (Section 1). Adjust the threshold values based on the instrument’s volatility—higher volatility leads to more intrinsic events (Section 4). It can be adapted to other markets where event-based analysis applies.
Reference
The methodology is based on:
Fractals and Intrinsic Time - A Challenge to Econometricians by U. A. Müller, M. M. Dacorogna, R. D. Davé, O. V. Pictet, R. B. Olsen, and J. R. Ward (June 28, 1995). Olsen & Associates Preprint.

Forex Fractal EMA ScalperThis is a forex scalper designed for very short timeframes 1-5 min max.
At the same time due to the short timeframe, is recommend to re optimize it weekly .
Its components are
Fractals
Triple EMA with different lengths
Rules for entry:
For long : we have an up fractal and all 3 ema are in ascending order
For short: we have a down fractal and all 3 ema are in descending order.
Rules for exit
We exit when we either get a reverse order or when we hit the take profit or stop loss calculated in fixed pips.

Normal FractalsNormal size fractal
For those who like Charts as clean as possible, I modified build in fractals in smaller size clean chart pollution
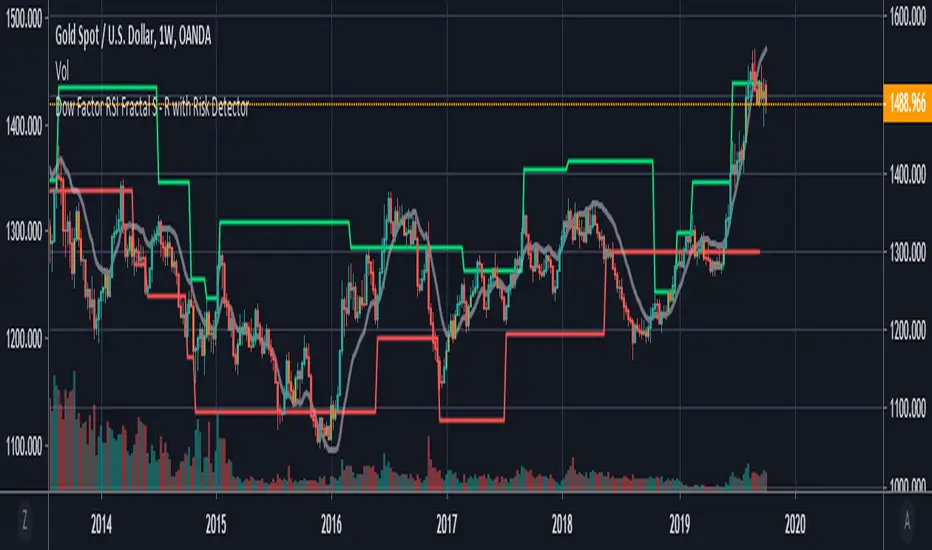
Dow Factor RSI Fractals with Risk Detector
This script is only the fact that the fractals are set according to my Dow Factor RSI .
Bar color and background change where risk factor is high.
You can turn it off or on from the menu.
I'm not licensing because "fractal support and resistances" are not my own codes.
The rest are my own products.
For more information about the Dow Factor RSI:
For more information on the DVOG Risk Detector:
For information about Dependent Variable Odd Generator :
To see the script in a storm theme with Quadruple Exponential Moving Averages:
Best wishes.