Gap & Reversal Signals (Normal vs Heikin-Ashi)🔍 Gap & Reversal Signals (Normal vs Heikin-Ashi) — by
This script is designed to help traders identify key market signals by comparing Normal Candlestick Patterns with Heikin-Ashi values to highlight potential:
✅ Gap Up Opportunities (Strong Bullish Continuation)
🔻 Gap Down Alerts (Strong Bearish Continuation)
🔄 Bullish Reversal Zones (Possible Trend Reversal from Bearish to Bullish)
🔁 Bearish Reversal Zones (Possible Trend Reversal from Bullish to Bearish)
🧠 How it Works:
Gap Up: Normal candle is bullish, Heikin-Ashi is also bullish, and price closes higher than the HA close.
Gap Down: Normal candle is bearish, Heikin-Ashi is also bearish, and price closes lower than the HA close.
Bullish Reversal: Normal candle is bullish, but Heikin-Ashi shows bearish — potential reversal signal.
Bearish Reversal: Normal candle is bearish, but Heikin-Ashi shows bullish — potential reversal signal.
📊 Plot Details:
💚 Gap Up → Green Label Below Bar
❤️ Gap Down → Red Label Above Bar
💙 Bullish Reversal → Blue Label Below Bar
🧡 Bearish Reversal → Orange Label Above Bar
🚀 Use Cases:
Swing and positional traders looking for high-probability reversal setups
Intraday traders spotting early momentum shifts
Backtesters combining HA + candlestick logic for more robust strategies
Search in scripts for "Heikin Ashi"

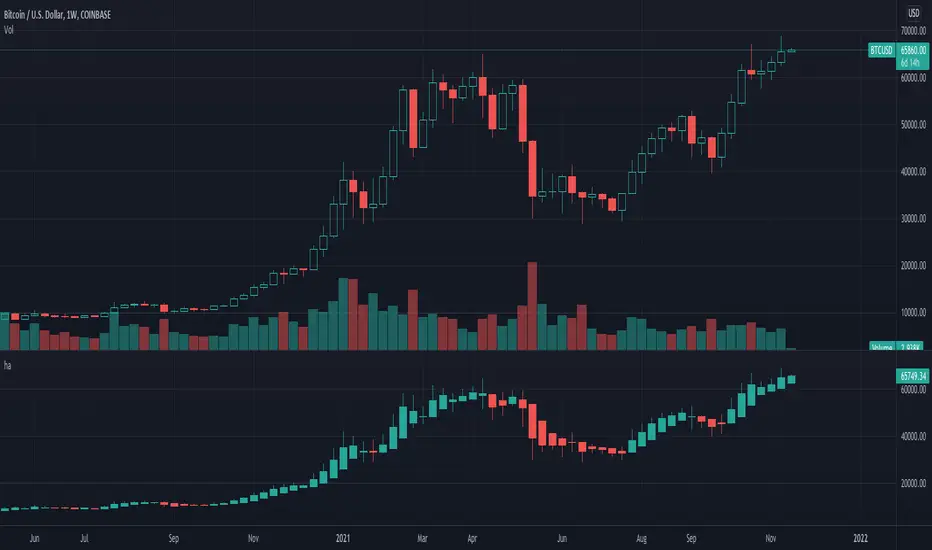
Rolling Heikin Ashi Candles█ OVERVIEW
This indicator displays a Rolling Heikin Ashi Candles for a given timeframe Multiplier. Contrary to Heikin Ashi Candles Charts, if the timeframe Multiplier is "5", this indicator plots Heikin Ashi Candles OHLC of the last 5 Candles.
█ WHAT IS THE NEED FOR IT
Let's see if we want to use a Higher timeframe OHLC Data using security function or resolution options. The indicator repaints until the higher timeframe Heikin Ashi Candles closes, leading to a repainting strategy or indicator using higher-timeframe data. So we can use Rolling Heikin Ashi Candles in these cases.
█ USES
To Pull out higher timeframe Heikin Ashi Candles OHLC Data to build a non-repainting strategy or indicator.
█ WHY I AM BUILDING THIS SIMPLE INDICATOR
There is no doubt higher timeframe analysis is a critical study to mastering the markets.
I found a necessity for an indicator that analyses multiple higher timeframes and gives us a cumulative or average trend direction. I already built the indicator; I will release it soon. The Indicator I am building is wholly based on my understanding and perspective of Market Structure. Please use this indicator idea to remove the repainting issue when you make an indicator that utilises higher timeframe data.
I am using this in my upcoming indicators. Felt to share before head.
Stay Tuned...
If you have any recommendations or alternative ideas, then please drop a comment under the script ;)

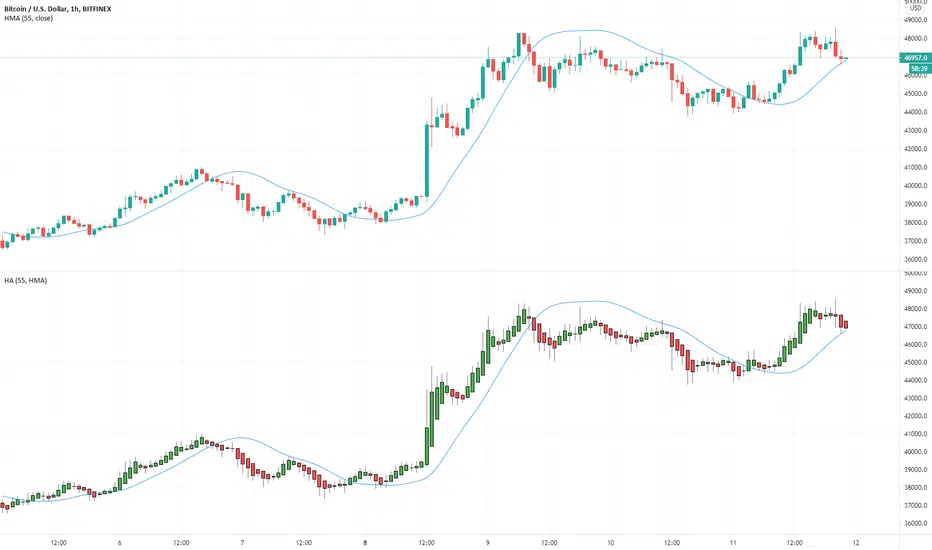
Hi-Lo Channel StrategyHaven't seen a strategy quite like it. Buy when Heikin Ashi candle closes above a moving average that is sourced on highs - Sell when Heikin Ashi candle closes above a moving average that is sourced on lows. Moving average length should be between 5 and 20 ideally.
NOTE: the Heikin Ashi close values are calculated when the box is checkmarked. You do not need to view the chart with Heikin Ashi candles enabled on the chart. The buy and sell points of the strategy do not change whether or not you are viewing Heikin Ashi candles on the chart as long as the Heikin Ashi setting is enabled.

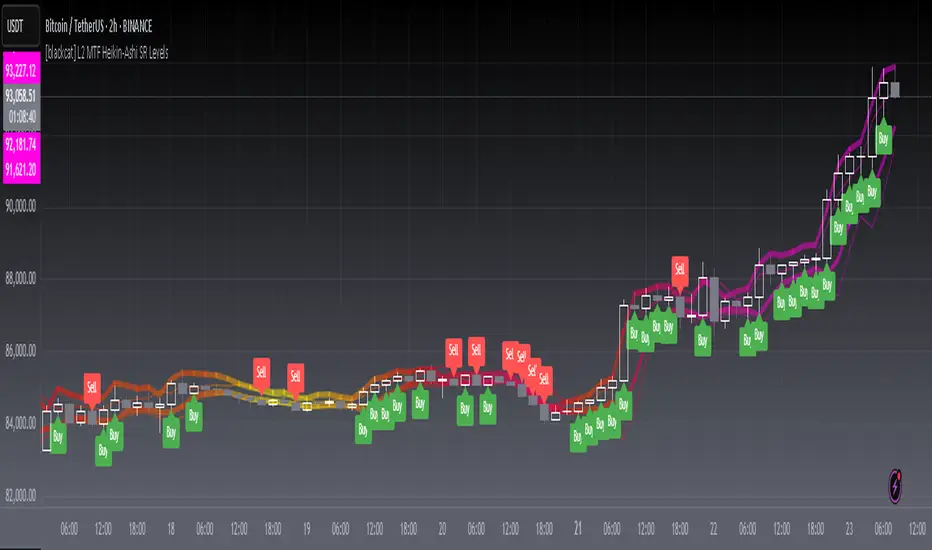
[blackcat] L2 MTF Heikin-Ashi SR LevelsOVERVIEW
The L2 MTF Heikin-Ashi SR Levels indicator is a sophisticated tool designed to help traders identify critical support and resistance levels across multiple timeframes. This script employs Heikin-Ashi candles, which provide a smoothed representation of price action, making it easier to spot trends and reversals. By integrating multi-timeframe analysis, this indicator offers a comprehensive view of market dynamics, enabling traders to make more informed decisions 📊✅.
This indicator not only calculates essential support and resistance levels but also visually represents them on the chart with gradient colors based on Relative Strength Index (RSI) values. Additionally, it features customizable alerts and labels to enhance user experience and ensure timely execution of trades.
FEATURES
Advanced Trend Identification:
Uses Heikin-Ashi candles for smoother price action analysis.
Helps filter out noise and focus on significant trends.
Ideal for both short-term and long-term trading strategies.
Multi-Timeframe Analysis:
Allows users to select different resolutions for deeper insights.
Ensures compatibility with various trading styles and preferences.
Comprehensive Support and Resistance Calculation:
Computes four distinct levels: Support Level 1, Support Level 2, Resistance Level 1, and Resistance Level 2.
Each level serves as a reference point for potential price reversals or continuations.
Gradient Color Visualization:
Employs a spectrum of colors derived from RSI values to represent support and resistance lines.
Enhances readability and helps traders quickly assess market sentiment 🎨.
Dynamic Labels and Alerts:
Automatically generates buy ('Buy') and sell ('Sell') labels when price crosses key levels.
Provides real-time alerts for crossing events, ensuring traders never miss important signals 🔔.
Customizable Parameters:
Offers adjustable Length and Resolution inputs for tailored performance.
Allows traders to fine-tune the indicator according to their unique needs and strategies.
HOW TO USE
Adding the Indicator:
Open your TradingView chart and navigate to the indicators list.
Search for ' L2 MTF Heikin-Ashi SR Levels' and add it to your chart.
Configuring Settings:
Adjust the Length parameter to determine the period over which calculations are made.
A shorter length increases sensitivity, while a longer length smoothens the output.
Choose a specific Resolution to analyze different timeframes simultaneously.
For example, set it to 'D' for daily charts or 'W' for weekly charts.
Interpreting the Chart:
Observe the plotted support and resistance lines on the chart.
Look for price interactions with these levels to identify potential entry and exit points.
Pay attention to the gradient colors, which reflect underlying market momentum.
Setting Up Alerts:
Configure alerts based on the generated signals to receive instant notifications.
Customize alert messages and conditions to suit your trading plan.
Utilizing Labels:
Use the automatically placed buy and sell labels as quick references for decision-making.
Combine these labels with other technical analyses for confirmation.
Backtesting and Optimization:
Thoroughly test the indicator on historical data to evaluate its performance.
Optimize settings and refine your strategy based on backtest results.
Live Trading:
Apply the indicator to live charts and monitor real-time price movements.
Execute trades based on the generated signals and adjust positions accordingly.
Combining with Other Tools:
Integrate this indicator with other technical tools and fundamental analyses for a holistic approach.
Consider using moving averages, oscillators, or volume indicators alongside L2 MTF Heikin-Ashi SR Levels.
LIMITATIONS
Market Volatility:
In highly volatile or ranging markets, the indicator might produce false signals due to erratic price movements 🌪️.
Traders should exercise caution during such periods and consider additional confirmations.
Timeframe Dependency:
The effectiveness of the indicator can vary significantly depending on the chosen timeframe and asset.
Always validate the indicator's performance across different contexts before relying solely on it.
Over-reliance Risk:
While powerful, no single indicator guarantees success in all market conditions.
Combining this tool with other analytical methods enhances reliability and reduces risk.
NOTES
Data Requirements:
Ensure your chart has enough historical data to perform accurate calculations.
Insufficient data may lead to inaccurate or incomplete results.
Demo Testing:
Before deploying the indicator in live trading, conduct extensive testing on demo accounts.
Familiarize yourself with how the indicator behaves under various market scenarios.
Parameter Tuning:
Experiment with different Length and Resolution settings to find what works best for your trading style.
Regularly review and update parameters as market conditions evolve.
Continuous Learning:
Stay updated with the latest developments in technical analysis and trading strategies.
Adapt your use of the indicator based on new insights and experiences.
THANKS
Additionally, gratitude goes to the broader TradingView community for fostering collaboration and knowledge-sharing among traders worldwide. Together, we strive to elevate our understanding and application of financial markets 🌍💡.
Simple Neural Network Transformed RSI [QuantraSystems]Simple Neural Network Transformed RSI
Introduction
The Simple Neural Network Transformed RSI (ɴɴᴛ ʀsɪ) stands out as a formidable tool for traders who specialize in lower timeframe trading.
It is an innovative enhancement of the traditional RSI readings with simple neural network smoothing techniques.
This unique blend results in fairly accurate signals, tailored for swift market movements. The ɴɴᴛ ʀsɪ is particularly resistant to the usual market noise found in lower timeframes, ensuring a clearer view of short-term trends.
Furthermore, its diverse range of visualization options adds versatility, making it a valuable tool for traders seeking to capitalize on short-duration market dynamics.
Legend
In the Image you can see the BTCUSD 1D Chart with the ɴɴᴛ ʀsɪ in Trend Following Mode to display the current trend. This is visualized with the barcoloring.
Its Overbought and Oversold zones start at 50% and end at 100% of the selected Standard Deviation (default σ = 2), which can indicate extremely rare situations which can lead to either a softening momentum in the trend or even a mean reversion situation.
Here you can also see the original Indicator line and the Heikin Ashi transformed Indicator bars - more on that now.
Notes
Quantra Standard Value Contents:
To draw out all the information from the indicator calculation we have added a Heikin-Ashi (HA) Candle Visualization.
This HA transformation smoothens out the indicator values and gives a more informative look into Momentum and Trend of the Indicator itself.
This allows early entries and exits by observing the HA transformed Indicator values.
To diversify, different visualization options are available, either a classic line, HA transformed or Hybrid, which contains both of the previous.
To make Quantra's Indicators as useful and versatile as possible we have created options
to change the barcoloring and thus the derived signal from the indicator based on different modes.
Option to choose different Modes:
Trend Following (Indicator above mid line counts as uptrend, below is downtrend)
Extremities (Everything going beyond the Deviation Bands in a Mean Reversion manner is highlighted)
Candles (Color of HA candles as barcolor)
Reversion (HA ONLY) (Reversion Signals via the triangles if HA candles change state outside of the Deviation Bands)
- Reversion Signals are indicated by the triangles in the Heikin-Ashi or Hybrid visualization when the HA Candles revert
from downwards to upwards or the other way around OUTSIDE of the SD Bands.
Depending on the Indicator they signal OB/OS areas and can either work as high probability entries and exits for Mean Reversion trades or
indicate Momentum slow downs and potential ranges.
Please use another indicator to confirm this.
Case Study
To effectively utilize the NNT-RSI, traders should know their style and familiarize themselves with the available options.
As stated above, you have multiple modes available that you can combine as you need and see fit.
In the given example mostly only the mode was used in an isolated fashion.
Trend Following:
Purely relied on State Change - Midline crossover
Could be combined with Momentum or Reversion analysis for better entries/exits.
Extremities:
Ideal entry/exit is in the accordingly colored OS/OB Area, the Reversion signaled the latest possible entry/exit.
HA Candles:
Specifically applicable for strong trends. Powerful and fast tool.
Can whip if used as sole condition.
Reversions:
Shows the single entry and exit bars which have a positive expected value outcome.
Can also be used as confirmation or as last signal.
Please note that we always advise to find more confluence by additional indicators.
Traders are encouraged to test and determine the most suitable settings for their specific trading strategies and timeframes.
In the showcased trades the default settings were used.
Methodology
The Simple Neural Network Transformed RSI uses a simple neural network logic to process RSI values, smoothing them for more accurate trend analysis.
This is achieved through a linear combination of RSI values over a specified input length, weighted evenly to produce a neural network output.
// Simple neural network logic (linear combination with weighted aggregation)
var float inputs = array.new_float(nnLength, na)
for i = 0 to nnLength - 1
array.set(inputs, i, rsi1 )
nnOutput = 0.0
for i = 0 to nnLength - 1
nnOutput := nnOutput + array.get(inputs, i) * (1 / nnLength)
nnOutput
This output is then compared against a standard or dynamic mean line to generate trend following signals.
Mean = ta.sma(nnOutput, sdLook)
cross = useMean? 50 : Mean
The indicator also incorporates Heikin Ashi candlestick calculations to provide additional insights into market dynamics, such as trend strength and potential reversals.
// Calculate Heikin Ashi representation
ha = ha(
na(nnOutput ) ? nnOutput : nnOutput ,
math.max(nnOutput, nnOutput ),
math.min(nnOutput, nnOutput ),
nnOutput)
Standard deviation bands are used to create dynamic overbought and oversold zones, further enhancing the tool's analytical capabilities.
// Calculate Dynamic OB/OS Zones
stdv_bands(_src, _length, _mult) =>
float basis = ta.sma(_src, _length)
float dev = _mult * ta.stdev(_src, _length)
= stdv_bands(nnOutput, sdLook,sdMult/2)
= stdv_bands(nnOutput, sdLook, sdMult)
The Standard Deviation bands take defined parameters from the user, in this case sigma of ideally between 2 to 3,
to help the indicator detect extremely improbable conditions and thus take an inversely probable signal from it to forward to the user.
The parameter settings and also the visualizations allow for ample customizations by the trader.
For questions or recommendations, please feel free to seek contact in the comments.

RSI Primed [ChartPrime]
RSI Primed combines candlesticks, patterns, and the classic RSI indicator for advanced market trend indications
Introduction
Technical traders are always looking for innovative methods to pinpoint potential entry and exit points in the market. The RSI Prime indicator provides such traders with an enhanced view of market conditions by combining various charting styles and the Relative Strength Index (RSI). It offers users a unique perspective on the market trends and price momentum, enabling them to make better-informed decisions and stay ahead of the market curve.
The RSI Primed is a versatile indicator that combines different charting styles with the Relative Strength Index (RSI) to help traders analyze market trends and price momentum. It offers multiple visualization modes that serve specific purposes and provide unique insights into market performance:
Regular Candlesticks
Candlesticks with Patterns
Heikin Ashi Candles
Line Style
Regular Candlestick Mode
The Regular Candlestick Mode in RSI Primed depicts traditional Japanese candlesticks that most traders are familiar with. This mode bypasses any smoothing or modified calculations, representing real-price movements. Regular candlesticks offer a clear and straightforward way to visualize market trends and price action.
Candlestick with Patterns Mode
The Candlestick with Patterns Mode focuses on identifying high-probability candlestick patterns while incorporating RSI values. By leveraging the information captured by the RSI, this mode allows traders to spot significant market reversals or continuation patterns that could signal potential trading opportunities. Some recognizable patterns include engulfing bullish, engulfing bearish, morning star bullish, and evening star bearish patterns.
Heikin Ashi Candles Mode
The Heikin Ashi Candles Mode presents an advanced candlestick charting technique known for its excellent trend-following capabilities. Heikin Ashi Candles filter out noise in the market and provide a clear representation of market trends. In this mode, candlesticks are plotted based on RSI values of the open, high, low, and close prices, helping traders understand and utilize market trends effectively.
Line Style Mode
The Line Style Mode offers a simpler and minimalistic representation of the RSI values by using a line instead of candlesticks to visualize market trends. This mode helps traders focus on the overall trend direction and eliminates potential distractions caused by the complexity of candlestick patterns.
Candle Color Overlay Mode
The Candle Color Overlay Mode is a unique feature in the RSI Primed indicator that allows traders to visualize the RSI values on the chart's candles as a heat gradient. This mode adds a color overlay to the candlesticks, representing the RSI values in relation to the candlesticks' price action.
By displaying the RSI as a color gradient, traders can quickly assess market momentum and identify overbought or oversold conditions without having to switch between different modes or charts. The gradient ranges from cool colors (blue and green) for lower RSI values, indicating oversold conditions, to warm colors (orange and red) for higher RSI values, signifying overbought situations.
To enable the Candle Color Overlay Mode, traders can toggle the "Color Candles" option in the indicator settings. Once enabled, the color gradient will be applied to the candlesticks on the chart, providing a visually striking and informative representation of the RSI values in relation to price action. This mode can be used in tandem with any of the other charting styles, allowing traders to gain even more insights into market trends and momentum.
RSI Primed Implementation
The RSI Primed indicator combines the benefits of various charting styles with the RSI to help traders gain a comprehensive view of market trends and price momentum. It incorporates the Heikin Ashi and RSI values as inputs to generate several visualization modes, enabling traders to select the one that best suits their needs.
Chebyshev Digital Audio Filter in RSI Primed Indicator
A unique feature of the RSI Primed Indicator is the incorporation of the Chebyshev Digital Audio Filter, a powerful tool that significantly influences the indicator's accuracy and responsiveness. This signal processing method brings several benefits to the context of the RSI indicator, improving its performance and capabilities.
1. Improved Signal Filtering
The Chebyshev filter excels in its ability to remove high-frequency noise and unwanted signals from the RSI data. While other filtering techniques might introduce unwanted side effects or distort the RSI data, the Chebyshev filter accurately retains the main signal components, enhancing the RSI Primed's overall accuracy and reliability.
2. Faster Response Time
The Chebyshev filter offers a faster response time than most other filtering techniques. In the context of the RSI Primed Indicator, this means that the filtering process is quicker and more efficient, allowing traders to act swiftly during rapidly changing market conditions.
3. Enhanced Trend Detection
By effectively removing noise from the RSI data, the Chebyshev filter contributes to the enhanced detection of underlying market trends. This feature helps traders identify potential entry and exit points more accurately, improving their overall trading strategy and performance.
How to Use RSI Primed
Traders can choose from different visualization modes to suit their preferences while using the RSI Primed indicator. By closely monitoring the chosen visualization mode and the position of the moving average, traders can make informed decisions about market trends.
Green candlesticks or an upward line slope indicate a bullish trend, and red candlesticks or a downward line slope suggest a bearish trend. If the candles or line are above the moving average, it could signify an uptrend, whereas a position below the moving average may indicate a downtrend.
The RSI Primed indicator offers a unique and comprehensive perspective on market trends and price momentum by combining various charting styles with the RSI. Traders can choose from different visualization modes and make well-informed decisions to capitalize on market opportunities. This innovative indicator provides a clear and concise view of the market, enabling traders to make swift decisions and enhance their trading results.

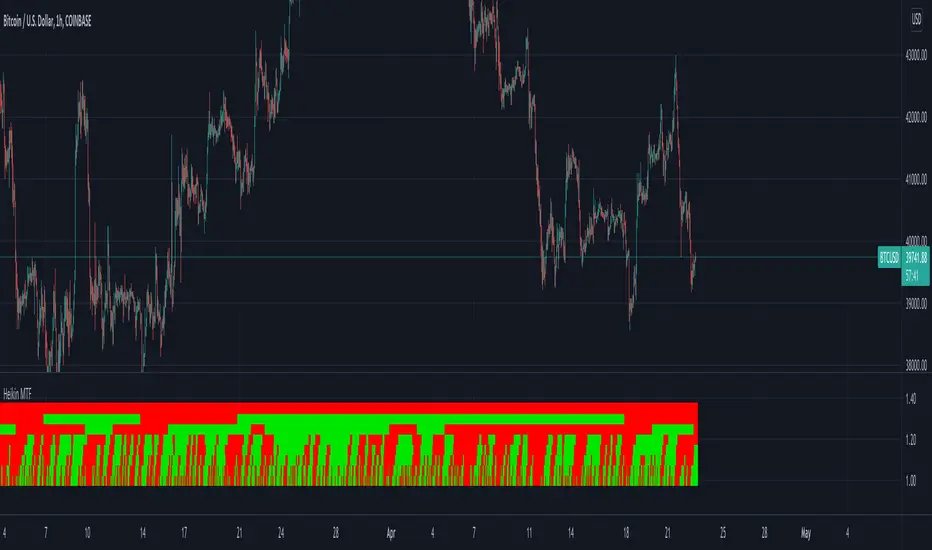
MTF Heikinashi BarOVERVIEW
This indicator shows whether Heikin Ashi is up or down, represented by a bar. This indicator is compatible with MTF.
CONCEPTS
What do you want to know about market analysis?
Do you want a hard analysis? You can look for it.
All I want to know is whether the commonly known technical analysis is 'UP' or 'DOWN'.
All I want to know is whether the current market price is going up or down. Not only for the current, but also for the monthly, weekly, and daily status.
I want to make a decision in a moment. Without even thinking about it.
That is why I created a color-coded bar indicator to show the status.
No need to frown anymore.
DETAILS
Heikin means average. Ashi means legs. In this case, it means a candle.
Close = (Close + Open + High + Low) / 4
For more information, click here.
tradingview.com
Heikin Ashi Up ⇒ green
Heikin Ashi Down ⇒ red

Function To Candles - Another way to see indicatorsIntroduction
There are different and better way's to see price data, a candlestick chart is one of the best way to see the price since you have access to the open/high/low/close information, this is really efficient and can allow for naked non parametric trading strategies (candlesticks patterns) . But what about making candles out of indicators ? There are tons of studies about candlesticks patterns in price data but none (?) about candlestick patterns using indicator data, therefore i made this script in order to show candles from various indicators, i also made an heikin-ashi mode.
Rsi To Candles
All the indicators are use the open/high/low/close price as input in order to return candles. length control the indicator period.
Stochastic To Candles
The stochastic oscillator is restrained in a range of 0/100, therefore when equal to 0 or 100 the candles can be flat.
Rate Of Change To Candles
The rate of change don't distort price as heavily as other indicators since its based on differencing.
Center Of Gravity To Candles
The center of gravity (cog) is defined from tradingview as "an indicator based on statistics and the Fibonacci golden ratio", its not an indicator i'am familiar with and i don't know if its the same proposed by Elhers. The candles are smooth, high length can flatten the candles heavily making them hard to see.
Correlation Oscillator
In a range of -1/1 this indicator is quite smooth and can also flatten candles.
Patterns And Heikin-Ashi
There are tons of patterns that can be generated from candlesticks, they can be applied to this indicator as well.
The indicator can show an heikin-ashi mode, heikin-ashi candlestick use averaging to plot candles, this is why they appear smoother, some signals generated from heikin-ashi candles are :
Bullish body with no lower shadows = Strong Uptrend
Bearish body with no higher shadows = Strong Downtrend
High range and small body = Indecision/Risk of reversal
Conclusion
I made an indicator able to draw candles from other indicators, those candles contain various information that can generate decision from patterns. I hope you find a use to it, if its the case share your findings with me, maybe that you will even be able find a new candlestick pattern :)
Thanks for reading !

Multiple Moving Averages for Heikin Ashi I want to give credits to @QuantNomad, i got the heikin ashi part of the script from this open script /0iKy7lyG-QuantNomad-Heikin-Ashi-PSAR-Strategy/;
and to the other guy that provided a 17 type of moving average script open source but i forgot his name, if someone remember please tell me.
My idea was to see how the different types of moving averages behaves in a Heinkin Ashi chart, you can change to more than 15 types of Moving Average and use it the way you want it.
For the source of the moving averages i used a simple moving average of 1 period using the high of the heikin ashi candle, low of it and divided by 2 as the source of the different types of moving averages.
Different types of Moving Averages
Moving Average Types
SMA ---> Simple
WMA ---> Weighted
VWMA ---> Volume Weighted
EMA ---> Exponential
DEMA ---> Double EMA
ALMA ---> Arnaud Legoux
HMA ---> Hull MA
SMMA ---> Smoothed
LSMA ---> Least Squares
KAMA ---> Kaufman Adaptive
TEMA ---> Triple EMA
ZLEMA ---> Zero Lag
FRAMA ---> Fractal Adaptive
VIDYA ---> Variable Index Dynamic Average
JMA ---> Jurik Moving Average
T3 ---> Tillson
TRIMA ---> Triangular
The type of moving average you select will appear in a separated chart with Heikin Ashi candles, like in the image above.
BERLIN CandlesA problem with Heikin Ashi is that while it gives you a great overview of overall direction, it is rarely possible to use it as a replacement for normal japanese
candlesticks. The reason for this is that actual price data is lost, since the candles are more akin to a moving average than a different way to see price action. Also, with Heikin Ashi, most of the actual price action is lost, because the candles can be bigger than the high and low of the underlying japanese candlestick.
With BERLIN Candles I have tried to fix that problem. By using a smoothed out version of the previous Heikin Ashi candle close as the current BERLIN Candle open, the high and low of the actual japanese candlestick for the high and low of the BERLIN Candle, and the current Heikin Ashi close as the BERLIN Candle close, while setting hard limits for BERLIN Candle open and close values so that they can never exceed the high and low of the underlying japanese candlestick.
One problem still persists though. The actual current price data is lost. However, the BERLIN Candles have solved this by adding a fifth part to the candles. The close of the underlying japanese candlesticks are indicated with a plus-sign. This way, actual price data is never lost, while keeping all of the other benefits of this type of candles.
A few added bonuses:
The addition of the 14 period ATR at the latest candle
The baseline from Ichimoku is included as an option
The 14 period ATR value of each candle can be seen in the indicator data as
the orange value

AZ Dynamic Trend Indicator with Heikin-Ashi### Dynamic Trend Indicator with Heikin-Ashi (v2.7)
**Effortlessly identify trends and reversals** with this versatile tool combining multi-timeframe analysis, adaptive moving averages, and Heikin-Ashi smoothing. Here's what it offers:
#### 🔍 **Core Features**
1. **Dual Timeframe Analysis**:
- Track trends on higher timeframes (e.g., 1H/D) while viewing signals on your current chart.
- Toggle between **Heikin-Ashi** or standard candles for cleaner trend visualization.
2. **8 Customizable MAs**:
- Choose from **ALMA, HMA, SMA, SWMA, VWMA, WMA, ZLEMA, or EMA** with adjustable periods.
- Unique "Trend Strength" metric: `(MA_Close - MA_Open) / (MA_High - MA_Low)` highlights momentum direction.
3. **Smart Signals**:
- **Entry/Exit**: Triangles mark crossovers between MA Close/Open.
- **Reversal Alerts**: Detects counter-trend moves within a user-defined window (default: 3 bars) after signals.
- Color-coded plots: Bullish (🟢), Bearish (🔴), Reversal Bull (🔵), Reversal Bear (🟠).
#### 🎨 **Visual Customization**
- Toggle **High/Low MA lines**, **Close line**, and **fill colors**.
- Adjust colors for all elements to match your chart theme.
- Hide signals or reversal markers as needed.
#### ⚙️ **Practical Use**
- **Trend Following**: Use the MA Close/Open crossover with trend fill colors to confirm direction.
- **Reversal Trading**: Capitalize on pullbacks with reversal signals (e.g., after a bearish signal, watch for Bull Reversal markers).
- **Multi-Timeframe Confirmation**: Avoid false signals by aligning higher-timeframe trends with your entries.
*Ideal for swing traders and trend riders!*
**Note**: Adjust `MA Period`, `Reversal Window`, and `Trend Timeframe` for your strategy. Disable Heikin-Ashi in choppy markets for faster reactions.
---
*Code v2.7 updates: Optimized reversal logic, added ALMA/ZLEMA support, and enhanced visual controls.*

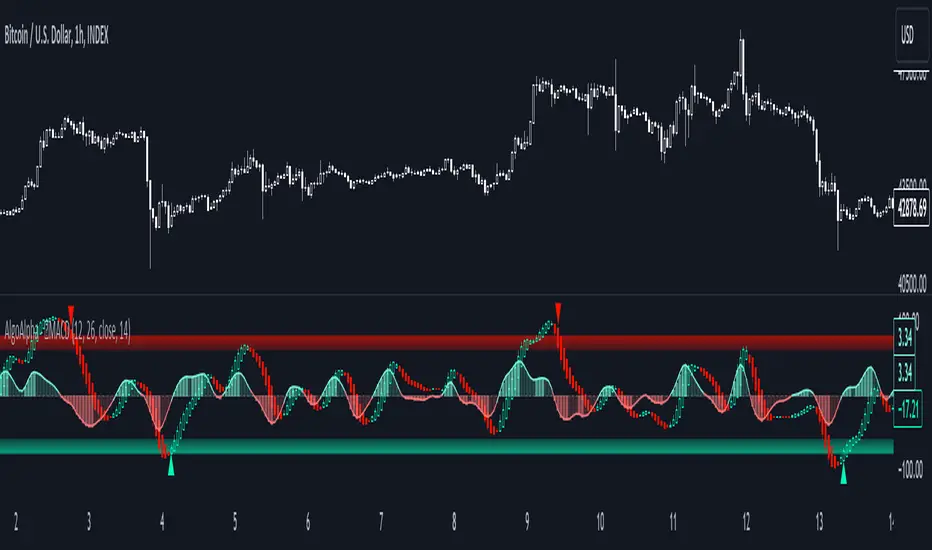
Normalised Gaussian MACD Heikin Ashi [AlgoAlpha]🌟🚀Introducing the Normalised Gaussian MACD Heikin Ashi by AlgoAlpha !
Elevate your trading game with this multipurpose indicator, crafted to pinpoint trend continuation opportunities while highlighting volatility and oversold/overbought conditions. Whether you're embarking on your trading journey or you're a seasoned market navigator, this tool is equipped with intuitive visual cues to amplify your decision-making prowess and enrich your market analysis toolkit. Let's dive into the key features, utilization strategies, and the innovative logic underpinning this indispensable trading asset.
Key Features:
🔧 Enhanced Customization : Tailor your experience with adjustable parameters including Fast Length, Slow Length, Source, Macd Smoothing Length, Signal Smoothing, and more.
🖌️ Visual Enhancements : Opt for Heikin Ashi Candles display and choose to show or hide MACD and Signal lines for a clutter-free chart.
🌈 Color Customization : Personalize your chart with selectable primary and secondary up and down colors to suit your visual preferences.
🔔 Advanced Alert System : Stay ahead with comprehensive alert conditions for market movements, including trend reversals, bullish and bearish swings.
How to Use:
Configure the Inputs : Start by customizing the indicator’s settings to match your trading style. Adjust the length parameters, source selection, and smoothing lengths to fine-tune the indicator’s sensitivity.
Interpret the Candles and Colors : Keep an eye on the Heikin Ashi Candles (if enabled) and the color shifts within the MACD Line Candles and Histogram. These visual cues are pivotal for identifying market trends.
Analyze with Flexibility : Make use of the option to display or hide the MACD and Signal lines based on your analysis requirements. This can help in focusing on the essential information without overcrowding your chart.
Utilize Alerts for Timely Decisions : Leverage the extensive alert system to get notified about potential market movements. These alerts can help you capture the right moment to enter or exit trades.
Basic Logic:
The Normalised Gaussian MACD Heikin Ashi by AlgoAlpha integrates Gaussian filters to elevate the traditional MACD indicator's efficiency, providing a more detailed analysis of market trends and momentum. This sophisticated approach reduces noise and enhances signal speed, which is crucial for identifying momentum trading opportunities.
Gaussian Filter Implementation : The core innovation lies in applying a Gaussian filter to the input price series. This mathematical technique smooths the price data, significantly reducing market noise and making trend signals clearer and more reliable. The Gaussian filter calculates a smoothed value for each data point by weighting nearby data points, with the weights decreasing as the distance from the current data point increases.
Refined MACD Calculation : The Gaussian MACD is derived from the difference between two Gaussian smoothed moving averages (fast and slow), which are then normalized to account for market volatility. This normalization process involves dividing the difference by a measure of market range (such as the high minus the low), and multiplying by a factor (usually 100) to scale the indicator appropriately.
🔑 This script is a versatile tool designed to aid in the identification of momentum and reversals, helping traders to make informed decisions based on technical analysis. Its customization options allow for a tailored analysis experience, fitting the unique needs and strategies of each trader.
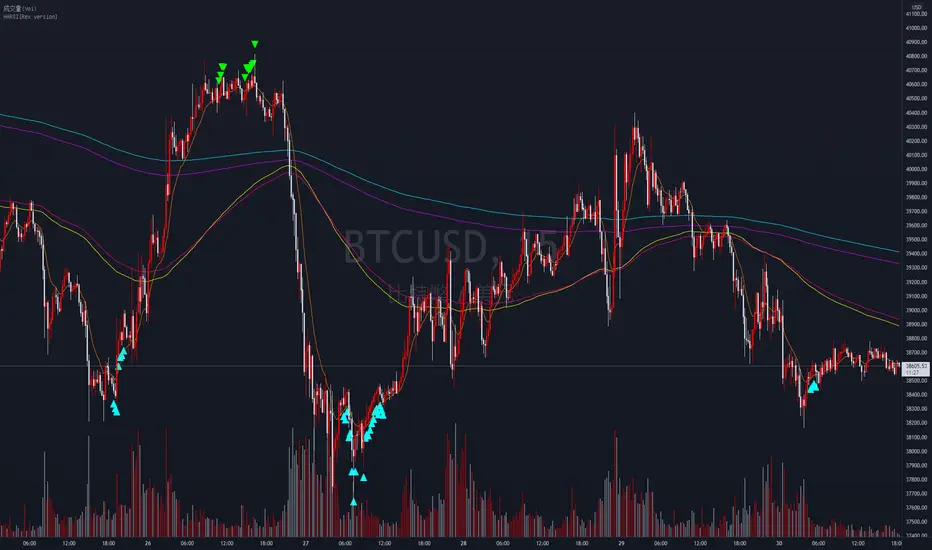
HARSI[Rex version]This indicator based on Heikin Ashi RSI Oscillator
The indicator like a plugin of Heikin Ashi RSI Oscillator
At the line NO.1 the (the red candle turn into green) ,but price sitll bumpy .
At the line NO.2 after the mark and long signal appears and price goes up
And the Vegas tunnel could be TPotSL
一號線的位置出現了Heikin Ashi RSI Oscillator 多方進場訊號但是價格還是持續震盪
二號線位置出現了上升箭頭後價格才開始慢慢向上走
Heikin Multi Time Frame// How it Works \\
This script calculates the open and close prices of Heikin Ashi candles across multiple timeframes,
If the candle formed on that timeframe is green it will display in the table a green square, If the candle is red, the square will display red.
// Settings \\
You can change the colours of the plots
You can also Change any of the timeframes which the Heikin Ashi candles are being calculated on
// Use Case \\
Heikin Ashi candles are often used to give a smoother trend direction and help cancel out some of the noice/consolidation.
It can also be use as trend detection for multiple timeframes at once
/ / Suggestions \\
Happy for anyone to make any suggestions on changes which could improve the script,
// Terms \\
Feel free to use the script, If you do use the scrip please just tag me as I am interested to see how people are using it. Good Luck!
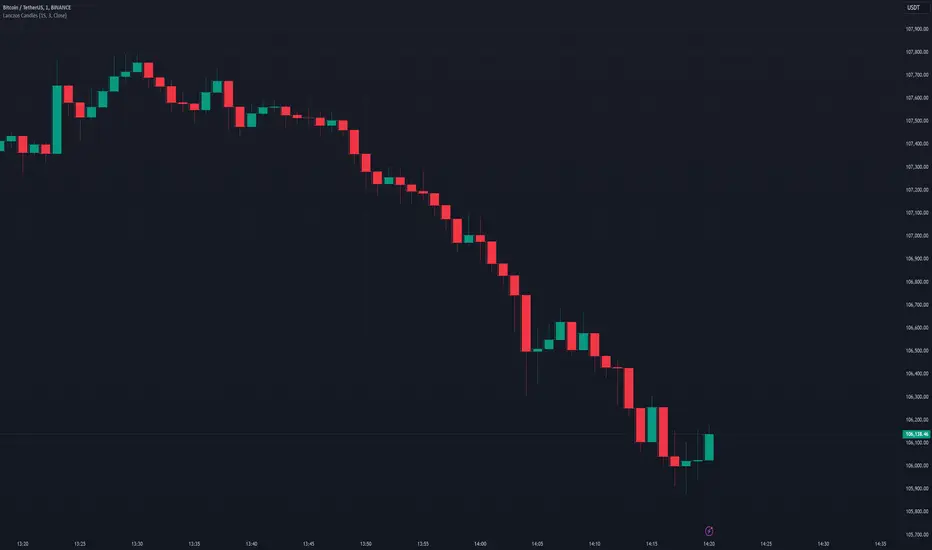
Lanczos CandlesThis indicator reconstructs price action using Lanczos resampling, incorporating lower timeframe data to create a more detailed representation of market movements. Traditional candle aggregation on higher timeframes tends to lose some price action detail - this indicator attempts to preserve more of that information through mathematical resampling.
The indicator samples price data from a lower timeframe and uses the Lanczos algorithm, a mathematical method commonly used in signal processing and image resampling, to reconstruct the price series at the chart's timeframe. The process helps maintain price movements that might otherwise be smoothed out in regular candle aggregation.
The main settings allow you to select the source timeframe for sampling, adjust the Lanczos filter width to balance smoothness versus detail preservation, and optionally enable Heikin Ashi calculation. The filter width parameter (default: 3) affects how aggressive the smoothing is - higher values produce smoother results while lower values retain more of the original variation.
This approach can be useful for technical analysis when you want to work with higher timeframes while maintaining awareness of significant price movements that occurred within those candles. The optional Heikin Ashi mode can help visualize trends in the resampled data.
The indicator works best when there's a clear ratio between your chart timeframe and the source timeframe (for example, using 1-minute data to build 5-minute candles).
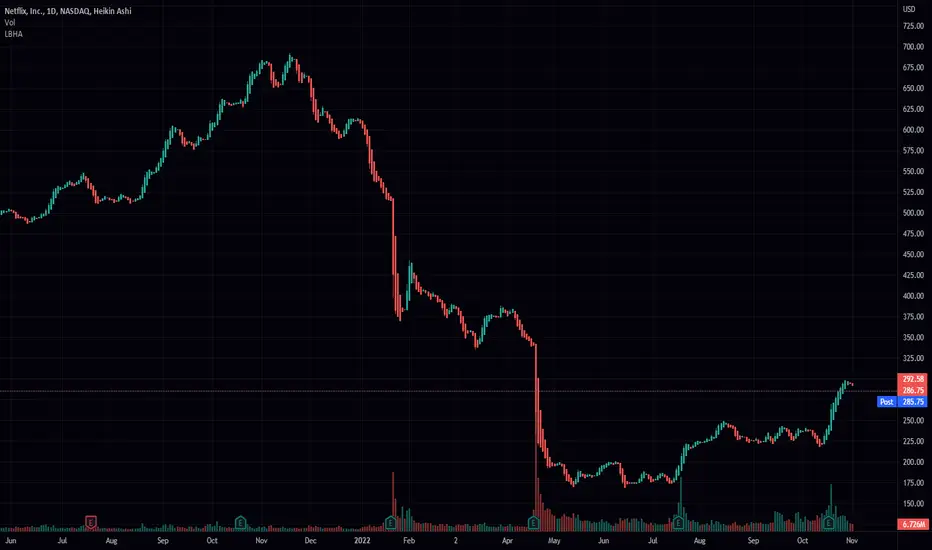
Heiken-Ashi CandlesSimple script to view Heiken-Ashi candles below a normal candles chart.
Could also be useful for using HA calcs in strategy scripts on normal candles chart for proper backtesting.
I adapted this to v4 from original v2 script by @samtsui. If you like please remember to give him a Thumbs Up for his original version! ->
IO_Heikin-Ashi OverlayThis is Traditional Heikin-Ashi bars overlayed with regular candlestick/any chart type
Although HA is available in TradingView by default, this script is to recalculate HA by traditional calculations.
This version REPAINTS!! This is because Traditional HA uses Close Price (which is calculated on the fly).
-- Invsto

"The Stocashi" - Stochastic RSI + Heikin-AshiWhat up guys and welcome to the coffee shop. I have a special little tool for you today to throw in your toolbox. This one is a freebie.
This is the Stochastic RS-Heiken-Ashi "The Stocashi"
This is the stochastic RSI built to look like Heikin-Ashi candles.
a lot of people have trouble using the stochastic indicator because of its ability to look very choppy at its edges instead of having nice curves or arcs to its form when you use it on scalping time frames it ends up being very pointed and you can't really tell when the bands turn over if you're using a stochastic Ribbon or you can't tell when it's actually moving in a particular direction if you're just using the K and the D line.
This new format of Presentation seeks to get you to have a better visual representation of what the stochastic is actually doing.
It's long been noted that Heikin-Ashi do a very good job of representing momentum in a price so using it on something that is erratic as the stochastic indicator seems like a plausible idea.
The strategy is simple because you use it exactly the same way you've always used the stochastic indicator except now you can look for the full color of the candle.
this one uses a gradient color setup for the candle so when the candle is fully red then you have a confirmed downtrend and when the candle is fully green you have a confirmed up trend of the stochastic however if, you a combination of the two colors inside of one candle then you do not have a confirmed direction of the stochastic.
the strategy is simple for the stochastic and that you need to know your overall trend. if you are in an uptrend you are waiting for the stochastic to reach bottom and start curving up.
if you are in a downtrend you are waiting for the stochastic to reach its top or its peak and curve down.
In an uptrend you want to make sure that the stochastic is making consistently higher lows just like price should be. if at any moment it makes a lower low then you know you have a problem with your Trend and you should consider exiting.
The opposite is true for a downtrend. In a downtrend you want to make sure you have lower highs. if at any given moment you end up with a higher high than you know you have a problem with your Trend and it's probably ending so you should consider exiting.
The stochastic indicator done as he can actually candles also does a very good job of telling you when there is a change of character. In that moment when the change of character shows up you simply wait until your trend and your price start to match up.
You can also use the stochastic indicator in this format to find divergences the same way you would on the relative strength index against your price highs and price lows so Divergence trading is visually a little bit easier with this tool.
The settings for the K percent D percent RSI length and stochastic length can be adjusted at will so be sure to study the history of the stochastic and find the good settings for your trading strategy.

Line Break Heikin AshiThis script takes two candle styles and combines then into one. By only using the closing price to inform the heikin ashi candles you get a lovely line break style heiken ashi candle. The advantage to this if you are into this kind of thing is that it makes for a smoother experience. You still get wicks just because of the nature of heikin ashi but they are dramatically reduced. This is defiantly an experimental indicator as its just a different way to look at the chart. I hope some one can find use in this outside of a work around pine script limitations. I had to create this for my sentiment tracker section of my qqe bb screener because it uses so many symbols that I cant get the open, high, or low for each. If you find any bugs please report them, or if you have any feedback please leave it. Enjoy!
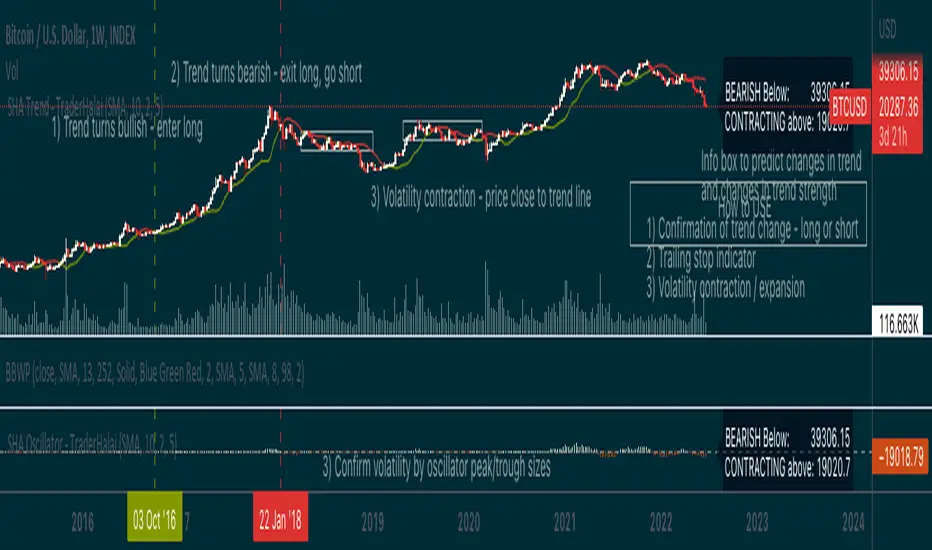
Smoothed Heikin Ashi Trend on Chart - TraderHalaiThis indicator is a predictive tool using Heikinashi to calculate shifts in trade direction.
It works by reverse-engineering the regular candle stick closing price required, to flip the Heiken Ashi candle from Red to Green and vice-versa.
Below, is an earlier indicator that I released and created. This plots this price as an oscillator, which allows traders to get a predictive indicator of a trend change.
This indicator extends upon this functionality by adding a smoothing function to the reverse-engineered regular candle stick closing price, to reduce the choppiness of signals. It also plots the indicator on the chart to allow for easier visual confirmation.
How to use
1) As a directional bias - Bullish or bearish
2) Volatility expansion/contraction - further distance from line means volatility expansion - am planning to release an oscillator version also
3) Trailing stop loss - once you are in a trade
Other Features
Select a moving average period and smoothing calculation method (e.g. SMA / EMA)
Non-repaint mode for backtesting and use/integration with higher timeframes
Final note - Open Source
I am releasing this as open-source for the benefit of the community and to allow further development, scrutiny and criticism. Please feel free to use this indicator as you see fit. If you do use this indicator to create another script, feel free to drop me a note, as I would be highly interested in your idea.
Thanks, and Enjoy!
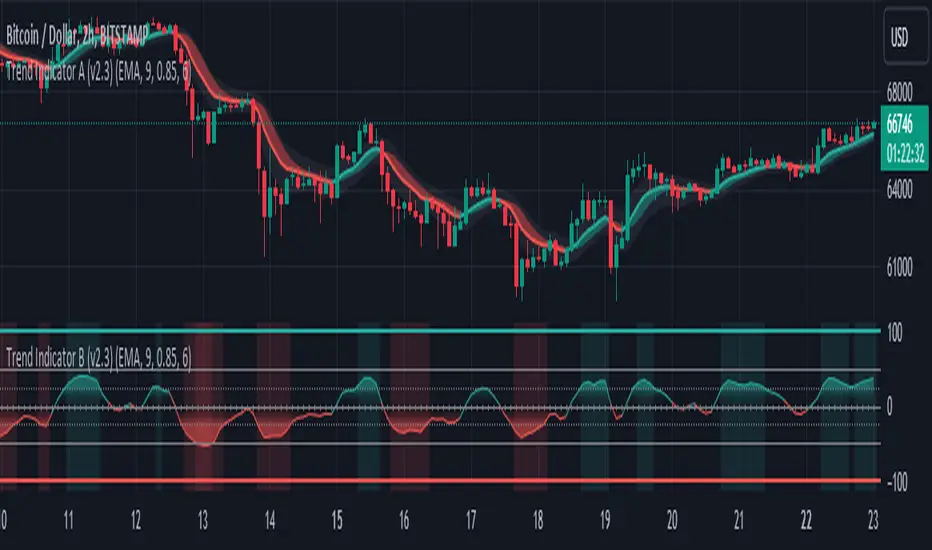
Trend Indicator B-V2 (Momentum measuring)"Trend Indicator A-V2" and "Trend Indicator B-V2" are updated and improved versions of my initial trend indicators. Totally rethinking the code, adding highs and lows in the calculations, including some more customisation through colour schemes.
In practice, this indicator uses EMAs and Heikin Ashi to provide an overall idea of the trend.
The "Trend Indicator A-V2" is an overlay showing “Smoothed Heikin Ashi” .
The "Trend Indicator B-V2" uses the same values in a different way to measure the momentum of the trend and identify potential trend rejections.
Please, take into account that it is a lagging indicator.
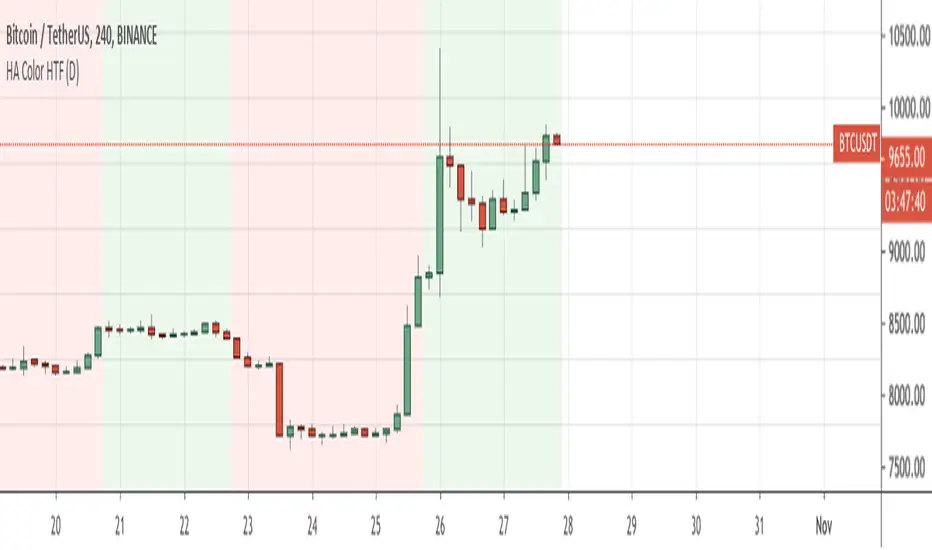
QuantNomad - Heikin Ashi Colors Higher TimeframeSimple script displaying color of Heiken Ashi candles from higher timeframes as a background.
SHAMAZZ = Smoothed Heikin Ashi + MA + ZigZagSHAMAZZ: Smoothed Heikin Ashi + Moving Averages + ZigZag Structure
This script is a visual analysis tool that combines three components in one place:
Smoothed Heikin Ashi candles
• Candles are generated using a two-stage exponential smoothing process applied to open, high, low, and close
• Helps visualize general price direction and candle transitions
• Supports optional multi-timeframe views using TradingView’s request.security()
Moving Averages
• Includes two standard moving averages (SMA 50 and SMA 200 by default)
• These are plotted on the same timeframe as the main chart or a selected higher timeframe
• No trading signals or strategies are generated from the averages
ZigZag Pivot Mapping
• Identifies swing highs and lows based on user-selected pivot length
• Classifies pivots into simple categories such as higher high, lower high, higher low, or lower low
• Draws connecting lines between detected pivots
• Can optionally display small labels showing the pivot type
• The ZigZag is not predictive and only reflects swings already formed by the chosen pivot settings
Purpose
The script is meant as a charting helper for traders who want to visualize smoothed candles, major moving averages, and swing structure without switching indicators. It does not generate signals, alerts, or trading advice. It does not imply future outcomes, accuracy, or profitability.
Note on Higher Timeframes
When higher-timeframe values are requested, the script only displays confirmed higher-timeframe candle closes. No lookahead behavior is intended. Users who want the safest and strictest mode should keep all additional timeframe options disabled and use the indicator on one timeframe only.
How to Use
• Turn components on or off depending on your workflow
• Adjust pivot length to make the ZigZag more or less sensitive
• Use smoothed candles and moving averages as visual references
• Use ZigZag swings only for structure mapping, not for trade signals or forecasts
This tool is provided for visual analysis only and does not promise performance or predictive value.
