Levels & Flow📌 Overview
Levels & Flow is a visual trading tool that combines daily pivot levels with a dynamic EMA ribbon to help traders identify structure, momentum, and key decision zones in the market.
This script is designed for discretionary traders who rely on clean visual cues for intraday and swing trading strategies.
⚙️ Key Features
Daily Pivot, Support, and Resistance Lines
Automatically plots the daily pivot level based on the previous day’s OHLC data, along with calculated support and resistance levels.
Fibonacci Retracement Levels
Two dashed lines above and below the pivot represent the retracement of the pivot-resistance and pivot-support range, forming the boundaries of the “no-trade zone.”
No-Trade Zone (Shaded Box)
A gray shaded box between the two Fibonacci levels to visually mark a high-chop/low-conviction zone.
Trend-Based Candle Coloring (Current Day Only)
Candles are colored green if the close is above the pivot, red if below (only on the current trading day).
Bullish/Bearish Trend Label
A small table in the bottom-right corner displays “Bullish” or “Bearish” depending on whether price is above or below the pivot.
20-EMA Gradient Ribbon
A stack of 20 EMAs, each smoothed and color-coded from blue to green to reflect short- to long-term trend alignment.
Cumulative EMA with Adaptive Weighting
An intelligent moving average line that adjusts weight distribution among the 20 EMAs based on recent predictive accuracy using a learning rate and lookback period.
🧠 How It Works
📍 Levels
The script calculates daily pivot, resistance, and support levels using standard formulas:
Pivot = (High + Low + Close) / 3
Resistance = (2 × Pivot) – Low
Support = (2 × Pivot) – High
These levels update each day and extend 143 bars to the right.
📏 Fib Lines
Fib Up = Pivot + (Resistance – Pivot) × 0.382
Fib Down = Pivot – (Pivot – Support) × 0.382
These lines form the “no-trade zone” box.
📈 EMA Ribbon
20 EMAs starting from the user-defined Base Length, each incremented by 1
Each EMA is smoothed using the Smoothing Period
Color-coded from blue to green for intuitive visual flow
Filled between EMAs to visualize trend strength and alignment
🧠 Cumulative EMA Learning
Each EMA’s historical error is calculated over a Lookback Period
Lower-error EMAs receive higher weight; weights are normalized to sum to 1
The result is a cumulative EMA that adapts based on historical predictive power
🔧 User Inputs
Input
Base EMA Length: Sets the period for the shortest EMA (default: 20)
Smoothing Period: Smooths all EMAs and the cumulative EMA
Lookback for Learning: Number of bars to evaluate EMA prediction accuracy
Learning Rate: Adjusts how quickly weights shift in favor of more accurate EMAs
✅ How to Use It
Use the pivot level to define directional bias.
Watch for price breakouts above resistance or breakdowns below support to consider entry.
Avoid trading inside the shaded zone, where direction is less reliable.
Use the EMA ribbon gradient to confirm short/long alignment.
The cumulative EMA helps define trend with noise reduction.
🧪 Best For
Intraday traders who want to blend structure with flow
Swing traders needing clean daily levels with dynamic confirmation
Anyone looking to avoid choppy zones and improve visual clarity
⚠️ Disclaimer
This script is for educational and informational purposes only. It does not constitute financial advice or a trading recommendation. Always test scripts in simulation or on demo accounts before live use. Use at your own risk.
Search in scripts for "OHLC"

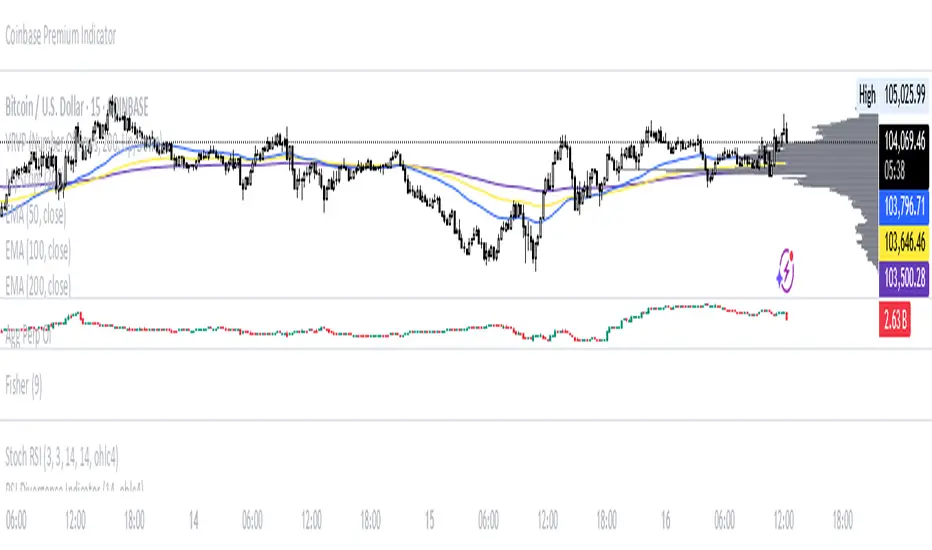
Aggregated Perpetual Futures Open InterestPurpose
Aggregates perpetual futures open interest across Binance, Bybit, and OKX for the base currency of the asset loaded in your tradingview window.
How It Works
Symbol detection: The script grabs syminfo.basecurrency (e.g., “BTC”) from whatever market is on screen.
Ticker mapping: It constructs the three perp-OI feeds that TradingView publishes in the form EXCHANGE:USDT.P_OI
Data request: For each feed it fetches the full OHLC candle (request.security) on the chart’s timeframe. If a venue doesn’t list that perp, the request simply returns na.
Aggregation: The script adds the opens, highs, lows, and closes of all non-na feeds to produce a single aggregated OI candle.
General Notes
The status line shows each venue’s individual OI close.
Heikin Ashi + MACD Momentum FilterThe Heikin Ashi + MACD Momentum Filter is designed for short-term and swing traders, combining the trend-smoothing capabilities of manually calculated Heikin Ashi candles with the momentum confirmation of the MACD histogram to generate reliable buy and sell signals. This indicator aligns trend direction with momentum shifts to minimize false signals, making it ideal for trading trending markets on timeframes like 5-minute to 1-hour charts.
How It Works
The indicator uses two technical components to produce signals:
Heikin Ashi for Trend Detection:
Heikin Ashi candles are manually calculated to smooth price action, with the close as the average of OHLC values and the open as the average of the previous Heikin Ashi open and close. These values are further smoothed over a default 5-period moving average. A bullish trend is confirmed when the smoothed Heikin Ashi close is above its open (plotted in green), and a bearish trend when the close is below the open (plotted in red). This smoothing reduces noise, helping traders stay in the direction of the prevailing trend.
MACD Histogram for Momentum Confirmation:
The MACD, calculated with standard settings (fast=12, slow=26, signal=9), produces a histogram. A buy signal requires the histogram to cross above a threshold (default: 0.0), indicating bullish momentum, while a sell signal requires a cross below, indicating bearish momentum. This ensures trades are taken when momentum supports the trend.
Signal Generation
Signals are generated using the previous bar’s values to prevent repainting:
Buy Signal: The MACD histogram crosses above the threshold, and the Heikin Ashi confirms a bullish trend. Displayed as a green upward triangle below the bar.
Sell Signal: The MACD histogram crosses below the threshold, and the Heikin Ashi confirms a bearish trend. Displayed as a red downward triangle above the bar.

Parsifal.Swing.CompositeThe Parsifal.Swing.Composite indicator is a module within the Parsifal Swing Suite, which includes a set of swing indicators such as:
• Parsifal Swing TrendScore
• Parsifal Swing Composite
• Parsifal Swing RSI
• Parsifal Swing Flow
Each module serves as an indicator facilitating judgment of the current swing state in the underlying market.
________________________________________
Background
Market movements typically follow a time-varying trend channel within which prices oscillate. These oscillations—or swings—within the trend are inherently tradable.
They can be approached:
• One-sidedly, aligning with the trend (generally safer), or
• Two-sidedly, aiming to profit from mean reversions as well.
Note: Mean reversions in strong trends often manifest as sideways consolidations, making one-sided trades more stable.
________________________________________
The Parsifal Swing Suite
The modules aim to provide additional insights into the swing state within a trend and offer various trigger points to assist with entry decisions.
All modules in the suite act as weak oscillators, meaning they fluctuate within a range but are not bounded like true oscillators (e.g., RSI, which is constrained between 0% and 100%).
________________________________________
The Parsifal.Swing.Composite – Specifics
This module consolidates multiple insights into price swing behavior, synthesizing them into an indicator reflecting the current swing state.
It employs layered bagging and smoothing operations based on standard price inputs (OHLC) and classical technical indicators. The module integrates several slightly different sub-modules.
Process overview:
1. Per candle/bin, sub-modules collect directional signals (up/down), with each signal casting a vote.
2. These votes are aggregated via majority counting (bagging) into a single bin vote.
3. Bin votes are then smoothed, typically with short-term EMAs, to create a sub-module vote.
4. These sub-module votes are aggregated and smoothed again to generate the final module vote.
The final vote is a score indicating the module’s assessment of the current swing state. While it fluctuates in a range, it's not a true oscillator, as most inputs are normalized via Z-scores (value divided by standard deviation over a period).
• Historically high or low values correspond to high or low quantiles, suggesting potential overbought or oversold conditions.
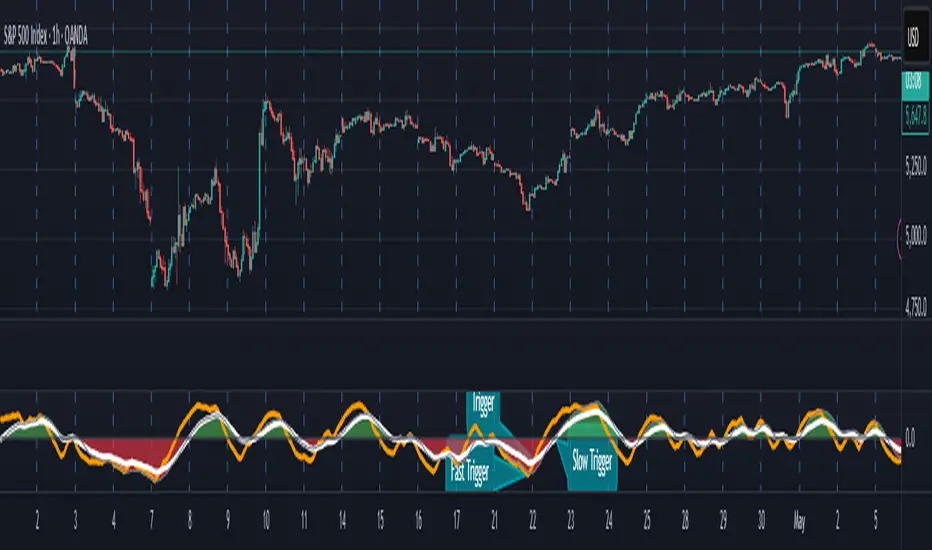
• The chart displays a fast (orange) and slow (white) curve against a solid background state.
• Extreme values followed by curve reversals may signal upcoming mean-reversions.
Background Value:
• Value > 0: shaded green → bullish mode
• Value < 0: shaded red → bearish mode
• The absolute value indicates confidence in the mode.
________________________________________
How to Use the Parsifal.Swing.Composite
Several change points in the indicator serve as potential entry triggers:
• Fast Trigger: change in slope of the fast curve
• Trigger: fast line crossing the slow line or change in the slow curve’s slope
• Slow Trigger: change in sign of the background value
These are illustrated in the introductory chart.
Additionally, market highs and lows aligned with swing values may act as pivot points, support, or resistance levels for evolving price processes.
________________________________________
As always, supplement this indicator with other tools and market information. While it provides valuable insights and potential entry points, it does not predict future prices. It reflects recent tendencies and should be used judiciously.
________________________________________
Extensions
All modules in the Parsifal Swing Suite are simple yet adaptable, whether used individually or in combination.
Customization options:
• Weights in EMAs for smoothing are adjustable
• Bin vote aggregation (currently via sum-of-experts) can be modified
• Alternative weighting schemes can be tested
Advanced options:
• Bagging weights may be historical, informational, or relevance-based
• Selection algorithms (e.g., ID3, C4.5, CAT) could replace the current bagging approach
• EMAs may be generalized into expectations relative to relevance-based probability
• Negative weights (akin to wavelet transforms) can be incorporated
AllCandlestickPatternsLibraryAll Candlestick Patterns Library
The Candlestick Patterns Library is a Pine Script (version 6) library extracted from the All Candlestick Patterns indicator. It provides a comprehensive set of functions to calculate candlestick properties, detect market trends, and identify various candlestick patterns (bullish, bearish, and neutral). The library is designed for reusability, enabling TradingView users to incorporate pattern detection into their own scripts, such as indicators or strategies.
The library is organized into three main sections:
Trend Detection: Functions to determine market trends (uptrend or downtrend) based on user-defined rules.
Candlestick Property Calculations: A function to compute core properties of a candlestick, such as body size, shadow lengths, and doji characteristics.
Candlestick Pattern Detection: Functions to detect specific candlestick patterns, each returning a tuple with detection status, pattern name, type, and description.
Library Structure
1. Trend Detection
This section includes the detectTrend function, which identifies whether the market is in an uptrend or downtrend based on user-specified rules, such as the relationship between the closing price and Simple Moving Averages (SMAs).
Function: detectTrend
Parameters:
downTrend (bool): Initial downtrend condition.
upTrend (bool): Initial uptrend condition.
trendRule (string): The rule for trend detection ("SMA50" or "SMA50, SMA200").
p_close (float): Current closing price.
sma50 (float): Simple Moving Average over 50 periods.
sma200 (float): Simple Moving Average over 200 periods.
Returns: A tuple indicating the detected trend.
Logic:
If trendRule is "SMA50", a downtrend is detected when p_close < sma50, and an uptrend when p_close > sma50.
If trendRule is "SMA50, SMA200", a downtrend is detected when p_close < sma50 and sma50 < sma200, and an uptrend when p_close > sma50 and sma50 > sma200.
2. Candlestick Property Calculations
This section includes the calculateCandleProperties function, which computes essential properties of a candlestick based on OHLC (Open, High, Low, Close) data and configuration parameters.
Function: calculateCandleProperties
Parameters:
p_open (float): Candlestick open price.
p_close (float): Candlestick close price.
p_high (float): Candlestick high price.
p_low (float): Candlestick low price.
bodyAvg (float): Average body size (e.g., from EMA of body sizes).
shadowPercent (float): Minimum shadow size as a percentage of body size.
shadowEqualsPercent (float): Tolerance for equal shadows in doji detection.
dojiBodyPercent (float): Maximum body size as a percentage of range for doji detection.
Returns: A tuple containing 17 properties:
C_BodyHi (float): Higher of open or close price.
C_BodyLo (float): Lower of open or close price.
C_Body (float): Body size (difference between C_BodyHi and C_BodyLo).
C_SmallBody (bool): True if body size is below bodyAvg.
C_LongBody (bool): True if body size is above bodyAvg.
C_UpShadow (float): Upper shadow length (p_high - C_BodyHi).
C_DnShadow (float): Lower shadow length (C_BodyLo - p_low).
C_HasUpShadow (bool): True if upper shadow exceeds shadowPercent of body.
C_HasDnShadow (bool): True if lower shadow exceeds shadowPercent of body.
C_WhiteBody (bool): True if candle is bullish (p_open < p_close).
C_BlackBody (bool): True if candle is bearish (p_open > p_close).
C_Range (float): Candlestick range (p_high - p_low).
C_IsInsideBar (bool): True if current candle body is inside the previous candle's body.
C_BodyMiddle (float): Midpoint of the candle body.
C_ShadowEquals (bool): True if upper and lower shadows are equal within shadowEqualsPercent.
C_IsDojiBody (bool): True if body size is small relative to range (C_Body <= C_Range * dojiBodyPercent / 100).
C_Doji (bool): True if the candle is a doji (C_IsDojiBody and C_ShadowEquals).
Purpose: These properties are used by pattern detection functions to evaluate candlestick formations.
3. Candlestick Pattern Detection
This section contains functions to detect specific candlestick patterns, each returning a tuple . The patterns are categorized as bullish, bearish, or neutral, and include detailed descriptions for use in tooltips or alerts.
Supported Patterns
The library supports the following candlestick patterns, grouped by type:
Bullish Patterns:
Rising Window: A two-candle continuation pattern in an uptrend with a price gap between the first candle's high and the second candle's low.
Rising Three Methods: A five-candle continuation pattern with a long green candle, three short red candles, and another long green candle.
Tweezer Bottom: A two-candle reversal pattern in a downtrend with nearly identical lows.
Upside Tasuki Gap: A three-candle continuation pattern in an uptrend with a gap between the first two green candles and a red candle closing partially into the gap.
Doji Star (Bullish): A two-candle reversal pattern in a downtrend with a long red candle followed by a doji gapping down.
Morning Doji Star: A three-candle reversal pattern with a long red candle, a doji gapping down, and a long green candle.
Piercing: A two-candle reversal pattern in a downtrend with a red candle followed by a green candle closing above the midpoint of the first.
Hammer: A single-candle reversal pattern in a downtrend with a small body and a long lower shadow.
Inverted Hammer: A single-candle reversal pattern in a downtrend with a small body and a long upper shadow.
Morning Star: A three-candle reversal pattern with a long red candle, a short candle gapping down, and a long green candle.
Marubozu White: A single-candle pattern with a long green body and minimal shadows.
Dragonfly Doji: A single-candle reversal pattern in a downtrend with a doji where open and close are at the high.
Harami Cross (Bullish): A two-candle reversal pattern in a downtrend with a long red candle followed by a doji inside its body.
Harami (Bullish): A two-candle reversal pattern in a downtrend with a long red candle followed by a small green candle inside its body.
Long Lower Shadow: A single-candle pattern with a long lower shadow indicating buyer strength.
Three White Soldiers: A three-candle reversal pattern with three long green candles in a downtrend.
Engulfing (Bullish): A two-candle reversal pattern in a downtrend with a small red candle followed by a larger green candle engulfing it.
Abandoned Baby (Bullish): A three-candle reversal pattern with a long red candle, a doji gapping down, and a green candle gapping up.
Tri-Star (Bullish): A three-candle reversal pattern with three doji candles in a downtrend, with gaps between them.
Kicking (Bullish): A two-candle reversal pattern with a bearish marubozu followed by a bullish marubozu gapping up.
Bearish Patterns:
On Neck: A two-candle continuation pattern in a downtrend with a long red candle followed by a short green candle closing near the first candle's low.
Falling Window: A two-candle continuation pattern in a downtrend with a price gap between the first candle's low and the second candle's high.
Falling Three Methods: A five-candle continuation pattern with a long red candle, three short green candles, and another long red candle.
Tweezer Top: A two-candle reversal pattern in an uptrend with nearly identical highs.
Dark Cloud Cover: A two-candle reversal pattern in an uptrend with a green candle followed by a red candle opening above the high and closing below the midpoint.
Downside Tasuki Gap: A three-candle continuation pattern in a downtrend with a gap between the first two red candles and a green candle closing partially into the gap.
Evening Doji Star: A three-candle reversal pattern with a long green candle, a doji gapping up, and a long red candle.
Doji Star (Bearish): A two-candle reversal pattern in an uptrend with a long green candle followed by a doji gapping up.
Hanging Man: A single-candle reversal pattern in an uptrend with a small body and a long lower shadow.
Shooting Star: A single-candle reversal pattern in an uptrend with a small body and a long upper shadow.
Evening Star: A three-candle reversal pattern with a long green candle, a short candle gapping up, and a long red candle.
Marubozu Black: A single-candle pattern with a long red body and minimal shadows.
Gravestone Doji: A single-candle reversal pattern in an uptrend with a doji where open and close are at the low.
Harami Cross (Bearish): A two-candle reversal pattern in an uptrend with a long green candle followed by a doji inside its body.
Harami (Bearish): A two-candle reversal pattern in an uptrend with a long green candle followed by a small red candle inside its body.
Long Upper Shadow: A single-candle pattern with a long upper shadow indicating seller strength.
Three Black Crows: A three-candle reversal pattern with three long red candles in an uptrend.
Engulfing (Bearish): A two-candle reversal pattern in an uptrend with a small green candle followed by a larger red candle engulfing it.
Abandoned Baby (Bearish): A three-candle reversal pattern with a long green candle, a doji gapping up, and a red candle gapping down.
Tri-Star (Bearish): A three-candle reversal pattern with three doji candles in an uptrend, with gaps between them.
Kicking (Bearish): A two-candle reversal pattern with a bullish marubozu followed by a bearish marubozu gapping down.
Neutral Patterns:
Doji: A single-candle pattern with a very small body, indicating indecision.
Spinning Top White: A single-candle pattern with a small green body and long upper and lower shadows, indicating indecision.
Spinning Top Black: A single-candle pattern with a small red body and long upper and lower shadows, indicating indecision.
Pattern Detection Functions
Each pattern detection function evaluates specific conditions based on candlestick properties (from calculateCandleProperties) and trend conditions (from detectTrend). The functions return:
detected (bool): True if the pattern is detected.
name (string): The name of the pattern (e.g., "On Neck").
type (string): The pattern type ("Bullish", "Bearish", or "Neutral").
description (string): A detailed description of the pattern for use in tooltips or alerts.
For example, the detectOnNeckBearish function checks for a bearish On Neck pattern by verifying a downtrend, a long red candle followed by a short green candle, and specific price relationships.
Usage Example
To use the library in a TradingView indicator, you can import it and call its functions as shown below:
//@version=6
indicator("Candlestick Pattern Detector", overlay=true)
import CandlestickPatternsLibrary as cp
// Calculate SMA for trend detection
sma50 = ta.sma(close, 50)
sma200 = ta.sma(close, 200)
= cp.detectTrend(true, true, "SMA50", close, sma50, sma200)
// Calculate candlestick properties
bodyAvg = ta.ema(math.max(close, open) - math.min(close, open), 14)
= cp.calculateCandleProperties(open, close, high, low, bodyAvg, 5.0, 100.0, 5.0)
// Detect a pattern (e.g., On Neck Bearish)
= cp.detectOnNeckBearish(downTrend, blackBody, longBody, whiteBody, open, close, low, bodyAvg, smallBody, candleRange)
if onNeckDetected
label.new(bar_index, low, onNeckName, style=label.style_label_up, color=color.red, textcolor=color.white, tooltip=onNeckDesc)
// Detect another pattern (e.g., Piercing Bullish)
= cp.detectPiercingBullish(downTrend, blackBody, longBody, whiteBody, open, low, close, bodyMiddle)
if piercingDetected
label.new(bar_index, low, piercingName, style=label.style_label_up, color=color.blue, textcolor=color.white, tooltip=piercingDesc)
Steps in the Example
Import the Library: Use import CandlestickPatternsLibrary as cp to access the library's functions.
Calculate Trend: Use detectTrend to determine the market trend based on SMA50 or SMA50/SMA200 rules.
Calculate Candlestick Properties: Use calculateCandleProperties to compute properties like body size, shadow lengths, and doji status.
Detect Patterns: Call specific pattern detection functions (e.g., detectOnNeckBearish, detectPiercingBullish) and use the returned values to display labels or alerts.
Visualize Patterns: Use label.new to display detected patterns on the chart with their names, types, and descriptions.
Key Features
Modularity: The library is designed as a standalone module, making it easy to integrate into other Pine Script projects.
Comprehensive Pattern Coverage: Supports over 40 candlestick patterns, covering bullish, bearish, and neutral formations.
Detailed Documentation: Each function includes comments with @param and @returns annotations for clarity.
Reusability: Can be used in indicators, strategies, or alerts by importing the library and calling its functions.
Extracted from All Candlestick Patterns: The library is derived from the All Candlestick Patterns indicator, ensuring it inherits a well-tested foundation for pattern detection.
Notes for Developers
Pine Script Version: The library uses Pine Script version 6, as specified by //@version=6.
Parameter Naming: Parameters use prefixes like p_ (e.g., p_open, p_close) to avoid conflicts with built-in variables.
Error Handling: The library has been fixed to address issues like undeclared identifiers (C_SmallBody, C_Range), unused arguments (factor), and improper comment formatting.
Testing: Developers should test the library in TradingView to ensure patterns are detected correctly under various market conditions.
Customization: Users can adjust parameters like bodyAvg, shadowPercent, shadowEqualsPercent, and dojiBodyPercent in calculateCandleProperties to fine-tune pattern detection sensitivity.
Conclusion
The Candlestick Patterns Library, extracted from the All Candlestick Patterns indicator, is a powerful tool for traders and developers looking to implement candlestick pattern detection in TradingView. Its modular design, comprehensive pattern support, and detailed documentation make it an ideal choice for building custom indicators or strategies. By leveraging the library's functions, users can analyze market trends, compute candlestick properties, and detect a wide range of patterns to inform their trading decisions.

Daily Breakout + Daily Shadow By RouroThis script is a Pine v5 strategy designed to detect daily candle body breakouts and execute them on any intraday timeframe, while also providing:
Daily Data Retrieval
Using request.security(..., "D", ...) it fetches the OHLC and timestamp of the daily candle, regardless of the chart’s current timeframe.
Calculation of Yesterday’s and Day-Before-Yesterday’s Bodies
b1High and b1Low → the high/low of yesterday’s daily candle body
b2High and b2Low → the high/low of the previous day’s body
Detection of the First Intraday Bar After a New Day
By using ta.change(time("D")), it marks the start of each new trading day.
Drawing the Previous Day’s “Shadow” on the Chart
It overlays a box (box.new) and two wick lines (line.new) with configurable colors and transparency, so you can clearly see the full range of yesterday’s candle on any intraday chart.
Automatic End-of-Day Position Closure
It will automatically close any open position at the start of the next day to avoid unintended rollovers.
Entry Signals
On the very first intraday bar after the daily close:
Long if yesterday’s close broke above the body of the day before yesterday
Short if yesterday’s close broke below the body of the day before yesterday
…which triggers a strategy.entry at the intraday open.
Fully Customizable Stop-Loss and Take-Profit
SL options:
Opposite end of yesterday’s body
Fixed pips from entry
A risk-reward ratio on yesterday’s wick
Optional “safety SL” in fixed pips that overrides the above
TP options:
Fixed pips
Yesterday’s wick extreme (high/low)
Partial exit on the wick (TP1), then second exit (TP2) either:
At a multiplied RR
Or at the daily close (“Close of Day”)
You can also choose to move SL to breakeven after TP1 is hit.
Live Metrics Table
In the upper-right corner it displays in real time:
Start of backtest (date of first trade)
Number of ✅ Winning trades and ❌ Losing trades
Total number of trades
Win rate (%)
Profit Factor
All within a fixed table layout so it never runs out of rows or columns.

Market Sessions & Viewer Panel [By MUQWISHI]▋ INTRODUCTION :
The “Market Sessions & Viewer Panel” is a clean and intuitive visual indicator tool that highlights up to four trading sessions directly on the chart. Each session is fully customizable with its name, session time, and color. It also generates a panel that provides a quick-glance summary of each session’s candle/bar shape, helping traders gain insight into the volatility across all trading sessions.
_______________________
▋ OVERVIEW:
_______________________
▋ CREDIT:
This indicator utilizes the “ Timezone — Library ”. A huge thanks to @n00btraders for effort and well-organized work.
_______________________
▋ SESSION PANEL:
The Session Panel allows traders to visually compare session volatility using a candlestick/bar pattern.
Each bar represents the price action during a session and includes the session status, session name, closing price, change(%) from open, and a tooltip that reveals detailed OHLC and volume when hovered over.
Chart Type:
It offers two styles Bar or Candle to display based on traders’ preference
Sorting:
Allowing to arrange session candles/bars based on…
—Left to Right: The most recently opened on the left, moving backward in time to the right.
—Right to Left: The most recently opened on the right, moving backward in time to the left.
—Default: Arrange sessions in the user-defined input order.
_______________________
▋ CHART VISUALIZATION:
The chart visualization highlights each trading session using color-coded backgrounds in two selectable drawing styles that span their respective active timeframes. Each session block provides session’s name, close price, and change from open.
Chart Type: Candle
Chart Type: Box
Extra Drawing Feature:
This feature may not exist in other indicators within the same category, it extends the session block drawing to the projected end of the session. This's done through estimation based on historical data; however, it doesn’t function fully on seconds-based timeframes due to drawing limitations.
_______________________
▋ INDICATOR SETTINGS:
Section(1): Sessions
(1) Universal Timezone.
(2) Each Session: Enable/Disable, Name, Color, and Time.
Section(2): Session Panel
(1) Show/Hide Session Panel.
(2) Chart Type: Candle/Bar.
(3) Bar’s Up/Down color.
(4) Width and Height of the bar.
(5) Location of Session Panel on chat.
(6) Sort: Left to Right (most recent session is placed on the left), Right to Left (most recent session is placed on the right), and Default (as input arrangement).
Section(3): Chart Visualization
(1) Show/Hide Chart Block Visualization.
(2) Draw Shape: Box/Candle.
(3) Border Style and Size.
(4) Label Styling includes location, size, and some essential selectable infos.
Please let me know if you have any questions

FeraTrading Relative Volume IndicatorThis FeraTrading Relative Volume Indicator measures relative volume pressure by comparing buying and selling activity, smoothed using a configurable average. It helps traders identify volume-driven momentum shifts, offering dynamic buy and sell signals based on weighted pressure values.
Key Features:
📈 Relative Volume (RV) Line: Measures net buying/selling pressure using volume-weighted price action.
🟢 Buy Signals: Triggered when RV crosses above a smoothed moving average (SMA 1).
🔴 Sell Signals (optional): Triggered when RV crosses below a separate SMA (SMA 2).
🔍 Customizable Inputs: Adjust smoothing length, weight, and signal sensitivity.
🕯️ Weighted Candles (optional): Visualizes custom OHLC based on volume-weighted volatility.
📊 Two SMAs: Use separate or combined moving averages to analyze trends in pressure.
🎨 Flexible Styling: Customize line and signal colors to match your chart setup.
Use Cases:
Spotting accumulation/distribution phases
Timing entries during volume surges
Confirming breakout momentum with underlying volume pressure
This indicator was developed by FeraTrading to visualize relative volume pressure.

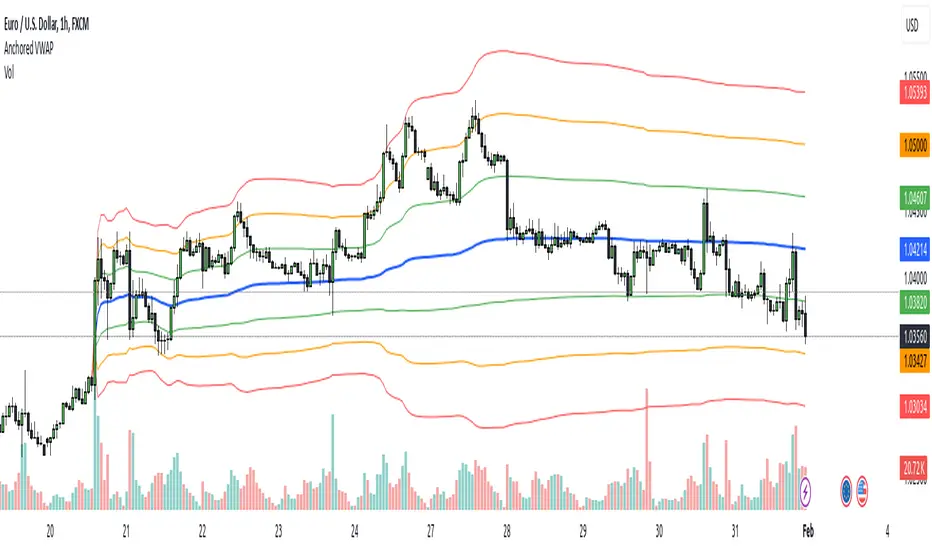
Anchored VWAP Pro (Final Visibility Enhanced)This is a fully customizable Anchored VWAP (Volume Weighted Average Price) indicator designed for traders who prioritize precision, clarity, and macro trend analysis.
Unlike traditional VWAPs tied to daily or session data, this version allows you to manually anchor the VWAP to any candle in history—ideal for macro swing trading, cycle lows, breakouts, and reaccumulation phases.
Features:
• Manual Anchor Date: Set the exact year, month, and day for your VWAP to begin
• Custom Price Source: Choose between HLC3, close, or any OHLC-based input
• VWAP Bands: Two standard deviation bands for identifying overextension or fair value zones
• Full Visual Control:
• Toggle each band on/off individually
• Adjust color, line width, and line style (solid, dotted, dashed)
• Built for Clarity: Designed to stand out on both light and dark charts
This script is ideal for:
• Identifying macro confluence zones
• Defining risk during trend pullbacks
• Confirming breakout legitimacy
• Layering with other tools like Market Cipher, VRVP, and Fib levels
Inspired by the work of LonesomeTheBlue, Algokid, and other pros—this is a cleaner, more flexible and updated alternative for precision trading.
Script created and published by @ImmortalEmerson
For advanced swing traders, crypto analysts, and macro trend specialists.
NR_VersatilitiesLibrary "NR_Versatilities"
Versatilities (aka, Versatile Utilities) includes:
- Seventeen Price Variants returned as a tuple,
- Eight Smoothing functions rolled into one,
- Pick any Past Value from any series with offset,
- Or just the previous value from any series.
pastVal(src, len)
Fetches past value from src that came len distance ago
Parameters:
src (float) : source series
len (int) : lookback distance - (optional) default is 1
Returns: latest src if len <= 0, else src
previous(src)
Fetches past value from src that came len distance ago
Parameters:
src (float) : source series
Returns: previous value in the series if found, else current value
price_variants()
Computes Several different averages using current and previous OHLC values
Returns: Seventeen Uncommon Average Price Combinations
dynamic_MA(matyp, masrc, malen, lsmaoff, almasgm, almaoff, almaflr)
Dynamically computes Eight different MAs on-demand individually, or an average of all taken together
Parameters:
matyp (string) : pick one of these MAs - ALMA, EMA, HMA, LSMA, RMA, SMA, SWMA, WMA, ALL
masrc (float) : source series to compute MA
malen (simple int) : lookback distance for MA
lsmaoff (simple int) : optional LSMA offset - default is 0
almasgm (simple float) : optional ALMA sigma - default is 5
almaoff (simple float) : optional ALMA offset - default is 0.5
almaflr (simple bool) : optional ALMA floor flag - default is false
Returns: MA series for chosen type or, an average of all of them, if chosen so

Daily OHLC from 8:00 UTCDisplays Daily Open, High, and Low price levels, resetting at 8:00 AM UTC each day. Ideal for intraday trading reference points.

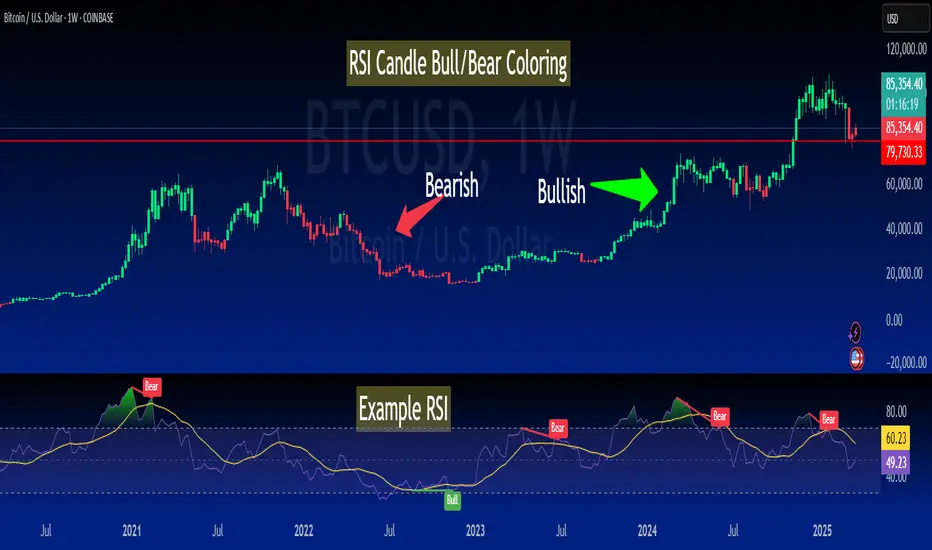
RSI-Colored Price Candles with BackgroundThis Pine Script indicator visually enhances price candles based on **RSI (Relative Strength Index)** behavior, helping traders quickly assess momentum directly on the price chart.
**RSI Calculation:**
The RSI is computed using a traditional 14-period lookback. It uses `ta.rma()` to smooth average gains and losses, and then transforms the result into an RSI value between 0 and 100. This value is used to determine both **candle color** and optional **background shading**.
**Candle Coloring:**
Each price candle is recolored based on the current RSI value:
- If RSI is **greater than or equal to 50**, the candle is **bright green**, indicating bullish momentum.
- If RSI is **less than 50**, the candle is **bright red**, indicating bearish momentum.
The actual OHLC values of the candles remain unchanged. Only their color is modified to reflect RSI strength.
**Optional Background Highlighting:**
A user setting called `Show Overbought/Oversold Background` lets traders toggle background shading on or off. When enabled:
- If RSI is **above 70**, a soft **green** background appears, signaling overbought conditions.
- If RSI is **below 30**, a soft **red** background appears, signaling oversold conditions.
This provides an intuitive visual cue that highlights potential reversal or exhaustion zones based on RSI extremes.
**Custom Settings:**
- The RSI length and source are customizable.
- Background highlighting is turned **off by default**, giving users a clean chart unless they choose to enable it.
**Purpose and Use:**
This script is designed for traders who want to visually integrate RSI momentum directly into their chart candles, reducing the need to look away from price action. It's clean, responsive, and adjustable — perfect for intraday or swing traders who value simplicity backed by momentum data.
Vortex Candle MarkerVortex Candle Marker
The Vortex Candle Marker is a specialized TradingView indicator designed to identify and highlight **Vortex Candles**—candles that momentarily form without wicks on either the high or low. This unique price behavior can signal potential price retracements or reversals, aligning with the **Power of Three (PO3)** concept in price action theory.
Indicator Logic:
A candle is classified as a **Vortex Candle** if either of these conditions is met during its formation:
1. **Vortex Top:** The **high** equals either the **open** or **close**, indicating no upper wick.
2. **Vortex Bottom:** The **low** equals either the **open** or **close**, indicating no lower wick.
When a Vortex Candle is detected, the indicator changes the **candle border color** to **aqua**, making it easy to identify these significant price moments.
Market Insight & PO3 Interpretation:
In typical price behavior, most candles exhibit both upper and lower wicks, representing price exploration before settling at a closing value. A candle forming without a wick suggests **strong directional intent** at that moment. However, by the **Power of Three (PO3)** concept—Accumulation, Manipulation, and Distribution—such wickless formations often imply:
- **Price Reversion Likelihood:** When a candle temporarily forms without a wick, it suggests the market may **revisit the opening price** to establish a wick before the candle closes.
- **Liquidity Manipulation:** The absence of a wick may indicate a **stop-hunt** or liquidity grab, where the price manipulates one side before reversing.
- **Entry Triggers:** Identifying these moments can help traders anticipate potential **retracements** or **continuations** within the PO3 framework.
Practical Application
- **Early Reversal Detection:** Spot potential price reversals by observing wickless candles forming at key levels.
- **Breakout Validation:** Use Vortex Candles to confirm **true breakouts** or **false moves** before the price returns.
- **Liquidity Zones:** Identify areas where the market is likely to revisit to create a wick, signaling entry/exit points.
This indicator is a powerful tool for traders applying **Po3** methodologies and seeking to capture price manipulation patterns.

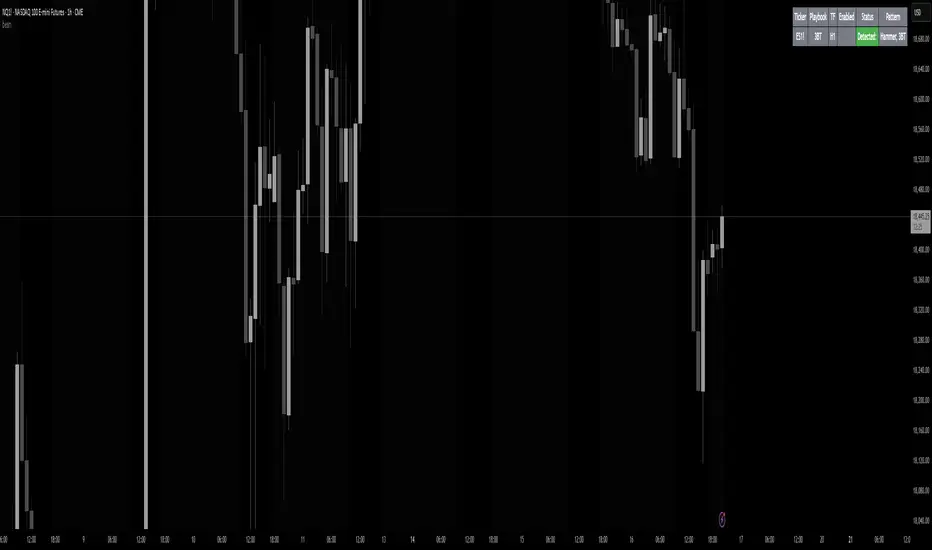
beanBean's Multi-Instrument Pattern Scanner.
This indicator scans H1 timeframe for specific technical patterns. Here's how each pattern is detected:
PATTERN DETECTION CRITERIA:
1. Hammer
- Body Size: ≤ 30% of total candle length
- Lower Wick: > 50% of total candle length
- Upper Wick: < 20% of total candle length
- Formula:
* bodySize = |close - open|
* upperWick = high - max(open, close)
* lowerWick = min(open, close) - low
* totalLength = high - low
2. Shooting Star
- Body Size: ≤ 30% of total candle length
- Upper Wick: > 50% of total candle length
- Lower Wick: < 20% of total candle length
- Uses same measurements as Hammer but inverted
3. Outside/Inside (OI)
Checks three consecutive bars:
- Outside Bar: Bar2 high ≥ Bar3 high AND Bar2 low ≤ Bar3 low
- Inside Bar: Bar1 high ≤ Bar2 high AND Bar1 low ≥ Bar2 low
Pattern confirms when both conditions are met
4. Bullish/Bearish Umbrella
Checks two consecutive bars:
Bullish:
- Current bar's high ≤ previous bar's high
- Current body high ≤ previous bar's high
- Current body low ≥ previous body high
Bearish:
- Current bar's low ≥ previous bar's low
- Current body low ≥ previous bar's low
- Current body high ≤ previous body low
5. Three Bar Triangle (3BT)
Checks three consecutive bars:
- Current bar's high ≤ max(previous two highs)
- Current bar's low ≥ min(previous two lows)
- Indicates price compression
DISPLAY AND ALERTS:
- Patterns are displayed in real-time in the table
- Multiple patterns can be detected simultaneously
- Pattern detection resets each new H1 candle
CONFIGURATION:
- Each row can be independently configured
- Patterns are checked on H1 timeframe close
- Alert frequency: Once per H1 bar close
Note: All measurements use standard OHLC values from only completed H1 candles.
AMD Session Structure Levels# Market Structure & Manipulation Probability Indicator
## Overview
This advanced indicator is designed for traders who want a systematic approach to analyzing market structure, identifying manipulation, and assessing probability-based trade setups. It incorporates four core components:
### 1. Session Price Action Analysis
- Tracks **OHLC (Open, High, Low, Close)** within defined sessions.
- Implements a **dual tracking system**:
- **Official session levels** (fixed from the session open to close).
- **Real-time max/min tracking** to differentiate between temporary spikes and real price acceptance.
### 2. Market Manipulation Detection
- Identifies **manipulative price action** using the relationship between the open and close:
- If **price closes below open** → assumes **upward manipulation**, followed by **downward distribution**.
- If **price closes above open** → assumes **downward manipulation**, followed by **upward distribution**.
- Normalized using **ATR**, ensuring adaptability across different volatility conditions.
### 3. Probability Engine
- Tracks **historical wick ratios** to assess trend vs. reversal conditions.
- Calculates **conditional probabilities** for price moves.
- Uses a **special threshold system (0.45 and 0.03)** for reversal signals.
- Provides **real-time probability updates** to enhance trade decision-making.
### 4. Market Condition Classification
- Classifies market conditions using a **wick-to-body ratio**:
```pine
wick_to_body_ratio = open > close ? upper_wick / (high - low) : lower_wick / (high - low)
```
- **Low ratio (<0.25)** → Likely a **trend day**.
- **High ratio (>0.25)** → Likely a **range day**.
---
## Why This Indicator Stands Out
### ✅ Smarter Level Detection
- Uses **ATR-based dynamic levels** instead of static support/resistance.
- Differentiates **manipulation from distribution** for better decision-making.
- Updates probabilities **in real-time**.
### ✅ Memory-Efficient Design
- Implements **circular buffers** to maintain efficiency:
```pine
var float manipUp = array.new_float(lookbackPeriod, 0.0)
var float manipDown = array.new_float(lookbackPeriod, 0.0)
```
- Ensures **constant memory usage**, even over extended trading sessions.
### ✅ Advanced Probability Calculation
- Utilizes **conditional probabilities** instead of simple averages.
- Incorporates **market context** through wick analysis.
- Provides **actionable signals** via a probability table.
---
## Trading Strategy Guide
### **Best Entry Setups**
✅ Wait for **price to approach manipulation levels**.
✅ Confirm using the **probability table**.
✅ Check the **wick ratio for context**.
✅ Enter when **conditional probability aligns**.
### **Smart Exit Management**
✅ Use **distribution levels** as **profit targets**.
✅ Scale out **when probabilities shift**.
✅ Monitor **wick percentiles** for confirmation.
### **Risk Management**
✅ Size positions based on **probability readings**.
✅ Place stops at **manipulation levels**.
✅ Adjust position size based on **trend vs. range classification**.
---
## Configuration Tips
### **Session Settings**
```pine
sessionTime = input.session("0830-1500", "Session Hours")
weekDays = input.string("23456", "Active Days")
```
- Match these to your **primary trading session**.
- Adjust for different **market opens** if needed.
### **Analysis Parameters**
```pine
lookbackPeriod = input.int(50, "Lookback Period")
low_threshold = input.float(0.25, "Trend/Range Threshold")
```
- **50 periods** is a good starting point but can be optimized per instrument.
- The **0.25 threshold** is ideal for most markets but may need adjustments.
---
## Market Structure Breakdown
### **Trend/Continuation Days**
- **Characteristics:**
✅ Small **opposing wicks** (minimal counter-pressure).
✅ Clean, **directional price movement**.
- **Bullish Trend Day Example:**
✅ Small **lower wicks** (minimal downward pressure).
✅ Strong **closes near the highs** → **Buyers in control**.
- **Bearish Trend Day Example:**
✅ Small **upper wicks** (minimal upward pressure).
✅ Strong **closes near the lows** → **Sellers in control**.
### **Reversal Days**
- **Characteristics:**
✅ **Large opposing wicks** → Failed momentum in the initial direction.
- **Bullish Reversal Example:**
✅ **Large upper wick early**.
✅ **Strong close from the lows** → **Sellers failed to maintain control**.
- **Bearish Reversal Example:**
✅ **Large lower wick early**.
✅ **Weak close from the highs** → **Buyers failed to maintain control**.
---
## Summary
This indicator systematically quantifies market structure by measuring **manipulation, distribution, and probability-driven trade setups**. Unlike traditional indicators, it adapts dynamically using **ATR, historical probabilities, and real-time tracking** to offer a structured, data-driven approach to trading.
🚀 **Use this tool to enhance your decision-making and gain an objective edge in the market!**

Anchored VWAPAnchored VWAP with 3 Standard Deviation Bands
📈 Version: Pine Script v5
📌 Author: Aymen Haddaji
🔍 Overview
This indicator calculates an Anchored Volume-Weighted Average Price (AVWAP), allowing traders to anchor the VWAP calculation from a user-defined date and time. It also plots three standard deviation bands above and below the AVWAP to help identify potential areas of overbought and oversold conditions.
📊 Features & Functionality
✔ Custom Anchor Point: Select a specific date and time to start the AVWAP calculation.
✔ OHLC/4 Calculation: Uses the average of Open, High, Low, and Close to smooth the price input.
✔ Three Standard Deviation Bands:
1st Deviation (Green): Moderate volatility zone.
2nd Deviation (Orange): High volatility zone.
3rd Deviation (Red): Extreme overbought/oversold areas.
✔ Real-Time Calculation: Updates dynamically with each price movement.
✔ Clear Visuals:
AVWAP (Blue Line) represents the fair market price from the anchor.
Deviation Bands (Dashed Lines) show potential support and resistance levels.
🛠 How It Works
VWAP Calculation
Uses a cumulative sum of price × volume divided by cumulative volume.
Calculation starts from the user-defined anchor time.
Standard Deviation Bands
Measures the price dispersion around the AVWAP.
The wider the bands, the higher the volatility.
When price touches or exceeds the 3rd deviation, a potential reversal zone is indicated.
Trading Strategies with AVWAP & Deviation Bands
Trend Confirmation:
Price above AVWAP = Uptrend (bullish).
Price below AVWAP = Downtrend (bearish).
Support & Resistance:
AVWAP acts as dynamic support or resistance.
1st & 2nd deviations often act as secondary levels.
Mean Reversion Trading:
When price reaches the 3rd standard deviation, a pullback is likely.
Breakout Confirmation:
A strong close above/below the 3rd deviation may indicate trend continuation.
⚙️ Input Settings
📍 Anchor Time: Allows you to set the exact date and time to start the AVWAP calculation.
🎯 Ideal For
✅ Intraday traders looking for short-term mean reversion plays.
✅ Swing traders identifying key support/resistance zones.
✅ Trend traders confirming long-term market direction.
✅ Volatility traders using standard deviation for trade entries.
CAD CHF JPY (Index) vs USDDescription:
Analyze the combined performance of CAD, CHF, and JPY against the USD with this customized Forex currency index. This tool enables traders to gain a broader perspective of how these three currencies behave relative to the US Dollar by aggregating their movements into a single index. It’s a versatile tool designed for traders seeking actionable insights and trend identification.
Core Features:
Flexible Display Options:
Choose between Line Mode for a simplified view of the index trend or Candlestick Mode for detailed analysis of price action.
Custom Weight Adjustments:
Fine-tune the weight of each currency pair (USD/CAD, USD/CHF, USD/JPY) to better reflect your trading priorities or market expectations.
Moving Average Integration:
Add a moving average to smooth the data and identify trends more effectively. Choose your preferred type: SMA, EMA, WMA, or VWMA, and configure the number of periods to suit your strategy.
Streamlined Calculation:
The index aggregates data from USD/CAD, USD/CHF, and USD/JPY using a weighted average of their OHLC (Open, High, Low, Close) values, ensuring accuracy and adaptability to different market conditions.
Practical Applications:
Trend Identification:
Use the Line Mode with a moving average to confirm whether CAD, CHF, and JPY collectively show strength or weakness against the USD. A rising trendline signals currency strength, while a declining line suggests USD dominance.
Weight-Based Analysis:
If CAD is expected to lead, adjust its weight higher relative to CHF and JPY to emphasize its influence in the index. This customization makes the indicator adaptable to your market outlook.
Actionable Insights:
Identify key reversal points or breakout opportunities by analyzing the interaction of the index with its moving average. Combined with other technical tools, this indicator becomes a robust addition to any trader’s toolkit.
Additional Notes:
This indicator is a valuable resource for comparing the collective behavior of CAD, CHF, and JPY against the USD. Pair it with additional oscillators or divergence tools for a comprehensive market overview.
Perfect for both intraday analysis and swing trading strategies. Combine it with EUR GPB AUD (Index) indicator.
Good Profits!

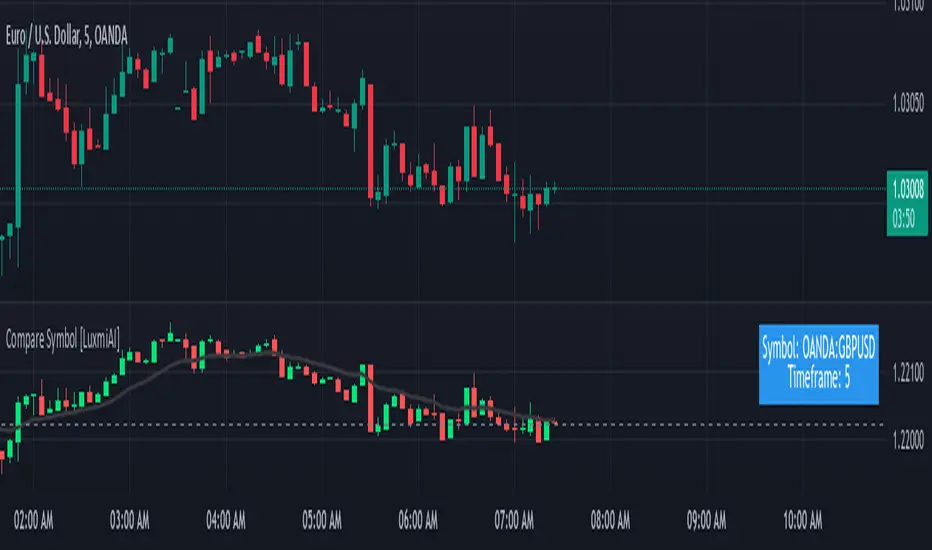
Compare Symbol [LuxmiAI]This indicator allows users to plot candles or bars for a selected symbol and add a moving average of their choice as an underlay. Users can customize the moving average type and length, making it versatile for a wide range of trading strategies.
This script is designed to offer flexibility, letting traders select the symbol, timeframe, candle style, and moving average type directly from the input options. The moving averages include the Exponential Moving Average (EMA), Simple Moving Average (SMA), Weighted Moving Average (WMA), and Volume-Weighted Moving Average (VWMA).
Features of the Script
This indicator provides the following key features:
1. Symbol Selection: Users can input the ticker symbol for which they want to plot the data.
2. Timeframe Selection: The script allows users to choose a timeframe for the symbol data.
3. Candle Styles: Users can select from three styles - regular candles, bars, or Heikin-Ashi candles.
4. Moving Average Options: Users can choose between EMA, SMA, WMA, and VWMA for added trend analysis.
5. Customizable Moving Average Length: The length of the moving average can be adjusted to suit individual trading strategies.
How the Script Works
The script starts by taking user inputs for the symbol and timeframe. It then retrieves the open, high, low, and close prices of the selected symbol and timeframe using the request.security function. Users can select between three candle styles: standard candles, bars, and Heikin-Ashi candles. If Heikin-Ashi candles are selected, the script calculates the Heikin-Ashi open, high, low, and close values.
To add further analysis capabilities, the script includes a moving average. Traders can select the moving average type from EMA, SMA, WMA, or VWMA and specify the desired length. The selected moving average is then plotted on the chart to provide a clear visualization of the trend.
Step-by-Step Implementation
1. Input Options: The script starts by taking inputs for the symbol, timeframe, candle style, moving average type, and length.
2. Data Retrieval: The script fetches OHLC data for the selected symbol and timeframe using request.security.
3. Candle Style Logic: It determines which candle style to plot based on the user’s selection. If Heikin-Ashi is selected, the script calculates Heikin-Ashi values.
4. Moving Average Calculation: Depending on the user’s choice, the script calculates the selected moving average.
5. Visualization: The script plots the candles or bars and overlays the moving average on the chart.
Benefits of Using This Indicator
This custom indicator provides multiple benefits for traders. It allows for quick comparisons between symbols and timeframes, helping traders identify trends and patterns. The flexibility to choose different candle styles and moving averages enhances its adaptability to various trading strategies. Additionally, the ability to customize the moving average length makes it suitable for both short-term and long-term analysis.
HTF CandlesHTF Candles, Plot of a Higher/Lower Timeframe Candles on any chart.
This HTF / LTF candle plot displays the previous 3 daily candles with the current update of the price with reference to a lower time frame.
Candles includes 3 Candles of HTF
last HTF candle includes 4 previous candles from LTF
Candle High Low Open Close are plotted.
these OHLC values act as Support and Resistance With reference to current Price.
very useful in making HTF and LTF analysis with reference to current timeframe.

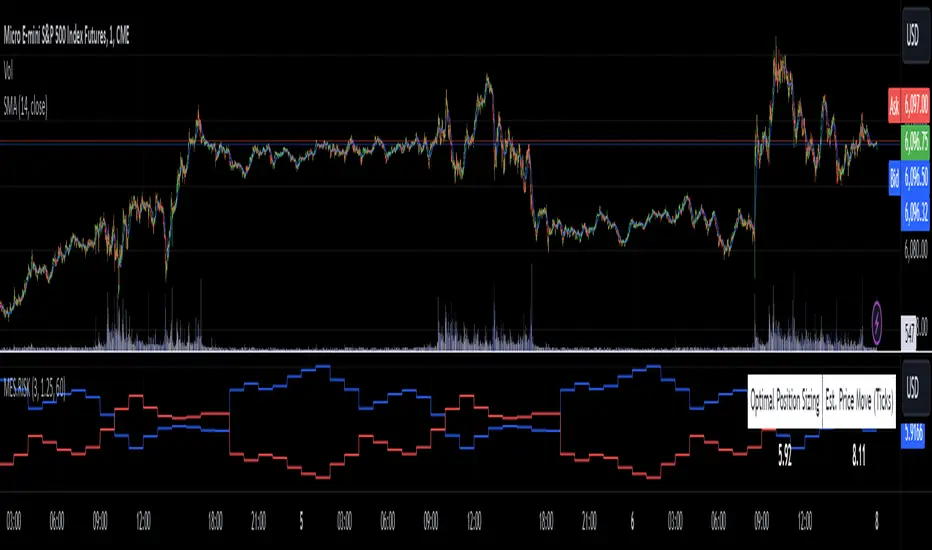
MES Position Sizing EstimatorDescription and Use:
Here is an indicator which aims to help all Micro-ES futures traders who struggle with risk management! I created this indicator designed as a general guideline to help short term traders (designed for 1 minute candles) determine how many contracts to trade on the MES for their desired profit target.
To use the indicator, simply go to MES on the 1 minute timeframe, apply the indicator, and enter your Holding Period (how long you want to have your position open for), Value Per Tick
(usually 1.25 for MES since one point is $5) and your target PnL for the trade in the inputs tab.
It will then show in a table the recommended position sizing, as well as the estimated price change for your holding period. Additionally, there are two plotted lines also showing the position sizing and estimated price change historically.
How the indicator works
On the technical level, I made calculations for this indicator using Python. I downloaded 82 days of 1 minute OHLC data from TradingView, and then ran regression (log-transformed linear regression specifically) to calculate how the average price change in MES futures scales with the amount of time a position is held for, and then ran these regressions for every hour of the day. I then copied the equations from those regressions into Pinescript, and used the assumption that:
position size = target PnL / (estimated price change for time * tick value)
Therefore, Choosing the number of contracts to trade position sizing for Micro E-mini S&P 500 Futures (MES) based on time of day, holding period, and tick value. This tool leverages historical volatility patterns and log-transformed linear regression models to provide precise recommendations tailored to your trading strategy.
If you want to check out how the regression code worked in python, it is all open source and available on my Github repository for it .
Notes:
The script assumes a log-normal distribution of price movements and is intended as an educational tool to aid in risk management.
It is not a standalone trading system and should be used in conjunction with other trading strategies and risk assessments.
Past performance is not indicative of future results, and traders should exercise caution and adjust their strategies based on personal risk tolerance.
This script is open-source and available for use and modification by the TradingView community. It aims to provide a valuable resource for traders seeking to enhance their risk management practices through data-driven insights.
Monest Value Indicator (MVI)
Description
The Monest Value Indicator (MVI) is a modern oscillator designed to address common issues in traditional oscillators like RSI or MACD. Unlike classical oscillators, the MVI dynamically adjusts to relative price movements and market volatility, providing a transparent and reliable valuation for short-term trading decisions.
This indicator normalizes price data around a consensus line and accounts for market volatility using the Average True Range (ATR). It highlights overbought and oversold conditions, offering a unique perspective for traders.
Key Features
Dynamic Overbought/Oversold Levels : Highlights significant price extremes for better entry and exit signals. Volatility Normalization : Adapts to market conditions, ensuring consistent readings across various assets. Consensus-Based Valuation : Uses a moving average of the midrange price for baseline calculations. No Lag or Stickiness : Reacts promptly to price movements without getting stuck in extreme zones.
How It Works
Consensus Line :
Calculated as a 5-day moving average of the midrange:
Consensus = SMA((High + Low) / 2, 5) .
Offset OHLC Data :
All prices are adjusted relative to the consensus line:
Offset Price = Price - Consensus .
Volatility Normalization :
Adjusted prices are normalized using a 5-day ATR divided by 5:
Normalized Price = Offset Price / (ATR / 5) .
MVI Calculation :
The normalized closing price is plotted as the MVI.
Overbought/Oversold Levels :
Default levels are set at +8 (overbought) and -8 (oversold).
How to Use
Identifying Overbought/Oversold Conditions :
When the MVI crosses above +8 , the asset is overbought, signaling a potential reversal or pullback.
When the MVI drops below -8 , the asset is oversold, indicating a potential bounce or upward move.
Trend Confirmation :
Use the MVI to confirm trends by observing sustained movements above or below zero.
Combine with other trend indicators (e.g., Moving Averages) for robust analysis.
Alerts :
Set alerts for when the MVI crosses overbought or oversold levels to stay informed about potential trading opportunities.
Inputs
ATR Length : Default is 5. Adjust to modify the sensitivity of volatility normalization. Consensus Length : Default is 5. Change to tweak the baseline calculation.
Example
Overbought Signal : MVI exceeds +8 , indicating the asset may reverse from an overvalued position. Oversold Signal : MVI drops below -8 , suggesting the asset may recover from an undervalued state. Flat Market : MVI hovers near zero, indicating price consolidation.

Pine Script Boilerplate ExampleI frequently receive questions about my coding style and logic, so I decided to publish a simple indicator that draws the OHLC of a higher timeframe as an example of my coding style. This example will also explain my approach to writing indicators.
This indicator showcases how I use Types and Methods to structure my code and maintain clarity in logic. It demonstrates how I collect input data, organize the flow of the code, and utilize the TradingView method feature.
The example illustrates:
1. The use of input settings within a settings object to keep configurations grouped together.
2. The use of Types to create an object that consolidates relevant data.
3. The collection of objects to create, update, and render elements on the chart.

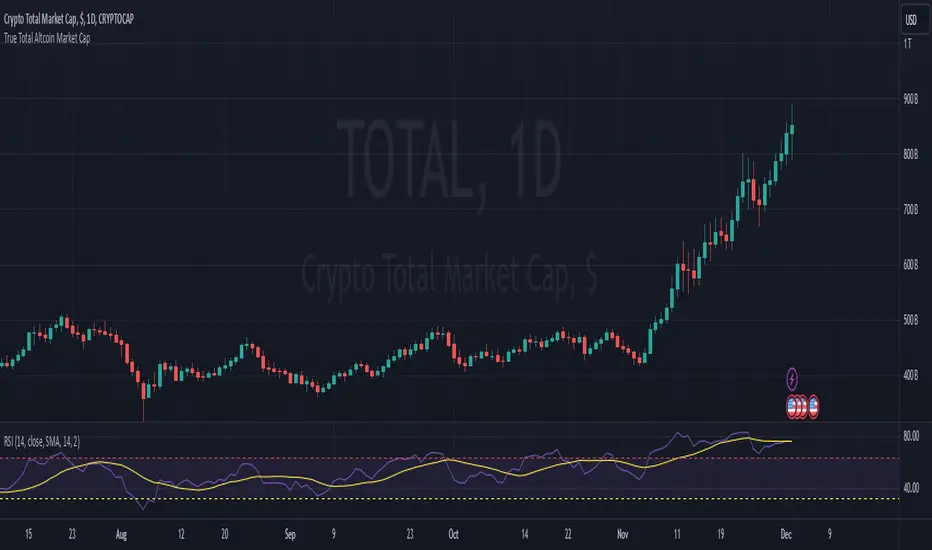
True Total Altcoin Market CapThis indicator calculates the real total altcoin market capitalization by removing Bitcoin, Ethereum, and major stablecoins (USDT, USDC, BUSD, DAI) from the total cryptocurrency market cap. It replaces the standard price bars with custom-colored candlesticks showing the true altcoin market movements.
Features:
Excludes BTC, ETH, and major stablecoins for accurate altcoin market analysis
Custom color scheme: Green (#26a79b) for bullish and Red (#ef5351) for bearish candles
Based on CRYPTOCAP:TOTAL data
Helps traders focus on pure altcoin market trends
Non-repainting, using standard OHLC data
This tool provides a clearer view of altcoin market strength by filtering out the influence of major cryptocurrencies and stablecoins.