Circular Candlestick ChartAn original (but impractical) way to represent a candlestick chart using circles arc.
The most recent candles are further away from the circle origin. Note that OHLC values follow a clockwise direction. A higher arc length would indicate candles with a higher body or wick range.
The Length settings determine the number of past candles to be included in the circular candlestick chart. The Width setting control the width of the circular chart. The Spacing setting controls the space between each arcs. Finally, the Precision settings allow obtaining a more precise representation of candles, with lower values returning more precise results, however, more precision requires a higher amount of lines. Settings are quite hard to adjust, using a higher length might require a lower spacing value.
Additionally, the script includes two pointers indicating the location of the 75 (in blue) and 25 (in orange) percentiles. This allows obtaining an estimate of the current market sentiment, with the most recent arcs laying closer to the 75 percentile pointer indicating an up-trend.
This new way to represent candlesticks might be useful to more easily identify candles clusters or to find new price patterns. Who knows, we know that new ways to see prices always stimulate traders imagination.
See you next year.
Search in scripts for "OHLC"

MILK (My Intraday Lazy Kit)I made this script to group information considered useful in forex day trading, of course it can be used on crypto or other markets.
First of all, feel free to suggest any improvement/new feature you would consider interesting for such an use. This is not especially a final version and I'm sure other relevant information can be added in this tool.
Current features are the following
An international clock showing time and session status (open/closed) for 5 different cities. You can modify it in parameters.
Drawings of previous days/weeks open/high/low/close prices, which will be often used as supports and resistances zones.
The Clock shows
City
Time (with a bgcolor corresponding to the "period" of the day (Morning, Afternoon, Evening, Night)
Session status (Cyan when the corresponding session is open, blue when it's closed)
Price levels names are
YTD-H : Yesterday's high
YTD-L : Yesterday's low
YTD-C : Yesterday's close
YTD-O : Yesterday's open
PWH : Previous week high
PWL : Previous week low
PWO : Previous week open
PWC : Previous week close
Levels width and colors can be modified.
You can also enable/disable the clock, and daily or weekly levels in the options panel.
Nothing more to say for now, I mainly integrated information I like to have, but I'll probably add new features in it if I get some.

Dynamic Fibonacci Pivot Points & EMA CrossoversI have created this script for those who face difficulties drawing Fibonacci levels as this script is Dynamic so it automatically calculates the ranges based on current High and Lows. I have also added Standard Fibonacci Pivot Points so that we can easily see the confluences between Dynamic and Standard pivot points. Apart from this I have also added EMA Crossovers so that we can easily identify trend changes. You can modify this script as per your own.

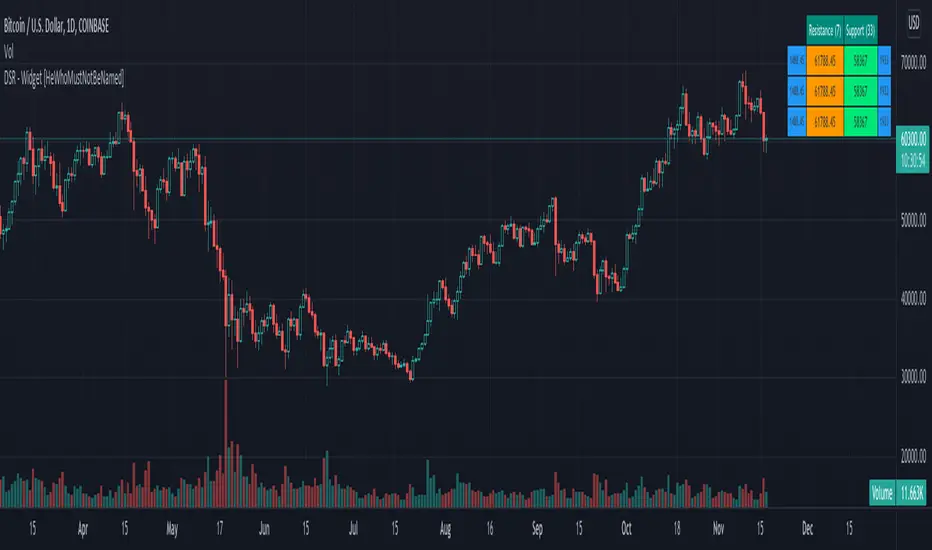
Divergence-Support/Resistance - Widget [HeWhoMustNotBeNamed]Unique live widget which provides information about support and resistance along with distance to immediate levels.
⬜ Custom Candle Source
Three options of candles available
▶ Regular OHLC candles
▶ Heikin-Ashi candles ( Taken leaf out of @Bjorgum's book - but, still could not do it as good as him :) )
▶ Moving average candles
⬜ Multiple zigzags and choice of oscillator
Like any other zigzag based indicator, I prefer using 4 zigzag levels.
And select oscillator of your choice to identify divergence. Oscillator lengths are automatically calculated based on zigzag lengths. You can also chose external oscillator.
⬜ Support and resistance widget settings
▶ Max S/R per zigzag - this is the number of last S/R levels recorded for each zigzag
▶ Max S/R for stats - even though there can be many number of S/R levels, we cannot show all of them in the widget due to space constraint. Hence, this is set to minimal value of 3. Can be changed via this input.
▶ Max S/R for Alerts - When sending stats through alerts, users can decide how many immediate S/R levels to be sent in them.
▶ Alert Choices - Can chose to get alerts when new S/R levels formed and also when existing S/R levels broken.
Personally think it is a very handy widget to have!!
Higher Time Frame Chart OverlayHello All,
This script gets OHLC values from any security and Higher/Same time frame you set, then creates the chart including last 10 candles. it shows Symbol name, Time Frame, Highest/Lowest level of last 10 candles and Close Price at the right side of the chart as well. Closing price text color changes by the real-time candle of the related symbol and time frame. The all this was made using the Tables in Pine and the chart location doesn't change even if you change the size of main chart window.
Almost everything can be change as you want. You can change/set:
- Colors of Body and Top/Bottom Wicks separately
- The Height of each Cell
- The Width of Body and Wicks
- The Background and Frame color
- Enable/disable Status Panel (if you disable Status Panel then only candle chart is shown)
- Location of Status Panel
- Text color and Text size
- The Background color of Status Panel
Some examples:
The info shown in Status Panel:
You can change The Height of each Cell and The Width of Body and Wicks
You can change colors:
You can change location of the chart:
If you add the script more than once then you can see the charts for different symbols and time frames: (This may slow down your chart)
If you right-click on the script and choose "Visual Order" => "Bring to front" then it will be better visually:
P.S. Using this script may slow down your chart, especially if you add it more than once
Enjoy!

Aphrodite// v4
// continuation of prime number checker with strat commands and normal distribution theory put in
//pump/dump trend following strategy idea added.
//Pseudo Random Number Generator Box Muller Normal Distribution Method - code from Function - Functions to generate Random values by RicardoSantos. Dots are calculated by an adaptation of the ideas
//in this script.
// volume accumulates when dots are green for buys, red for sells. This setup is just looking for buys but this is very easy to change
//just go to trading day and swap all strategy.long commands for strategy.short commands
// Exits on minutes where OHLC all return 'primeness'
//Reinforced dots (with black) when last three dots are all of same colour

MarketGod for Tradingview(strategy)Fully Open Source Tv Market God Strategy. Good Luck
Strategy Description
MarketGod can be applied to any market, with any time-frame associated to it. The signals relay the alert at the close of the period, and the painted alert is then available to users to see on the chart or even set notifications for via tradingview's alert system. We recommend that users implement marketgod on their preferred time frames for trading, which for us is the 1h, 4h, 6h, 1D and above TFs.
MarketGod Versioning
The versions included with this release are the following
MarketGod v1
MarketGod v2
MarketGod v3
MarketGod v4
MarketGod v5
MarketGod v6
MarketGod v7
MarketGod v8
MarketGodx²
Ichimoku God
Suggested Uses
• MarketGod will inevitably produce false positives. We've taken steps to reduce this but we highly suggest you add this as a component of your strategy, not an end all be all
• That said, please do not feel the need to fire a trade based solely on a marketgod signal, or to every signal it fires.
• MarketGod users should backtest their strategy using OHLC candles for best results
• Heikin Ashi candles were recomended in the past, and we have eliminated the need for them, meaning that traditional candlestick inputs will yield the highest results.
• MarketGod will always give stronger alerts on higher TF's. If the 1-Day has fired a given signal and the 30 min or similar fire the opposite signal, know that the overall trend is still likely downward. Same concept applies to all timeframes on this tool.
Adjusting the Filter Settings
This tool has a noise filter for users to adjust.
The filter is a percentage based calculation, between significant points in time. The filter ranges between .5 and 25, with .5 increments
• For lower TFs ( IE Intraday), keep the filter set between .5-5
• Mid-TFs (4H,6H,12H,1D), the recommended range is between 5.5-10
• Higher TFs (3D and Higher), look for approx 11-20 range
Customizations
Customize the indicator by adjusting the colors in the style pane. Additionally, users can change the plots into labels with the price of close added to them, or a few other label text options, listed in the 'inputs' panel, below the filter adjustments. Users can also opt to turn the strategy orders as well, as this version will have them printed.
Strategy Performance Interpretation
Its important to understand the only metric that should be relevant is not the win %, as many may initially think. Alternatively, the only metric that matters in the end is your take home profit... meaning the profit one fees and taxes are accounted for. In our example here, the % brought back since the beginning of our window of 2018 is around 47% for $10,000 initial capital and 10% traded per position. Many are ignorant to the take home profit aspect as they focus solely on the winning %, which is ultimately incorrect approach to trading as a whole. as long as we maintain +30% (our goal minimum), the outcome being in the green, is our goal.

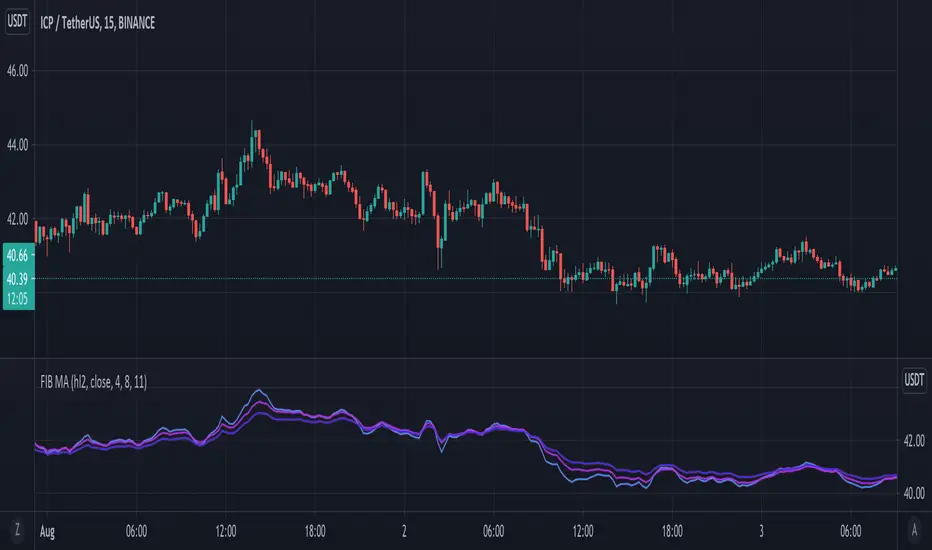
Fibonacci Moving AverageSimple idea from an article I read online I decided to code:
Take EMA's for periods based on the fibonacci sequence - 3, 5, 8, 13, 21, 34, 55 etc. and average them into one MA - the result is the Fibonacci MA (FMA)
Therefore - note the FMA does not use Length - but Range/Interval of how many steps of the Fibonacci Sequence to include.
Seems to be good for finding support/resistance for the price - so added some extra features:
Using up to 3 in at different periods - when they stretch apart it means price is very deviated and will reverse.
Added a price OHLC line if you want to move the indicator to a sub-panel for nice visualisation.
I believe you could look at the 4, 8 and 10, where the longest MA (10,11 FMA) indicates overall bull or bear trend (whether on top or bottom) and you could probably code in alerts for price crossing up or crossing down on the faster (4 FMA)
VWMA Donchian ChannelsPlots Donchian Channel based on VWMA. Trend strength analysis tool.
Note that the VWMA is based on the ohlc not the close.
Strong trends will break out of this channel consolidation will remain inside of the channel. The Channel Midline may be a good bull bear indicator.
As with most trend indicators longer timeframes for the market you are trading will be best. But this can work on all chart time frames

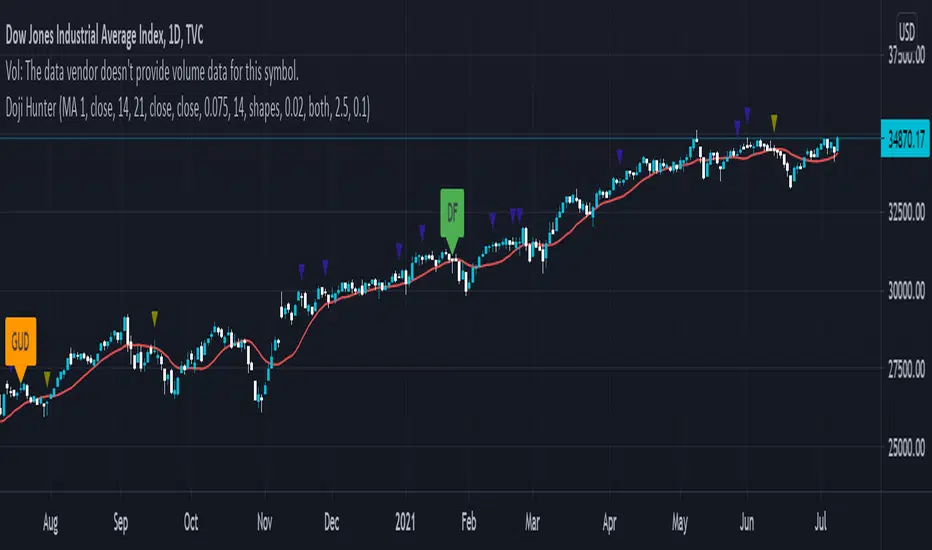
Doji Hunter█ OVERVIEW
This script is built to search for 8 different Doji candlestick patterns in markets and makes them appear on screen with bar coloring and creating color-coded labels/shapes. It will identify the following variants based upon user input for various rules to abide by:
Gapping Up
Gapping Down
Gravestone
Dragonfly
Long-Legged
Rickshaw Man
Northern (Doji in uptrend)
Southern (Doji in downtrend)
Note: for the remainder of this description, the types for inputs will be marked by italic text.
█ OPTIONS
This script features a wide range of options available to the user to modify how it functions. The first set of inputs dictate how the trend analysis is done with moving averages. The second and third sets of inputs dictate specific rules for how Doji candles are analyzed and the colors used for when they appear.
█ INPUTS (short)
1 — Moving Average Rules:
The Northern and Southern Doji variants require some trend analysis which will be done by Moving Averages. The inputs in this section change various things about the moving average(s) to be used. In the second section of inputs, there is one boolean option that will nullify the need for trend detection and consolidates the Northern and Southern Doji variants into one.
2/3 — Doji Rules and Colors:
The next two sections of inputs correspond to the various rules that dictate how various doji variants will be analyzed, as well as the colors that correspond to each variant. The colors will also apply to each of the labels/shapes used.
4 — Diagnostics:
The last boolean will allow the user to see extra detail with regards to how and when dojis are detected. Note: This is not a part of any prior section and is simply included as a last functional item to the list of all inputs.
An example of multiple labels being shown on screen for various types of Dojis (DJI 1D chart):
█ INPUTS (extended)
1 — Moving Average Rules:
This section consists of 10 different inputs specific to the rules on how the moving average functions for trend analysis.
"Trend Rule" ( string list) determines which Moving Average will be used for trend detection. It has 3 options: "MA 1", "MA 2", or "BOTH". The second input "Trend Source" determines which OHLC (or combination) value to use in comparison to either MA 1 or MA 2 (EX: Trend Rule -> "MA 1" and Trend Source -> "close": if close > MA 1 -> uptrend, downtrend otherwise). If "BOTH" is selected then "Trend Source" is ignored and added nuance in the script ensures that the shorter MA being above the longer MA yields an uptrend (downtrend otherwise).
The next 8 inputs focus on 4 different parts of both MA 1 and 2.
Length ( integer(s) )
Color
Switch between SMA/EMA ( boolean(s) )
Source for MA
Note: Additional attention to detail has been made here as trend direction is ignored if "BOTH" is selected for the MA Rules and the lengths of both Moving Averages are set to be the same.
2/3 — Doji Rules and Colors:
The next two sections include 19 inputs that are related to how this script will analyze and identify the different variants of Doji candles.
"Identify Pattern On Close" ( boolean ) modifies which candles are to be used for determining when Doji candles are recognized. This changes an offset used for historical reference on some global variables which will force the script to only identify patterns after the current candle has closed.
"Doji Body Tolerance" ( float ) tells the script the maximum % the candle body may be of the high-low range to be considered a Doji candle.
"Doji Wick Sample" ( integer ) defines how many prior candles to sample from in calculating the current average upper and lower wick sizes.
"Simplify Northern/Southern Dojis" ( boolean ) makes this script ignore trend direction for Doji detection and consolidates Northern and Southern Dojis into being recognized as the same. This has an added effect of removing the plotted moving averages from the screen.
"Northern/Southern Display" ( string list ) that has multiple options for how Northern and Southern Dojis will be displayed on screen. Because of how labels may be extremely taxing on TradingView's servers to display, the default setting is "shapes" where Northern and Southern (N/S) Dojis will be marked with a colored triangle at the top of the candle. If "Simplify Northern/Southern Dojis" is true, all N/S Dojis will be marked with an x-cross instead. Other options include "labels" which enables the use of labels accompanied by their respective tooltip and color, or "none" where N/S Dojis will be only noticeable by their changed barcolor.
"Allow Gravestone/Dragonfly Shadows" ( boolean ) allows a bit of additional nuance to the definition of Gravestone or Dragonfly Dojis with small shadows.
"Gravestone/Dragonfly Shadow Tolerance" ( float ) defines the maximum % that the lower wick/upper wick (respectively) may be relative to the high-low range for Gravestone or Dragonfly Dojis to still be considered valid.
"Doji Long Wick Setting" ( string list) is a list of settings for three different ways of confirming if a Doji is Long-Legged. The settings are "one", "two", and "average". These define how many wick lengths of a candle need to exceed the calculated average wick lengths (EX: "both" -> upper wick length > upper wick average and lower wick length > lower wick average). The "average" setting will combine the lengths of both wicks and both prior wick averages, divide both of these sums by 2 and compare them instead.
"Doji Long Wick Tolerance" ( float ) defines how large compared to the averages that wick lengths need to be in order for them to be considered "Long-Legged" (EX: 1.50 -> upper/lower wick needs to exceed 150% the average of previous upper/lower wicks).
"Rickshaw Man Body Placement Tolerance" ( float ) defines how close to the high-low range's midpoint the candle body's midpoint needs to be in order for it to be considered a Rickshaw Man Doji candle instead.
The remaining 9 inputs define the colors to use for differentiating between all Doji variants this script will recognize.
█ USAGE
My hope for this script is that users find this easy to use/understand and will tinker with the input values to better identify Doji candlesticks across a wide range of markets.
Suggestions for changes in the future are welcome.
Xavier's indicatorThis indicator uses the OHLC (Open-high-low-close) chart data to graph out a oversimplified probability of the trend changing from a bearish one to a bullish trend, indicated when the column is green. This indicator was inspired by ChrisMoody's CM_Williams_Vix_Fix Script, so huge thanks to him, and I also 'borrowed' some of his code for bollinger bands color implementation, so again huge thanks to him. An example on o to use this script would be by looking at when the general color of the columns changes, indicating a possible trend reversal, e.g. from green to gray. This script should not be used on its own, but should instead be added to your strategy as confirmation with other indicators. If you have any questions or suggestions, be sure to leave them in the comments, feedback is always appreciated.

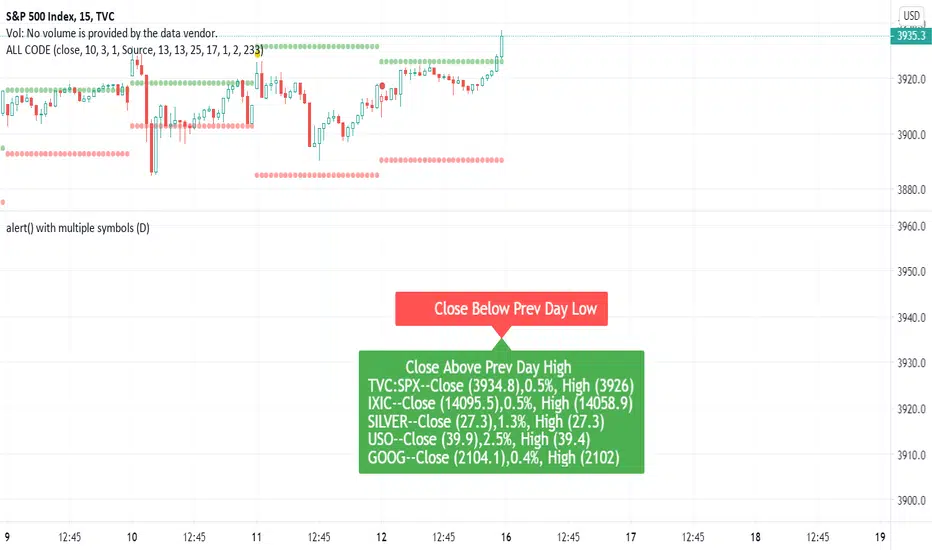
SuperTrend - Custom Screener and Dynamic AlertsTrading View today published a desktop Bad Internet connection indicator ?! which set me thinking…
Despite recently introduced Dynamic Alerts many scripts do not leverage the information available for active traders and traders on the GO!
So decided to share this script totally ALERT focused on one of the most popular DAY trading indicators.
Of course no more BAD internet problem as long your TV APP is configured , you will have enough data for a mental picture of the chart..
The Alerts give you the BAR Close , %percent gain or loss over previous day CLOSE ++ Previous Day High and Low to effectively plan your trade without a chart!(just in case)
2 additions in the way Alerts are delivered over the last script :
1. You get SUMMARY alerts or concatenated alerts by default , however if you uncomment or activate code lines 48 and 55 you will get individual Stock alerts Too!
2. Summary Alerts will come only if there is some Buy or Sell signal NO more empty Alerts!
Few useful EXTRAS in the code :
1. Flexible code can convert any indicator to screener or Alert function.
2. You will NOT get Mutable Variable error while converting any indicator to screener as long as the function is in "GLOBAL" scope..
3. Many Custom Screeners are available but few give OHLC data in output so easily…and very difficult for traders to MODIFY hundreds of lines of code..
4. For UP or DOWN on SCREEN Stock monitoring copy /paste functions in line 41 and 42 in lieu of CROSS functions in 44 and 51 respectively..
5. You can also uncomment/activate lines 66 and 67 for labels in monitoring.
6. The default mode of the scripts is set to Alerts!
Max Stocks only 20!
Finally idea is to help traders to use the great features that TV works so hard to create and constantly improvise.
Enjoy Profitable Trading on the Fly !!

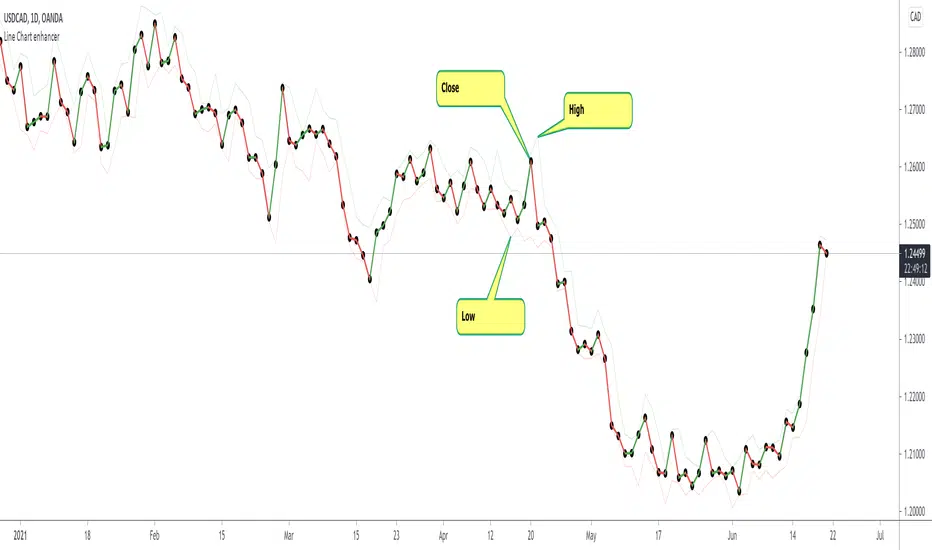
Line Chart Enhancer by makuchakuTradingview has a good line chart, but I wanted to make it even more awesome.
Some shortcomings which this line chart enhancer script fixes
Colors up move as green, down move as red (you can change them as you like)
Plots high and low - so that one can be aware about what the price is doing
To achieve the look with markers as shown above
Goto Symbol settings > Type > Select "With Markers"
Feedback welcome!
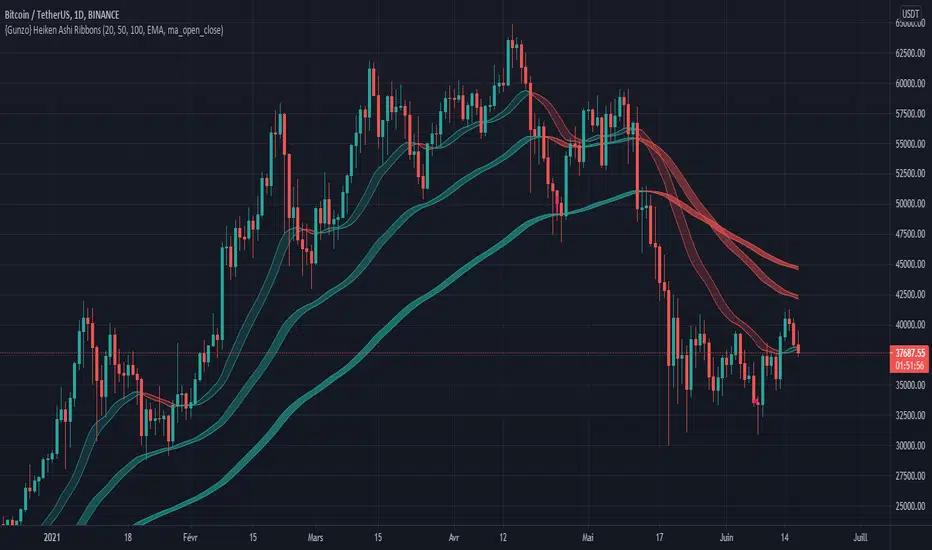
{Gunzo} Heiken Ashi RibbonsHeiken Ashi Ribbons is a trend-following indicator which gives entry and exit points for short-term, medium-term and long term trading (using Exponential Moving Averages and Heiken Ashi formulas).
OVERVIEW :
The Heiken Ashi Ribbons indicator is composed of 3 moving average ribbons (slow, normal and fast) that are computed using the Heiken Ashi formulas. The 3 ribbons give a clear vision of the current trend as they use moving averages that smooth out the price and filter noise from short term fluctuations. In a simplified way, you can consider each ribbon as a moving average with a larger body size.
If the price is above the slow ribbon, we consider the asset as trending up in the short term (trending down otherwise). If the price is above the fast ribbon, we consider the asset as trending up in the long term (trending down otherwise).
CALCULATION :
First of all, to compute a ribbon for this indicator we calculate a moving average (EMA by default) for common sources (OHLC) :
EMA (open), EMA (high), EMA (low), EMA (close)
We then apply the Heiken Ashi formulas to the moving averages calculated previously.
HA (open) = HA (open) previous + HA (close) previous
HA (close) = ( EMA (open) + EMA (high) + EMA (low) + EMA (close) ) / 4
HA (high) = max( EMA (open), EMA (close), EMA (high) )
HA (low) = min ( EMA (open), EMA (close), EMA (low) )
The ribbon displayed (by default) on the chart is the area between HA (open) and HA (close).
SETTINGS :
1st Moving average length : Length of the slow moving average
2nd Moving average length : Length of the normal moving average
3rd Moving average length : Length of the fast moving average
Moving average method : Moving average calculation method (EMA : Exponential Moving Average, SMA : Simple Moving Average, WMA : Weighted Moving Average)
Ribbon type : standard ribbon uses the area between HA (open) and HA (close). Large ribbon uses the area between HA (low) and HA (high)
Display ribbon as candles : change the type of visualization between area and candles
Display short term buy/sell signals : Display short term buy/sell signals (crosses) when the fast moving average and normal moving average are crossing
Display long term buy/sell signals : Display long buy/sell signals (circles) when the fast moving average and slow moving average are crossing
Display ribbon trending up signals : Display ribbon direction change (triangle up) when the trend of the ribbon changes to trending up
Display ribbon trending down signals : Display ribbon direction change (triangle down) when the trend of the ribbon changes to trending down
VISUALIZATIONS :
This indicator has 2 possible visualizations :
Ribbons : the ribbons can be considered as enhanced moving averages for trading purposes. They represent the area between the Heiken Ashi of the moving average of the open and closing price. The color of the moving average line is green when the ribbon is trending up and red when the ribbon is trending down.
Signals : Various signals can be displayed at the bottom of the chart (Buy/Sell signals, Ribbon direction changes signals).
USAGE :
This indicator can be used in many strategies, just like when you are using multiple moving averages. You should test these strategies and use the one that best fits your trading style.
Strategy based on crossovers :
When the fast ribbon crosses above the normal ribbon, it is a short term buy signal (it is recommended to wait for a confirmation)
When the fast ribbon crosses under the normal ribbon, it is a short term sell signal (it is recommended to wait for a confirmation)
When the fast ribbon crosses above the slow ribbon, it is a long term buy signal
When the fast ribbon crosses over the slow ribbon, it is a long term buy signal
Strategy based on price position :
When the prices closes above the ribbon, it is a buy signal (long term if above slow ribbon, short term if above fast ribbon)
When the prices closes below the ribbon, it is a sell signal (long term if below slow ribbon, short term if below fast ribbon)
Strategy based on price bouncing :
When the price decreases and reaches the green long term ribbon, the price candles may not be able to cross the ribbon. If the price increases, we consider that move as a bounce on the ribbon, which is a buy signal
When the price increases and reaches a red long term ribbon, the price candles may not be able to cross the ribbon. If the price decreases, we consider that move as a bounce on the ribbon, which is a sell signal
Strategy based on ribbon direction :
When the direction of the ribbon changes, the trend of the asset is changing which may lead to a crossover to the next candles if the trend is continuing in that direction (it is recommended to validate the entry points with a second indicator as this strategy may have some false signals).
BTC Health (OHLC and TEMA)The "health" (ie, price trend) of Bitcoin has a major influence on the whole cryptocurrency market. Therefore, it can be useful to check the price and trend of BTC prior to entering a new position. This indicator displays BTC candles plus a fast & slow TEMA below the primary chart, so you can check how BTC is behaving.
BTC quote is from BINANCE, using the timeframe of the main chart. TEMA periods can be customized.

Example - HTF Step InterpolationAbout this script:
This example aims to highlight an alternative way to view HTF data by providing basic interpolation functionality.
This script does not aim to provide use in itself as an indicator or strategy.
Reason for study:
Educational Purposes Only

Realtime Delta Volume Action [LucF]█ OVERVIEW
This indicator displays on-chart, realtime, delta volume and delta ticks information for each bar. It aims to provide traders who trade price action on small timeframes with volume and tick information gathered as updates come in the chart's feed. It builds its own candles, which are optimized to display volume delta information. It only works in realtime.
█ WARNING
This script is intended for traders who can already profitably trade discretionary on small timeframes. The high cost in fees and the excitement of trading at small timeframes have ruined many newcomers to trading. While trading at small timeframes can work magic for adrenaline junkies in search of thrills rather than profits, I DO NOT recommend it to most traders. Only seasoned discretionary traders able to factor in the relatively high cost of such a trading practice can ever hope to take money out of markets in that type of environment, and I would venture they account for an infinitesimal percentage of traders. If you are a newcomer to trading, AVOID THIS TOOL AT ALL COSTS — unless you are interested in experimenting with the interpretation of volume delta combined with price action. No tool currently available on TradingView provides this type of close monitoring of volume delta information, but if you are not already trading small timeframes profitably, please do not let yourself become convinced that it is the missing piece you needed. Avoid becoming a sucker who only contributes by providing liquidity to markets.
The information calculated by the indicator cannot be saved on charts, nor can it be recalculated from historical bars.
If you refresh the chart or restart the script, the accumulated information will be lost.
█ FEATURES
Key values
The script displays the following key values:
• Above the bar: ticks delta (DT), the total ticks for the bar, the percentage of total ticks that DT represents (DT%)
• Below the bar: volume delta (DV), the total volume for the bar, the percentage of total volume that DV represents (DV%).
Candles
Candles are composed of four components:
1. A top shaped like this: ┴, and a bottom shaped like this: ┬ (picture a normal Japanese candle without a body outline; the values used are the same).
2. The candle bodies are filled with the bull/bear color representing the polarity of DV. The intensity of the body's color is determined by the DV% value.
When DV% is 100, the intensity of the fill is brightest. This plays well in interpreting the body colors, as the smaller, less significant DV% values will produce less vivid colors.
3. The bright-colored borders of the candle bodies occur on "strong bars", i.e., bars meeting the criteria selected in the script's inputs, which you can configure.
4. The POC line is a small horizontal line that appears to the left of the candle. It is the volume-weighted average of all price updates during the bar.
Calculations
This script monitors each realtime update of the chart's feed. It first determines if price has moved up or down since the last update. The polarity of the price change, in turn, determines the polarity of the volume and tick for that specific update. If price does not move between consecutive updates, then the last known polarity is used. Using this method, we can calculate a running volume delta and ticks delta for the bar, which becomes the bar's final delta values when the bar closes (you can inspect values of elapsed realtime bars in the Data Window or the indicator's values). Note that these values will all reset if the script re-executes because of a change in inputs or a chart refresh.
While this method of calculating is not perfect, it is by far the most precise way of calculating volume delta available on TradingView at the moment. Calculating more precise results would require scripts to have access to tick data from any chart timeframe. Charts at seconds timeframes do use exchange/broker ticks when the feeds you are using allow for it, and this indicator will run on them, but tick data is not yet available from higher timeframes. Also, note that the method used in this script is far superior to the intrabar inspection technique used on historical bars in my other "Delta Volume" indicators. This is because volume and ticks delta here are calculated from many more realtime updates than the available intrabars in history. Unfortunately, the calculation method used here cannot be used on historical bars, where intrabar inspection remains, in my opinion, the optimal method.
Inputs
The script's inputs provide many ways to personalize all the components: what is displayed, the colors used to display the information, and the marker conditions. Tooltips provide details for many of the inputs; I leave their exploration to you.
Markers
Markers provide a way for you to identify the points of interest of your choice on the chart. You control the set of conditions that trigger each of the five available markers.
You select conditions by entering, in the field for each marker, the number of each condition you want to include, separated by a comma. The conditions are:
1 — The bar's polarity is up/dn.
2 — `close` rises/falls ("rises" means it is higher than its value on the previous bar).
3 — DV's polarity is +/–.
4 — DV% rises (↕).
5 — POC rises/falls.
6 — The quantity of realtime updates rises (↕).
7 — DV > limit (You specify the limit in the inputs. Since DV can be +/–, DV– must be less than `–limit` for a short marker).
8 — DV% > limit (↕).
9 — DV+ rises for a long marker, DV– falls for a short.
10 — Consecutive DV+/DV– on two bars.
11 — Total volume rises (↕).
12 — DT's polarity is +/–.
13 — DT% rises (↕).
14 — DT+ rises for a long marker, DT– falls for a short.
Conditions showing the (↕) symbol do not have symmetrical states; they act more like filters. If you only include condition 4 in a marker's setup, for example, both long and short markers will trigger on bars where DV% rises. To trigger only long or short markers, you must add a condition providing directional differentiation, such as conditions 1 or 2. Accordingly, you would enter "1,4" or "2,4".
For a marker to trigger, ALL the conditions you specified for it must be met. Long markers appear on the chart as "Mx▲" signs under the values displayed below candles. Short markers display "Mx▼" over the number of updates displayed above candles. The marker's number will replace the "x" in "Mx▲". The script loads with five markers that will not trigger because no conditions are associated with them. To activate markers, you will need to select and enter the set of conditions you require for each one.
Alerts
You can configure alerts on this script. They will trigger whenever one of the configured markers triggers. Alerts do not repaint, so they trigger at the bar's close—which is also when the markers will appear.
█ HOW TO USE IT
As a rule, I do not prescribe expected use of my indicators, as traders have proved to be much more creative than me in using them. Additionally, I tend to think that if you expect detailed recommendations from me to be able to use my indicators, it's a sign you are in a precarious situation and should go back to the drawing board and master the necessary basics that will allow you to explore and decide for yourself if my indicators can be useful to you, and how you will use them. I will make an exception for this thing, as it presents fairly novel information. I will use simple logic to surmise potential uses, as contrary to most of my other indicators, I have NOT used this one to actually trade. Markets have a way of throwing wrenches in our seemingly bullet-proof rationalizing, so drive cautiously and please forgive me if the pointers I share here don't pan out.
The first thing to do is to disable your normal bars. You can do this by clicking on the eye icon that appears when you hover over the symbol's name in the upper-left corner of your chart.
The absolute value and polarity of DV mean little without perspective; that's why I include both total volume for the bar and the percentage that DV represents of that total volume. I interpret a low DV% value as indecision. If you share that opinion, you could, let's say, configure one of the markers on "DV% > 80%", for example (to do so you would enter "8" in the condition field of any marker, and "80" in the limit field for condition 8, below the marker conditions).
I also like to analyze price action on the bar with DV%. Small DV% values should often produce small candle bodies. If a small DV% value occurs on a bar with much movement and high volume, I'm thinking "tough battle with potential explosive power when one side wins". Conversely, large bodies with high DV% mean that large volume is breaching through multiple levels, or that nobody is suddenly willing to take the other side of a normal volume of trades.
I find the POC lines really interesting. First, they tell us the price point where the most significant action (taking into account both price occurrences AND volume) during the bar occurred. Second, they can be useful when compared against past values. Third, their color helps us in figuring out which ones are the most significant. Unsurprisingly, bunches of orange POCs tend to appear in consolidation zones, in pauses, and before reversals. It may be useful to often focus more on POC progression than on `close` values. This is not to say that OHLC values are not useful; looking, as is customary, for higher highs or lower lows, or for repeated tests of precise levels can of course still be useful. I do like how POCs add another dimension to chart readings.
What should you do with the ticks delta above bars? Old-time ticker tape readers paid attention to the sounds coming from it (the "ticker" moniker actually comes from the sound they made). They knew activity was picking up when the frequency of the "ticks" increased. My thinking is that the total number of ticks will help you in the same way, since increasing updates usually mean growing interest—and thus perhaps price movement, as increasing volatility or volume would lead us to surmise. Ticks delta can help you figure out when proportionally large, random orders come in from traders with other perspectives than the short-term price action you are typically working with when you use this tool. Just as volume delta, ticks delta are one more informational component that can help you confirm convergence when building your opinions on price action.
What are strong bars? They are an attempt to identify significance. They are like a default marker, except that instead of displaying "Mx▲/▼" below/above the bar, the candle's body is outlined in bright bull/bear color when one is detected. Strong bars require a respectable amount of conditions to be met (you can see and re-configure them in the inputs). Think of them as pushes rather than indications of an upcoming, strong and multi-bar move. Pushes do, for sure, often occur at the beginning of strong trends. You will often see a few strong bars occur at 2-3 bar intervals at the beginning or middle of trends. But they also tend to occur at tops/bottoms, which makes their interpretation problematic. Another pattern that you will see quite frequently is a final strong bar in the direction of the trend, followed a few bars later by another strong bar in the reverse direction. My summary analyses seemed to indicate these were perhaps good points where one could make a bet on an early, risky reversal entry.
The last piece of information displayed by the indicator is the color of the candle bodies. Three possible colors are used. Bull/bear is determined by the polarity of DV, but only when the bar's polarity matches that of DV. When it doesn't, the color is the divergence color (orange, by default). Whichever color is used for the body, its intensity is determined by the DV% value. Maximum intensity occurs when DV%=100, so the more significant DV% values generate more noticeable colors. Body colors can be useful when looking to confirm the convergence of other components. The visual effect this creates hopefully makes it easier to detect patterns on the chart.
One obvious methodology that comes to mind to trade with this tool would be to use another indicator like Technical Ratings at a higher timeframe to identify the larger context's trend, and then use this tool to identify entries for short-term trades in that direction.
█ NOTES AND RAMBLINGS
Instant Calculations
This indicator uses instant values calculated on the bar only. No moving averages or calculations involving historical periods are used. The only exception to this rule is in some of the marker conditions like "Two consecutive DV+ values", where information from the previous bar is used.
Trading Small vs Long Timeframes
I never trade discretionary at the 5sec–5min timeframes this indicator was designed to be used with; I trade discretionary at 1D, 1W and 1M timeframes, and let systems trade at smaller timeframes. The higher the timeframe you trade at, the fewer fees you will pay because you trade less and are not churning trading volume, as is inevitable at smaller timeframes. Trading at higher timeframes is also a good way to gain an instant edge on most of the trading crowd that has its nose to the ground and often tends to forget the big picture. It also makes for a much less demanding trading practice, where you have lots of time to research and build your long-term opinions on potential future outcomes. While the future is always uncertain, I believe trades riding on long-term trends have stronger underlying support from the reality outside markets.
To traders who will ask why I publish an indicator designed for small timeframes, let me say that my main purpose here is to showcase what can be done with Pine. I often see comments by coders who are obviously not aware of what Pine is capable of in 2021. Since its humble beginnings seven years ago, Pine has grown and become a serious programming language. TradingView's growing popularity and its ongoing commitment to keep Pine accessible to newcomers to programming is gradually making Pine more and more of a standard in indicator and strategy programming. The technical barriers to entry for traders interested in owning their trading practice by developing their personal tools to trade have never been so low. I am also publishing this script because I value volume delta information, and I present here what I think is an original way of analyzing it.
Performance
The script puts a heavy load on the Pine runtime and the charting engine. After running the script for a while, you will often notice your chart becoming less responsive, and your chart tab can take longer to activate when you go back to it after using other tabs. That is the reason I encourage you to set the number of historical values displayed on bars to the minimum that meets your needs. When your chart becomes less responsive because the script has been running on it for many hours, refreshing the browser tab will restart everything and bring the chart's speed back up. You will then lose the information displayed on elapsed bars.
Neutral Volume
This script represents a departure from the way I have previously calculated volume delta in my scripts. I used the notion of "neutral volume" when inspecting intrabar timeframes, for bars where price did not move. No longer. While this had little impact when using intrabar inspection because the minimum usable timeframe was 1min (where bars with zero movement are relatively infrequent), a more precise way was required to handle realtime updates, where multiple consecutive prices often have the same value. This will usually happen whenever orders are unable to move across the bid/ask levels, either because of slow action or because a large-volume bid/ask level is taking time to breach. In either case, the proper way to calculate the polarity of volume delta for those updates is to use the last known polarity, which is how I calculate now.
The Order Book
Without access to the order book's levels (the depth of market), we are limited to analyzing transactions that come in the TradingView feed for the chart. That does not mean the volume delta information calculated this way is irrelevant; on the contrary, much of the information calculated here is not available in trading consoles supplied by exchanges/brokers. Yet it's important to realize that without access to the order book, you are forfeiting the valuable information that can be gleaned from it. The order book's levels are always in movement, of course, and some of the information they contain is mere posturing, i.e., attempts to influence the behavior of other players in the market by traders/systems who will often remove their orders when price comes near their order levels. Nonetheless, the order book is an essential tool for serious traders operating at intraday timeframes. It can be used to time entries/exits, to explain the causes of particular price movements, to determine optimal stop levels, to get to know the traders/systems you are betting against (they tend to exhibit behavioral patterns only recognizable through the order book), etc. This tool in no way makes the order book less useful; I encourage all intraday traders to become familiar with it and avoid trading without one.

mOCP - volatility metricGauge price action (volatility) of current movements against sma of historical OHCP (open/close) percent_difference.

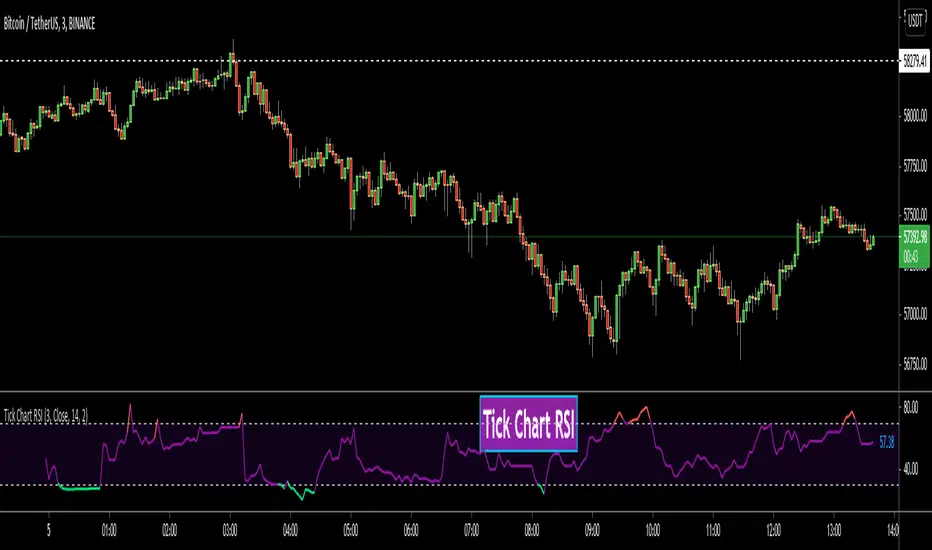
Tick Chart RSIHello All,
This is Tick Chart RSI script and it calculates & shows RSI for Tick Chart. What is Tick chart? Tick Chart is created using ticks and each candlestick in Tick Chart shows the price variation of X consecutive ticks (X : Number of Ticks Per Candle). For example if you set "Number of Ticks Per Candle" = 100 then each candlestick is created using 100 ticks. so, Tick Charts are NOT time-based charts (like Renko or Point & Figure Charts). Tick is the price change in minimum time interval defined in the platform. There are several advantages of Tick Charts. You can find many articles about Tick Charts on the net.
Tick Chart and Tick Chart RSI only work on realtime bars.
You can set " Number of Ticks Per Candle " and the colors. You can also set any of the candles OHLC values as source for RSI.
While using Tick Chart RSI I recommend you to add Tick Chart as well.
P.S. Tick Chart RSI script can be developed using different methods. in this script, all RSI values are calculated on each tick because RSI is calculated for only real-time bars, and also calculated for limited number of bars
Tick Chart and Tick Chart RSI:
Tick Chart RSI:
Enjoy!
Tick ChartHello All,
Tick Chart is created using ticks and each candlestick in Tick Chart shows the price variation of X consecutive ticks ( X : Number of Ticks Per Candle ). for example if you set Number of Ticks Per Candle = 100 then each candlestick is created using 100 ticks. so, Tick Charts are NOT time-based charts (like Renko or Point & Figure Charts). Tick is the price change in minimum time interval defined in the platform. There are several advantages of Tick Charts. You can find many articles about Tick Charts on the net.
Tick Chart only works on realtime bars.
You can set " Number of Ticks Per Candle " and " Number of Candles" using options. You can change color of body, wicks abd volume bars as well.
The script shows current, minimum, maximum and average volumes. it also shows OHLC values on the last candle.
Tick Chart using different number of ticks
Volume info:
Enjoy!

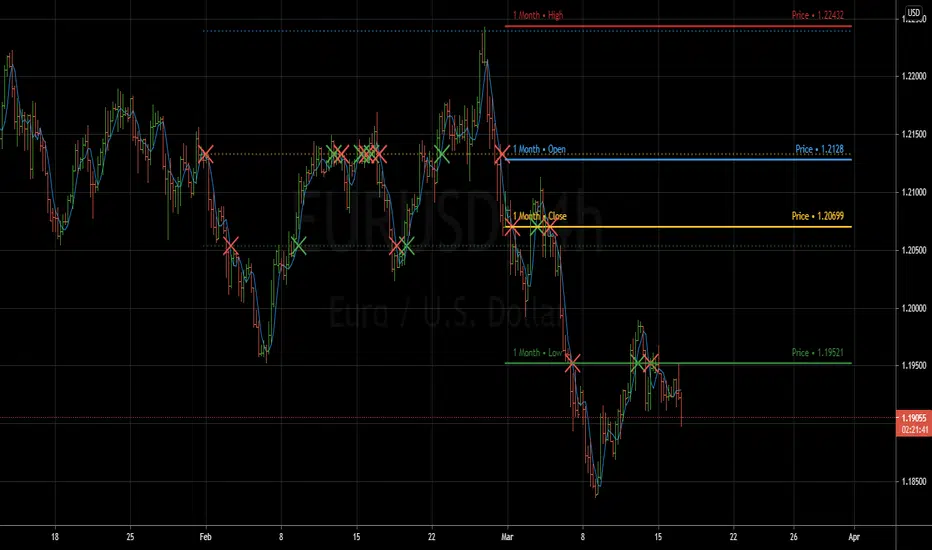
Previous Period Levels - X Alerts====== ABOUT THIS INDICATOR
- A simple but highly customisable display of previous higher time-frame
OHLC values, drawn using line.new and label.new. Nothing fancy but...
- Customised resolution input which excludes time frames lower than 1 hour
while extending the common higher reference inputs to include:
• 6, and 12 Hour
• 5 Day
• 3, and 6 Month
• 1 Year
- Alert conditions using an adjustable SMA to help reduce false positive
spam.
- Full visual customisation options for (almost) every aspect, so it can be
tuned to suit most individual preferences.
- In line with the miriad visual customisation options is the ability to
change the display format of the Labels, to show more or less information,
or disable them altogether.
====== REASON FOR STUDY
- To practice advanced user input option handling to allow for a full visual
customisation experience without stepping outside of, or interfering with,
the intended function of the indicator.
- Provide reasonably clear code commenting and structure in order to be
useful as a potential learning aid for others, and future reference for
myself.
====== DISCLAIMER
Any trade decisions you make are entirely your own responsibility.
I've made an effort to squash all the bugs, but you never know!
NSDT Daily Key LevelsSimple script to show key levels of current day and previous day. Labels can be turned on and off as needed. Line colors, thickness and style can be changed. Modified the "M/W/D Level" script from paaax. Credit for original code goes to him. Link to script and profile posted in code of this script.

Dynamic Messages & Easy Screener1. Dynamic Message alerts with a Screener function
2. labels are generated using array strings making it easier to customize
3. Alert messages have well defined output with data variables
4. Traders with limited Pine knowledge can also plugin their functions
5. Closely track the alerts with Easy Screener
6. Attach it to the desired chart for alert periodicity and set resolution to the indicator setup
7. OHLC values for scanned securities also extracted for ready use in any indicator or study
Happy Trading and rest your sore eyes with Easy Screener!!
Enjoy TV on the GO!