ALMA RSIRelative Strength Index indicator which uses Arnaud Legoux Moving Average inside instead of Wilder's Exponential Moving Average (RMA).
This makes it more reactive and also smoother without less false positive signals. It is much easier to find divergences this way.
Search in scripts for "Relative"

Relative Strength Index with Highlights and Success TestThis script does two things:
1- Highlights extreme levels on RSI
2- Calculates what % of the time, price closed higher (lower) with some minimum threshold when RSI was below oversold (overbought) level in a predefined number of bars.
I use this to understand if buying the dip/selling the rip works for a security and on what time frame and if it could be a profitable strategy that can generate large enough moves.
No guarantees on the accuracy of the code. Let me know if you see anything wrong
Relative Strength Index with HighlightsThis script highlights the indicator background when the RSI exceeds oversold and overbought thresholds making it easier to spot them.
Good for strategies that rely on extreme RSI readings

Relative Strength Index With EMA and Control ZonesThought this could be helpful since I couldnt find an RSI with an ema and Browns theory using control zones. Hope you all enjoy!
RSI with StochRSI CrossesRelative strength index plotted with arrow up/down to indicate StochRSI crossovers.
Relative Strength Index (Log/Divs/MTF/EMA)RSI calculated for log scale, with divergences labeled, as well as a 1 hour 55 EMA for signal.
Original log-space RSI by fskrypt.
Divergences taken from JustUncleL, originally from RicardoSantos.

Relative Strength Index + MFI breachI allowed myself to take a piece of code of one of the indicators MFI present on Tradingview for the added to a RSI!
I made this srcipt to avoid cluttering the screen, so we can see the oversold / overbought of the MFI without having any additional indicator

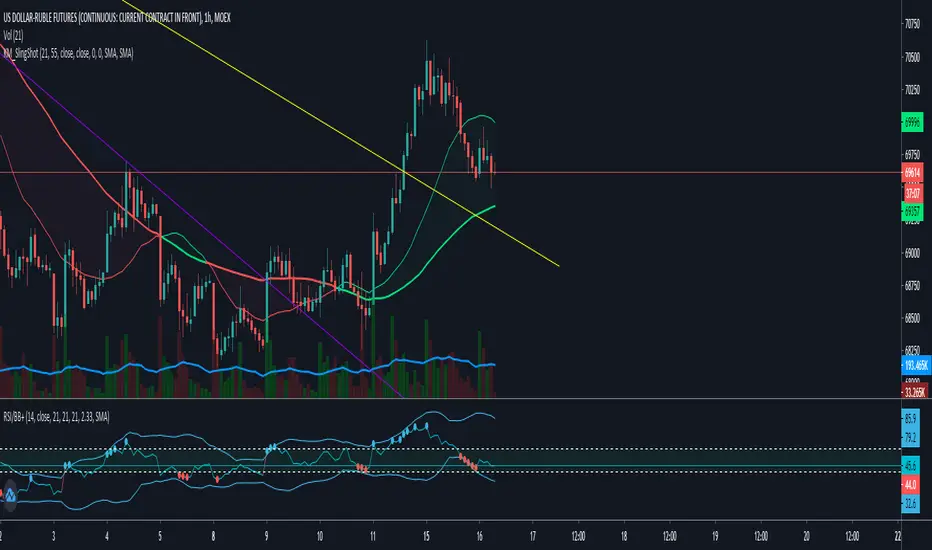
RSI+ with Bollinger BandsRelative Strenght Index + SMA on RSI + Bollinger Bands on it - very good solution to see reversals and see lows and highs.
Use different timeframe.
StdDev is 2.17 by default to get 97% probability.
RSI + SMA с наложенными Bollinger Bands - прекрасное решение для поиска разворотных точек и аномального поведения цены.
Используйте разные таймфреймы одновременно.
StdDev = 2.17 по умолчанию для обеспечения попадания в диапазон в 97% случаев.
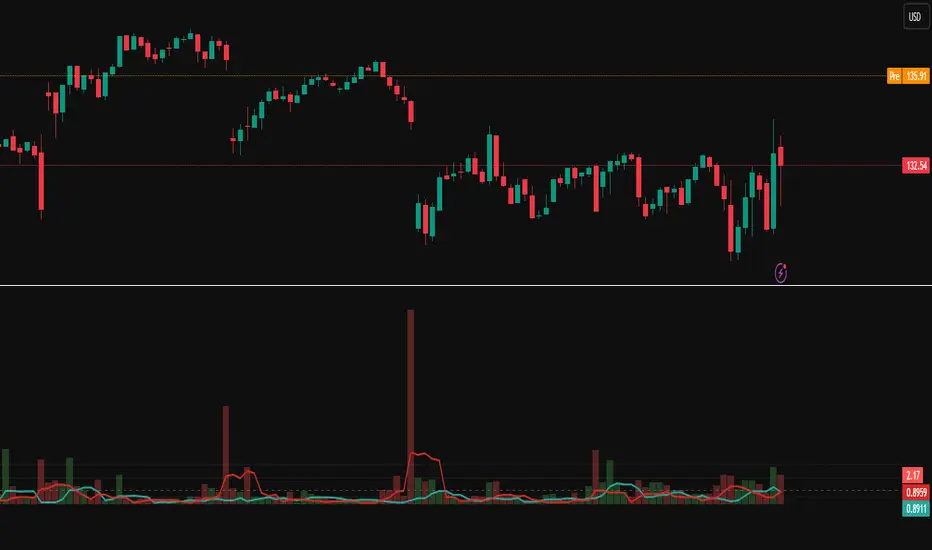
Relative Directional Volume Indicator# Relative Directional Volume Indicator (RelDirVol)
## Overview
The Relative Directional Volume Indicator (RelDirVol) is a powerful volume analysis tool that measures current trading volume relative to historical volume while differentiating between bullish and bearish volume flows. This indicator helps traders identify unusual volume activity and determine whether it's coming from buyers or sellers, providing deeper insights into market participation and potential trend strength.
## Features
- **Relative Volume Calculation**: Compares current volume to historical averages
- **Directional Volume Analysis**: Separates and visualizes bullish vs bearish volume
- **Multiple Moving Average Options**: Customize smoothing with various MA types (SMA, EMA, WMA, HMA, VWMA)
- **Split Moving Averages**: View distinct moving averages for bullish and bearish volume flows
- **Reference Lines**: Visual guides for normal volume (1.0x) and key deviation levels (0.5x, 2.0x, 3.0x)
- **Customizable Colors**: Adjust visual appearance for improved chart readability
## How It Works
The indicator calculates the relative volume by dividing the current bar's volume by the average volume over a specified lookback period. It then categorizes this volume as either bullish (when price closes above the open) or bearish (when price closes below or equal to the open).
1. **Relative Volume**: Current volume ÷ Average volume from previous N bars
2. **Directional Classification**: Assigns volume to bullish or bearish categories based on price action
3. **Moving Averages**: Applies user-selected moving average to smooth the data
The result is displayed as color-coded histogram bars showing the relative volume magnitude, with optional moving average lines for both overall and direction-specific volume trends.
## Interpretation
### Volume Magnitude
- **Above 1.0**: Higher than average volume (more participation than normal)
- **Below 1.0**: Lower than average volume (less participation than normal)
- **2.0+**: Volume twice the normal level (significant participation)
- **3.0+**: Volume three times normal (exceptional participation, often at key events)
### Directional Analysis
- **Strong Green Bars**: Heavy bullish participation driving prices up
- **Strong Red Bars**: Heavy bearish participation driving prices down
- **Bullish MA > Bearish MA**: Overall buying pressure dominating
- **Bearish MA > Bullish MA**: Overall selling pressure dominating
### Key Signals
- **Volume Spikes with Price Breakouts**: Confirms strength of the move
- **Divergence Between MAs**: Early warning of potential shift in market control
- **Sustained Above-Average Volume**: Strong trend continuation likely
- **Volume Decline After Spike**: Potential exhaustion of trend
## Settings
- **Relative Volume Lookback**: Comparison period for average volume (default: 20)
- **Moving Average Type**: Method used for smoothing (default: SMA)
- **Moving Average Length**: Smoothing period (default: 5)
- **Show Moving Average**: Toggle overall volume MA visibility
- **Show Baseline**: Toggle 1.0 reference line visibility
- **Show Bullish/Bearish MAs**: Toggle direction-specific MA visibility
## Best Practices
This indicator performs best when combined with price action analysis and other indicators. Look for:
1. Volume confirmation of breakouts and trend changes
2. Divergence between price movement and volume direction
3. Shifts in the relationship between bullish and bearish MAs
4. Unusual volume patterns during consolidation phases
Particularly effective for swing trading, day trading, and identifying institutional participation in market moves across multiple timeframes.
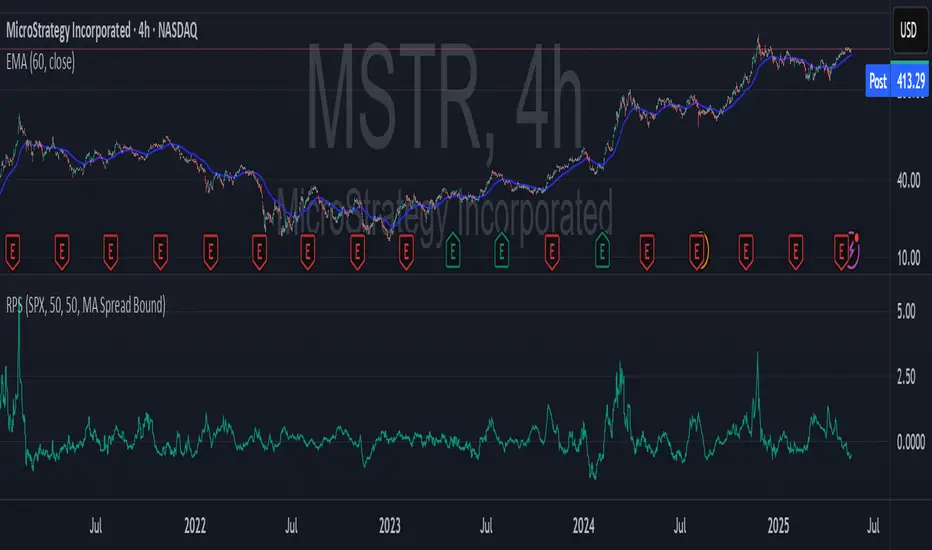
Relative Strength vs S&P 500 (SPX/ES) Relative Strength vs S&P 500
This indicator measures the relative performance of an asset compared to the S&P 500, helping traders and investors identify whether an asset is outperforming or underperforming the broader market.
The calculation is based on a price ratio between the selected asset and the S&P 500, optionally normalized to a base value (100) for easier interpretation.
How to read it:
Above the baseline (100) → the asset is outperforming the S&P 500
Below the baseline (100) → the asset is underperforming the S&P 500
Rising line → strengthening relative performance
Falling line → weakening relative performance
Why it’s useful:
Helps focus on market leaders, not just assets that “look cheap”
Filters trades and investments in the direction of relative strength
Useful for swing trading, long-term investing, and portfolio allocation
Widely used in institutional and professional asset management
This indicator is best used as a trend and selection filter, in combination with technical setups (support/resistance, VWAP, structure).

Benchmark Relative Performance BRPBenchmark Relative Performance (BRP) is a comprehensive technical analysis tool that compares any stock's performance against a chosen benchmark (QQQ, SPY, IWM, etc.) to identify outperformance and underperformance patterns.
Key Features:
Dual-line visualization: Shows both ticker and relative strength performance
Dynamic color coding: 5-level color system indicating performance strength
Customizable benchmark: Choose from any ticker via TradingView's symbol picker
Volume weighting: Optional volume analysis for stronger signal confirmation
Performance zones: Visual thresholds for strong/moderate performance levels
Compact info table: Real-time performance status and values
What It Shows:
Benchmark Performance Line (Blue): Shows your chosen benchmark's percentage performance
Relative Strength Line (Color-coded): Shows how much the ticker outperforms/underperforms
Fill Area: Visual gap between ticker and benchmark performance
Performance Zones: Dotted lines marking significant performance thresholds
Color System:
Green: Strong outperformance (above custom threshold)
Lime: Standard outperformance
Yellow: Neutral/Equal performance
Orange: Standard underperformance
Red: Strong underperformance (below custom threshold)
Best Used For:
Stock selection and rotation strategies
Sector/ETF relative strength analysis
Identifying momentum shifts vs benchmarks
Portfolio performance evaluation
Market timing based on relative performance
Settings:
Customizable lookback period (default: 20)
Adjustable strong performance threshold (default: 5%)
Optional volume weighting factor
Full table customization (position, colors, fonts)
Performance display (percentage or decimal)
Perfect for traders and investors who want to identify stocks showing relative strength or weakness compared to major market benchmarks.

Relative Historical Volatility MCMRelative Historical Volatility
Historical Volatility is relative to it's doubled lookback period of the historical volatility to calculate relative historical volatility.
Including a standard deviation to calculate the volatility value itself is useless. It filters out 32% of the most volatile movements of the asset that you are observing.
Example of RHV:
Period of Volatility Value (POVV) : 10
Relative Historical Volatility : POVV / POVV*2
Historical Volatility of past 10 Bars is compared to the historical volatility of the bast 20 bars to show real growth/decrease of volatility relative to the time of the performing asset.
Comparing historical volatility to the current bar includes much more noise, the relative historical volatility can be perceived as a smoothed historical volatility ind.
Marginal notes:
Added standard deviations adjusted to the relative volatility value to predict probable future volatility of the stock.

Relative Strength by MomentradeRelative Strength Indicator (Index Comparison)
This Pine Script indicator displays the Relative Strength (RS) of the selected instrument compared to a benchmark index, primarily designed for Nifty. It measures performance comparison, helping traders identify whether the asset is outperforming or underperforming the index over a chosen period.
A rising Relative Strength line indicates outperformance, while a falling line signals underperformance. This tool is ideal for trend confirmation, stock selection, and strength-based trading, allowing users to focus on strong assets during bullish markets and avoid weak ones. The indicator is fully customizable and can be applied to any index, stock, or timeframe.

Relative Performance Spread**Relative Performance Spread Indicator – Overview**
This indicator compares the **relative performance between two stocks** by normalizing their prices and calculating the **spread**, **area under the curve (AUC)**, or **normalized price ratio**.
### **How It Works**
* **Input**: Select a second stock (`ticker2`) and a moving average window.
* **Normalization**: Each stock is normalized by its own moving average → `norm = close / MA`.
* **Spread**: The difference `spread = norm1 - norm2` reflects which stock is outperforming.
* **AUC**: Cumulative spread over time shows prolonged dominance or underperformance.
* **Bounds**: Bollinger-style bands are drawn around the spread to assess deviation extremes.
### **Usage**
* **Plot Type Options**:
* `"Spread"`: Spot outperformance; crossing bands may signal rotation.
* `"AUC"`: Track long-term relative trend dominance.
* `"Normalized"`: Directly compare scaled price movements.
Use this tool for **pair trading**, **relative momentum**, or **rotation strategies**. It adapts well across assets with different price scales.
Adaptable Relative Momentum Index [ParadoxAlgo]The Adaptable Relative Momentum Index (RMI) by ParadoxAlgo is an advanced momentum-based indicator that builds upon the well-known RSI (Relative Strength Index) concept by introducing a customizable momentum length. This indicator measures price momentum over a specified number of periods and applies a Rolling Moving Average (RMA) to both the positive and negative price changes. The result is a versatile tool that can help traders gauge the strength of a trend, pinpoint overbought/oversold levels, and potentially identify breakout opportunities.
⸻
Smart Configuration Feature
What sets this version of the RMI apart is ParadoxAlgo’s exclusive “Smart Configuration” functionality. Instead of manually adjusting parameters, traders can simply select their Asset Class (e.g., Stocks, Forex, Futures/Indices, Crypto, Commodities) and Trading Style (e.g., Scalping, Day Trading, Swing Trading, Short-Term Investing, Long-Term Investing). Based on these selections, the indicator automatically optimizes its core parameters:
• Length – The period over which the price changes are smoothed.
• Momentum Length – The number of bars used to calculate the price change.
By automating this process, users save time on tedious trial-and-error adjustments, ensuring that the RMI’s settings are tailored to the characteristics of specific markets and personal trading horizons.
⸻
Key Features & Benefits
1. Momentum-Based Insights
• Uses RMA to smooth price movements, helping identify shifts in market momentum more clearly than a basic RSI.
• Enhanced adaptability for a wide range of asset classes and time horizons.
2. Simple Yet Powerful Configuration
• Smart Configuration automatically sets optimal parameter values for each combination of asset class and trading style.
• Eliminates guesswork and manual recalibration when switching between markets or timeframes.
3. Overbought & Oversold Visualization
• Integrated highlight zones mark potential overbought and oversold extremes (default at 80 and 20).
• Optional breakout highlighting draws attention to times when the indicator crosses these key thresholds, helping spot possible entry or exit signals.
4. Intuitive Design & Ease of Use
• Clean plotting and color-coded signal lines make it easy to interpret bullish or bearish shifts in momentum.
• Straightforward dropdown menus keep the interface user-friendly, even for novice traders.
⸻
Practical Applications
• Early Trend Detection: Spot emerging trends when the RMI transitions from oversold to higher levels or vice versa.
• Breakout Confirmation: Confirm potential breakout trades by tracking overbought/oversold breakouts alongside other technical signals.
• Support/Resistance Confluence: Combine RMI signals with horizontal support/resistance levels to reinforce trade decisions.
• Trade Timing: Quickly gauge when momentum could be shifting, helping you time entries and exits more effectively.
⸻
Disclaimer
As with any technical indicator, the Adaptable Relative Momentum Index should be used as part of a broader trading strategy that includes risk management, fundamental analysis, and other forms of technical confirmation. Past performance does not guarantee future results.
⸻
Enjoy using the Adaptable RMI and experience a more streamlined, flexible approach to momentum analysis. Feel free to explore different asset classes and trading styles to discover which configurations resonate best with your unique trading preferences.

Relative Volume (RV)Relative Volume take the volume at a given time of day and compares it to the average volume at that time of day. You can either use the current volume or the cumulative volume in this analysis. You have the option to either see the average and the current volume or a comparative view where you see the percent difference between now and the average.
My implementation of relative volume uses a key-value pair to simplify the process of getting the average volume for the time of day. This reduces the lines of code needed and makes it easier to understand. I have added the normal features you would find in a relative volume indicator with the addition of an average above/below average section for comparing the significance of above/below average moves are. I hope this script is not only useful but educational.
Enjoy

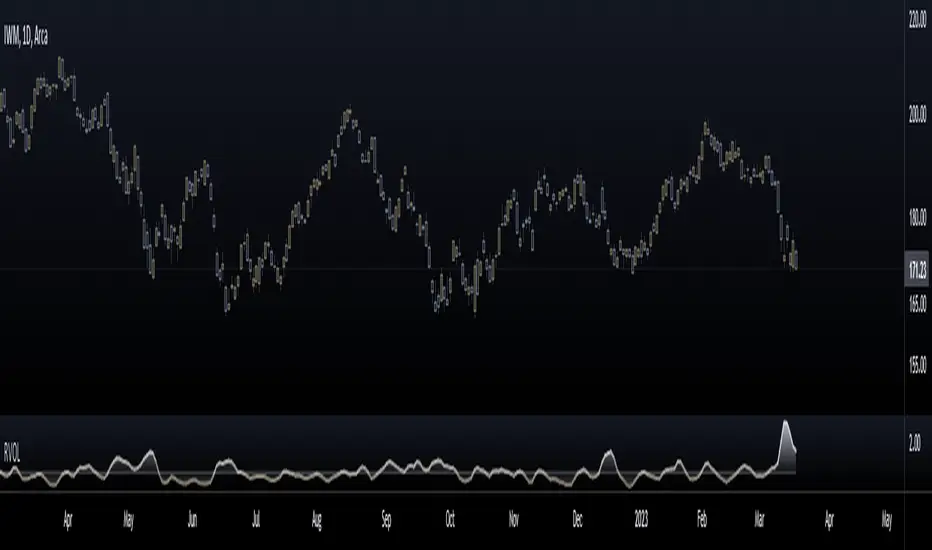
Relative Volume (RVOL)Relative Volume is calculated by taking the ratio of current volume relative to a moving average of your choice. It gives you a quick way to see how much volume is involved in the current movement relative to a recent period.
Features:
-Customizable Moving Average: You can choose the period (default is 21) and type (SMA or EMA)
-Customizable base level: Default setting is 1.
-Smoothing option: Uses a Hull moving average to smooth out the RVOL area plot, by default its turned off.
Enjoy!
Relative Vigour Index (RVI). EhlersRelative Vigor Index - RVI
------------------------------------
An indicator used in technical analysis that measures the conviction of a recent price action and the likelihood that it will continue. The RVI compares the positioning of a security's closing price relative to its price range, and the result is smoothed by calculating an exponential moving average of the values.
The RVI indicator is calculated in a similar fashion to the stochastic oscillator, but the vigor index compares the close relative to the open rather than to the low.
Traders expect the RVI value to grow as the bullish trend gains momentum because in this type of environment, a security's closing price tends to be at the top of the range while the open is near the low of the day.
Usage Example: www.investopedia.com

Relative Volume EMA (RVOL)Relative Volume EMA (RVOL) measures the current bar’s volume relative to its typical volume over a selected lookback period.
It helps traders identify whether a price move is supported by real participation or if it’s occurring on weak, low-quality volume.
This version uses:
RVOL = Current Volume ÷ Volume EMA
Volume EMA Length: adjustable
Signal Threshold: a customizable horizontal line (default = 1.2)
How to Use
1. RVOL > 1.2 → High-Quality Momentum
A value above 1.2 indicates that the current bar has at least 20% more volume than normal, suggesting:
Strong conviction
Algorithmic activity
Momentum-backed breakout or breakdown
Higher probability trend continuation
These bars are ideal for confirming entries after a technical setup (e.g., pullback, engulfing pattern, Ichimoku trend confirmation, etc.).
2. RVOL < 1.0 → Weak or Low-Quality Move
When RVOL is below 1.0:
Volume is below average
Moves are more likely to fail or reverse
Breakouts are unreliable
Triggers lack institutional participation
These bars are best avoided for trade entries.
Why This Indicator Is Useful
In many strategies, price alone is not enough.
RVOL acts as a filter to ensure that your signals occur during times when the market is actually active and committed.
Typical use cases:
Confirm trend-following entries
Validate pullbacks and breakout candles
Filter out low-volume chop
Identify session-based volume surges
Improve risk-to-reward quality by entering only during true momentum
Recommended Settings
EMA Length: 20
Threshold Line: 1.2
Works well on Forex, Crypto, and Indices
Best used on 15m, 30m, 1H, and 4H charts

QG-Relative Strength Rank MTF DSL
Relative strength rank is a momentum indicator based on combination of short and long term strength combined with ATR to adjust for current volatility.
The Multi timeframe version long with signals only above or below +1 and -1 provide quite reliable signals and entries for pullback levels.
The RSR signal has been smoothed with EMA.

Relative Strength with S&P500Relative Strength (RS) - S&P500
Relative Strength with compare to SPX - US S&P 500. This indicator shows Strength compare to SPX.

Relative StrengthRelative Strength show the quotient (ratio) between a numerator (Your Security) and a common denominator (SPX, BTC, ...).
I inspired myself from already established indicators. But I've made my own because I had some issues with others.
Sometimes the moving average weren't fixed but where floating through the window.
Sometimes the colors (Up, Down) were inaccurate because the compiler didn't notice infinitesimal changes (0.0001 > 0.0002)
Thanks.
(The Relative Strength indicator is at the top of the chart.)
