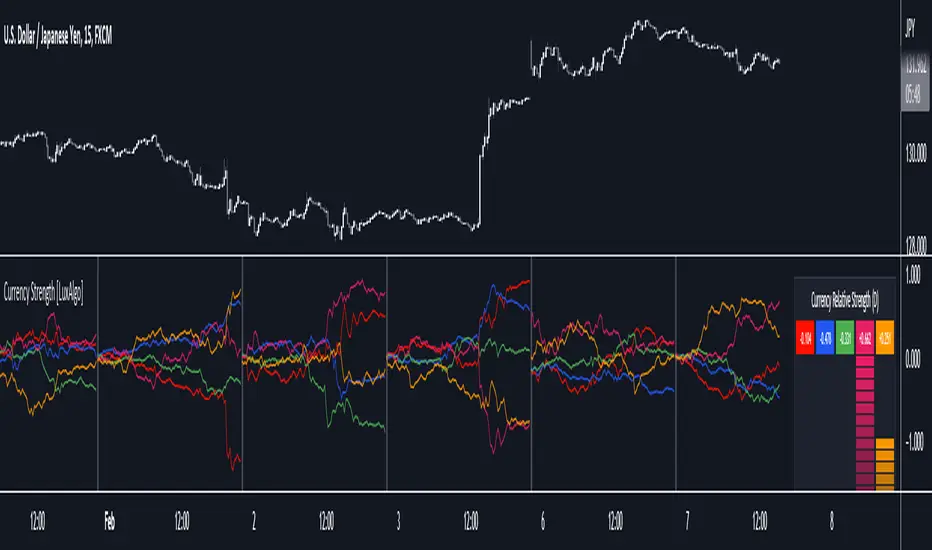
Currency Strength [LuxAlgo]The Currency Strength indicator displays the historical relative strength of 5 user selected currencies over a user selected period of time. Users can also display relative strength of currencies as a scatter plot, further informing on the evolution of currency strength.
🔶 SETTINGS
Display: Determines the type of data displayed by the indicator. By default, the trailing relative strength of currencies is displayed, with the other option displaying the scatter plot.
Timeframe: Timeframe period used to calculate currency relative strength.
🔹 Meter
Show Strength Meter: Displays the currency strength meter on the indicator panel.
Strength Meter Resolution: Resolution of the currency strength meter, higher resolutions allow to observe smaller difference in strength.
Location: Location of the currency strength meter on the indicator pane.
Size: Size of the currency strength meter.
🔹 Relative Strength Scatter Graph
Scatter Graph Resolution: Horizontal and vertical width of the scatter plot (in bars). Higher values allow a more precise position on the X axis.
🔶 USAGE
Measuring the relative strength of a currency allows users to assess the relative performance of a currency against a basket of other currencies.
The term "strength" can convey various interpretations depending on the indicator. Here "strength" is interpreted as an indicator of performance, with stronger currencies having greater performances over the selected period (positive changes of higher magnitude).
The Currency Strength indicator allows users to analyze the relative strength of currencies over a user selected period - the returned results will reset periodically and will accumulate afterward.
The above chart shows the hourly relative strength of various currencies on the 1min TF.
🔹 Scatter Graph
The scatter graph displays the relative strength of a currency over its value during the previous period. This not only allows users to see if a currency is strong... but also if it's getting stronger compared to the previous period.
In order to quickly interpret results, the graph is divided into four areas. A currency (displayed as a point) being in a specific area returns the following information:
Strong(Green): Currency has a positive relative strength (bullish) and is greater than its value over the previous period.
Improving (Yellow): Currency has a negative relative strength (bearish) and is greater than its value over the previous period.
Weakening (Aqua): Currency has a positive relative strength (bullish) and is lower than its value over the previous period.
Weak (Red): Currency has a negative relative strength (bearish) and is lower than its value over the previous period.
🔶 DETAILS
There is a wide variety of methods for the calculation of a currency's relative strength. The primary focus of the indicator is on the meter as well as the relative strength scatter graph. The currency strength calculation can be considered more basic.
Given two currencies, B (base) and Q (quote), the proposed indicator calculation process is as follows:
Exchange rate BQ(t) over time t is obtained, a rising value of BQ(t) means that a unit of B is now worth a higher amount of Q , highlighting strength of B over Q on that precise variation.
The individual relative strength over time IRS(t) is obtained as the percentage relatively close to the open difference of BQ(t) , that is:
IRS(t) = / open(t) * 100
Normalizing the close to open difference allows for the various currencies' relative strengths to approximately share the same scale.
The above operation is performed n times over a space of n currencies O( n ) . The obtained individual relative strengths for one specific currency are then added together, forming the final composite relative strength ( CRS ) of that currency:
CRS (t) = IRS (t) + IRS (t) + ... + IRS (t)
The cumulative sum of CRS(t) over the user selected period is then obtained.
Search in scripts for "Relative"
(JS) Ultimate RSISo my goal here was to combine all of my RSI ideas into a single indicator in order to make kind of a "Swiss Army Knife" version of the Relative Strength Index ...
------------------------------------------------------------------------------------------------------------------------------------------------------------------------------------------------------------------------------------------------------------------
So, let's begin with the first RSI indicator I made, which is the RSIDVW (Divergence/Volume Weighted);
To rephrase my original post, the "divergence/volume weighted" portion is meant to expand upon the current RSI format by adding more variables into the equation.
The standard RSI is based off one value that you select (open, close, OHLC4, HLC3, etc.) while this version takes three variables into account.
The default setting is to have RSI normal without anything added to it (Divergence Weight = 0)
1st - it takes the standard variable that RSI normally uses.
2nd - it factors RSI divergence by taking the RSI change % and price change % to form a ratio. Using this ratio, I duplicated the RSI formula and created a divergence RS to be factored in with the standard price RS .
3rd - it takes Relative Volume and amplifies/weakens the move based upon volume confirmation. (So if Relative Volume for a price bar is 1.0, the RSI plot would be the same as it normally would)
So to explain the parameters
- Relative Volume Length: This uses the RV length you specify to determine spikes in volume (or lack of volume ), which then is added into the formula to influence the strength of the RSI move
- RV x Divergence: This is how I calculated the original formula, but you can leave this unchecked to turn Relative Volume off, or apply elsewhere.
- RV x RS: There's two sides, Divergence RS and Standard RS - these check marks allow you to select which part you prefer to be multiplied by Relative Volume .
Checking neither turns off Relative Volume , while checking both amplifies its effects by placing it on both sides of the equation.
-Divergence Weight: This controls how much the DVW portion of the formula influences the RSI plot. As I referred to earlier, default is 0 making RSI normal. The Scale is 0-2, so 1.0 would be the same as 50%.
When I do have DVW on, I generally set it to 0.5
-SMA Divergence: To smooth, or not to smooth, that is the question. UJsing an SMA here is much smoother in my opinon, but leaving it unchecked runs it through an RMA the same way standard RSI is calculated.
-Show Fractal Channel: This allows you to see the whole fractal channel around the RSI (This portion of the code, compliments of the original Ricardo Santos fractal script)
------------------------------------------------------------------------------------------------------------------------------------------------------------------------------------------------------------------------------------------------------------------
The next portion of the script is adding a "Slow RSI"...
This is rather simple really, it allows you to add a second RSI plot so that you can watch for crossovers between fast and slow lines.
-Slow RSI: This turns on the second RSI Plot.
-Slow RSI Length: This determines the length of the second RSI Plot.
------------------------------------------------------------------------------------------------------------------------------------------------------------------------------------------------------------------------------------------------------------------
Pivot Point RSI was something a friend of mine requested I make which turned out pretty cool, I thought... It is also available in this indicator.
-Pivot Points: Selecting this enables the rest of the pivot point related parts of the script
If Pivot Points isn't selected, none of the following things will work
-Plot Pivot: Plots the pivot point .
-Plot S1/R1: Plots S1/R1.
-Plot S2/R2: Plots S2/R2.
-Plot S3/R3: Plots S3/R3.
-Plot S4/R4: Plots S4/R4.
-Plot S5/R5: Plots S5/R5.
-Plot Halfway Points: Plots a line between each pivot .
-Show Pivot Labels: Shows the proper label for each pivot .
When using intraday charts, from a 15 minute interval or less the pivots are calculated based on a single days worth of price action, above that the distance expands.
Here are the current resolutions Pivot Points will work with:
Minutes - 1 , 2, 3, 5, 10, 13, 15, 20, 30, 39, 78, 130, 195
Hours - 1, 2, 3, 4, 5, 6
Daily
Weekly
Currently not available on seconds or monthly
------------------------------------------------------------------------------------------------------------------------------------------------------------------------------------------------------------------------------------------------------------------
Background Colors
Background Colors: I have six color schemes I created for this which can be toggled here (they can be edited).
Gray Background for Dark Mode: Having this on looks much better when using dark mode on your charts.
------------------------------------------------------------------------------------------------------------------------------------------------------------------------------------------------------------------------------------------------------------------
Now finally the last portion, Fibonacci Levels
-Fibonacci Levels: This is off, by default, which then uses the standard levels on RSI (30-50-70). When turned on, it removes these and marks fib levels from 0.146 through 0.886.
------------------------------------------------------------------------------------------------------------------------------------------------------------------------------------------------------------------------------------------------------------------
So the quick rundown:
Ultimate RSI contains "divergence/volume weighted" modifications, a slow RSI plot, pivot points , and Fibonacci levels all while auto-plotting divergence and having the trend illustrated in the background colors.
RSI has always been my "go to" indicator, so I hope you all enjoy this as much as I do!

Weekly RSI Buy/Sell SignalsWeekly RSI Buy/Sell Signal Indicator
This indicator is designed to help traders identify high-probability buy and sell opportunities on the weekly chart by using the Relative Strength Index (RSI). By utilizing weekly RSI values, this indicator ensures signals align with broader market trends, providing a clearer view of potential price reversals and continuation.
How It Works:
Weekly RSI Calculation: This script calculates the RSI using a 14-period setting, focusing on the weekly timeframe regardless of the user’s current chart view. The weekly RSI is derived using request.security, allowing for consistent signals even on intraday charts.
Signal Conditions:
Buy Signal: A buy signal appears when the RSI crosses above the oversold threshold of 30, suggesting that price may be gaining momentum after a potential bottom.
Sell Signal: A sell signal triggers when the RSI crosses below the overbought threshold of 70, indicating a possible momentum shift downwards.
Visual Cues:
Buy/Sell Markers: Clear green "BUY" and red "SELL" markers are displayed on the chart when buy or sell conditions are met, making it easy to identify entry and exit points.
RSI Line and Thresholds: The weekly RSI value is plotted in real time with color-coded horizontal lines at 30 (oversold) and 70 (overbought), providing a visual reference for key levels.
This indicator is ideal for traders looking for reliable, trend-based signals on higher timeframes and can be a helpful tool for filtering out shorter-term market noise.

RSI Min/Max Tracker - HD AlgoRSI Min/Max Tracker – HD Algo
RSI Min/Max Tracker is a momentum analysis indicator designed to enhance traditional RSI usage by continuously tracking the lowest and highest RSI values reached over the visible chart history. This provides immediate context on whether the current RSI is relatively extended or compressed compared to prior market behavior.
How it works
Calculates the Relative Strength Index (RSI) using a user-defined length and price source.
Dynamically records the minimum and maximum RSI values observed since the indicator started.
Updates these extremes in real time as new bars form.
Visual elements
RSI Line (Blue): The current RSI value.
Lowest RSI (Red): The historical minimum RSI reached.
Highest RSI (Green): The historical maximum RSI reached.
Reference Levels:
70 – Overbought (dashed red)
50 – Midline (dotted gray)
30 – Oversold (dashed green)
Info Table
A compact table in the top-right corner displays:
Current RSI
Lowest recorded RSI
Highest recorded RSI
Use cases
Identify whether RSI is near historical extremes.
Improve overbought/oversold context beyond fixed 30/70 levels.
Support mean-reversion, momentum, and divergence-based strategies.
Best used for
Intraday and swing traders who want a clearer perspective on RSI behavior relative to recent market conditions, rather than relying solely on static thresholds.

RSI & BB QQE Mod (highlight)This script is a combination of the RSI, QQE and BB
Here is an explanation on how I combined them, and how they are used:
- RSI (Relative Strength Index)
- Display a smoothed version of the RSI to identify "oversold" and "overbought" market phases
- Used to calculate a QQE
- QQE (Quantitative Qualitative Estimation)
- Used to identify trend direction and trend strength
- Used to set a basis for the BB
- BB (Bollinger Bands)
- Used with QQE as a basis to determine a relative definition of "high RSI" and "low RSI"
- Used with QQE as a basis to determine the volatility of the RSI at a given moment
- Used to predict pivot points
Here are the main signals:
- When "RSI Smoothed" line above the Upper BB then "RSI Smoothed" line turns green
- Also , display green background color highlight
- Also , and if "RSI Smoothed" is above the overbought line then display a second green background color highlight
- When "RSI Smoothed" line bellow the Lower BB then "RSI Smoothed" line turns red
- Also , display red background color highlight
- Also , and if "RSI Smoothed" is bellow the oversold line then display a second red background color highlight
A tool codded to be aesthetically pleasing and VERY customisable:
- Designed for both light theme and dark theme users
- Value can be easily modified in the settings
- Colors can be easily swapped in the settings
- Opacity of "fill" & "bgcolor" regrouped as a single input
A tool codded to be easy to read and to learn from:
- Sources and inspirations all listed within the script
- Structure easily identifiable (to understand with little to no effort how the script works)
Notes :
- This script is lagging, because of that I do recommend using it on relatively large timeframe
- This script is OpenSource, feel free to reuse it, but if so please remember to include a link to my script in your sources
- This script is not a magical tool, use at your own risk

Quad RSRelative Strength (RS) is an Indicator which measures a Stock's performance as compared to a Benchmark Index or another Stock.
For example: RS will tell you whether “A” is increasing more or less than “B” in any market condition. It is one of the tools which is best suited for Momentum Investing.
How RS can be used as a Momentum Indicator:
RS is used in identifying both the strongest and the weakest stock, or any asset class, within the market. Usually, the stocks which display strong or weak RS over a given time period tend to continue to move in the same direction.
How to calculate Relative Strength:
Divide change of "A" over some time period by the change of a particular index/stock "B" over the same time period.
This indicator oscillates around zero. If the value is greater than zero, "A" has been relatively strong compared to "B", during the selected period; if the value is less than zero, "A" has been relatively weak.
Configuration & Default settings:
The Relative symbol can be Input, default is Nifty50.
Time frame can be set, I recommend setting to Day. Default time frame is set to same as chart.
Four different periods can be set. Default values are 500, 250, 125 & 63. If time frame is set as 'Day', these numbers correspond to 2 years, 1 year, 1/2 year & 1 quarter.
Example chart: NiftyMidCap100 with Quad RS indicator with Nifty50 used as Relative Symbol, Four periods: 500, 250, 125 & 63

Mansfield Relative Strength indicatorUse this indicator to compare how security is performing in compare with preferred index (SPX by default).
> 0 outperforming
< 0 underperforming
Works best for weekly, but can be applied to monthly and daily charts. It will be rather useless to use it in smaller timeframes
Apply it to SPX, industry index, sector index or other security in similar sector

Combined: Net Volume, RSI & ATR# Combined: Net Volume, RSI & ATR Indicator
## Overview
This custom TradingView indicator overlays **Net Volume** and **RSI (Relative Strength Index)** on the same chart panel, with RSI scaled to match the visual range of volume spikes. It also displays **ATR (Average True Range)** values in a table.
## Key Features
### Net Volume
- Calculates buying vs selling pressure by analyzing lower timeframe data
- Displays as a **yellow line** centered around zero
- Automatically selects optimal timeframe or allows manual override
- Shows net buying pressure (positive values) and selling pressure (negative values)
### RSI (Relative Strength Index)
- Traditional 14-period RSI displayed as a **blue line**
- **Overlays directly on the volume chart** - scaled to match volume spike heights
- Includes **70/30 overbought/oversold levels** (shown as dotted red/green lines)
- Adjustable scale factor to fine-tune visual sizing relative to volume
- Optional **smoothing** with multiple moving average types (SMA, EMA, RMA, WMA, VWMA)
- Optional **Bollinger Bands** around RSI smoothing line
- **Divergence detection** - identifies regular bullish/bearish divergences with labels
### ATR (Average True Range)
- Displays current ATR value in a **table at top-right corner**
- Configurable period length (default: 50)
- Multiple smoothing methods: RMA, SMA, EMA, or WMA
- Helps assess current market volatility
## Use Cases
- **Momentum & Volume Confirmation**: See if RSI trends align with net volume flows
- **Divergence Trading**: Automatically spots when price makes new highs/lows but RSI doesn't
- **Volatility Assessment**: Monitor ATR for position sizing and stop-loss placement
- **Overbought/Oversold + Volume**: Identify exhaustion when RSI hits extremes with volume spikes
## Customization
All components can be toggled on/off independently. RSI scale factor allows you to adjust how prominent the RSI line appears relative to volume bars.

Bollinger RSI BandsIndicator Description:
The "Bollinger RSI Bands" is an advanced technical analysis tool designed to empower traders with comprehensive insights into market trends, reversals, and overbought/oversold conditions. This multifaceted indicator combines the unique features of candle coloration and Bollinger Bands with the Relative Strength Index (RSI), making it an indispensable tool for traders seeking to optimize their trading strategies.
Purpose:
The primary purpose of the "Bollinger RSI Bands" indicator is to provide traders with a holistic view of market dynamics by offering the following key functionalities:
Candle Coloration: The indicator's signature candle colors - green for bullish and red for bearish - serve as a visual representation of the prevailing market trend, enabling traders to quickly identify and confirm market direction.
RSI-Based Moving Average: A smoothed RSI-based moving average is plotted, facilitating the detection of trend changes and potential reversal points with greater clarity.
RSI Bands: Upper and lower RSI bands, set at 70 and 30, respectively, help traders pinpoint overbought and oversold conditions, aiding in timely entry and exit decisions.
Bollinger Bands: In addition to RSI bands, Bollinger Bands are overlaid on the RSI-based moving average, offering insights into price volatility and highlighting potential breakout opportunities.
How to Use:
To maximize the utility of the "Bollinger RSI Bands" indicator, traders can follow these essential steps:
Candle Color Confirmation: Assess the color of the candles. Green candles signify a bullish trend, while red candles indicate a bearish trend, providing a clear and intuitive visual confirmation of market direction.
Overbought and Oversold Identification: Monitor price levels relative to the upper RSI band (70) for potential overbought signals and below the lower RSI band (30) for potential oversold signals, allowing for timely adjustments to trading positions.
Trend Reversal Recognition: Observe changes in the direction of the RSI-based moving average. A transition from bearish to bullish, or vice versa, can serve as a valuable signal for potential trend reversals.
Volatility and Breakout Opportunities: Keep a watchful eye on the Bollinger Bands. Expanding bands signify increased price volatility, often signaling forthcoming breakout opportunities.
Why Use It:
The "Bollinger RSI Bands" indicator offers traders several compelling reasons to incorporate it into their trading strategies:
Clear Trend Confirmation: The indicator's distinct candle colors provide traders with immediate confirmation of the current trend direction, simplifying trend-following strategies.
Precise Entry and Exit Points: By identifying overbought and oversold conditions, traders can make more precise entries and exits, optimizing their risk-reward ratios.
Timely Trend Reversal Signals: Recognizing shifts in the RSI-based moving average direction allows traders to anticipate potential trend reversals and adapt their strategies accordingly.
Volatility Insights: Bollinger Bands offer valuable insights into price volatility, aiding in the identification of potential breakout opportunities.
User-Friendly and Versatile: Despite its advanced features, the indicator remains user-friendly and versatile, catering to traders of all experience levels.
In summary, the "Bollinger RSI Bands" indicator is an indispensable tool for traders seeking a comprehensive view of market dynamics. With its unique combination of candle coloration and Bollinger Bands, it empowers traders to make more informed and strategic trading decisions, ultimately enhancing their trading outcomes.
Note: Always utilize this indicator in conjunction with other technical and fundamental analysis tools and exercise prudence in your trading decisions. Past performance is not indicative of future results.

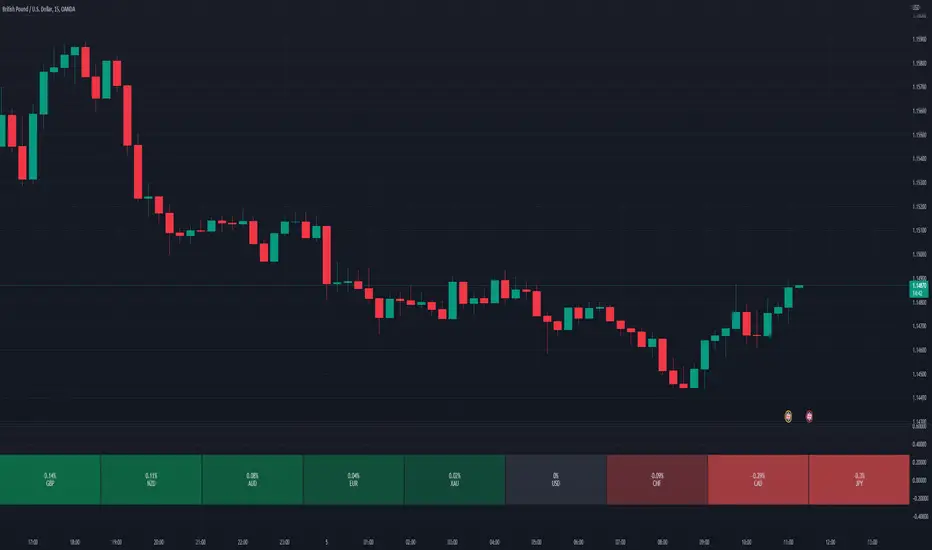
Relative Perfomance IndexHello Traders.
Lets keep it simple..
1. Take the major pairs that have USD in them and watch their change over a specific timeframe.
2. Now lets sort these changes of each pair from the most positive to the most negative.
Good, I see you have some ideas already.
This is exactly what this indicator does. You will visualize the biggest change in pairs of the timeframe of your choice and from this you can decide on pairs that you want to trade.
Accumulation/Distribution Percentage (ADP) [Cyrus c|:D]Accumulation/Distribution Percentage ( ADP ) is used to measure money flow similar to Chaikin Money Flow ( CMF ) and Money Flow. It is the range-bound version of my previous indicator ADMF. This indicator can be used for analyzing momentum, buy/sell pressure, and overbought/oversold conditions. I believe that this indicator is more accurate than CMF and MFI (I will publish a TA about it one day!).
What to look for:
- When this indicator moves up, it means buy pressure is increasing and the other way around for sell pressure. Crossing 0 means that trend has changed in the given period (it is best to look for confirmation of buy/sell pressure in larger TFs)
- Overbought above 40 and oversold below -40 (these numbers vary depending on the security. Look for historical levels to determine overbought and oversold conditions of each security)
- Regular divergence shows that momentum of a trend is declining. Hidden divergence implies continuation of a trend. The non-bound mode should be more accurate for identifying divergence.
- Failure swings can detect potential reversals.
Please read Relative Strength Index and Money Flow for more information and similar disclaimers.
Recommendations:
- hlc3 (AKA typical price) as input source might be better than "close" as it captures more information. If you use hlc3 as a source, then change the chart type to line and set hlc3 as the source for identifying divergence.
- Use hybrid tickers e.g.(BITFINEX:BTCUSD+COINBASE:BTCUSD+BITSTAMP:BTCUSD)/3. Volume-based indicators are susceptible to wash trading/volume printing and hybrid tickers mitigate this issue.
- In non-bound mode, small TFs with longer length should be more accurate than larger TFs with standard length (same is true for many other indicators)
Background:
I have developed 4 indicators based on a simple but elegant concept of A/D ratio. A/D ratio is equal to (current close - previous close)/True Range (when there are no price gaps, True Range = High - Low)
1) What you see on ADV indicator as darker green and red is equal to A/D ratio x volume.
2) ADL indicator shows the summation of ADV
3) ADMF (or ADP in non-bound mode) shows Moving Average of ADV
4) ADP shows relative accumulation strength which is calculated as RMA (accumulations)/RMA(accumulation + distribution). ADP equation is based on RSI equation which is RMA(gains)/RMA(gains + losses). That is why these two indicators look quite similar.
PS: Please leave a like if you find these indicators useful. I am working on improvements on these and other indicators. I am trying my best to keep them as simple as possible. Please let me know in the comments if you want me to make future indicators even simpler.
--------
Complementary indicators based on the same concept:
ADL: a replacement for Chaikin's Accum/Dist, On Balance Volume, and Price Volume Trend
ADV: a replacement for regular volume indicator
ADP also has a scaled RSI and ADMF built in (ie ADMF is obsolete).

Rifle UnifiedThis script is designed for use on 30-second charts of Dow Jones-related symbols (YM, MYM, US30). It provides automated buy and sell signals using a combination of price action, RSI (Relative Strength Index), and volume analysis. The script is intended for both live trading signals and backtesting, with configurable risk management and debugging features.
Core Functionality
1. Signal Generation Logic
Trigger: The algorithm looks for a sharp price move (drop or rise) of a user-defined threshold (default: 80 points) within a specified lookback window (default: 20 minutes).
Levels: It monitors for price drops below specific numerical levels ending in 23, 43, or 73 (e.g., 42223, 42273).
RSI Condition: When price falls below one of these levels and the RSI is below 30, the setup is considered active.
Buy Signal: A buy is triggered if, after setup:
Price rises back above the level,
The RSI rate of change (ROC) indicates exhaustion of the drop,
The current bar shows positive momentum.
2. Trade Management
Stop Loss & Take Profit: Configurable fixed or trailing stop loss and take profit levels are plotted and managed automatically.
Exit Signals: The script signals exit based on price action relative to these risk management levels.
3. Filters & Enhancements
Parabolic Move Filter: Prevents entries during extreme price moves.
Dead Cat Bounce Filter: Avoids false signals after sharp reversals.
Volume Filter: Optionally requires volume conditions for trade entries (especially for shorts).
Multiple Confirmation Layers : Includes checks for 5-minute RSI, momentum, and price retracement.
User Inputs & Customization
Trade Direction: Toggle between LONG and SHORT signal generation.
Trigger Settings: Adjust thresholds for price moves, lookback windows, RSI ROC, and volume requirements.
Trade Settings: Set take profit, stop loss, and trailing stop behavior.
Debug & Visualization: Enable or disable various plots, labels, and debug tables for in-depth analysis.
Backtesting: Integrated backtester with summary and detailed statistics tables.
Technical Features
Uses External Libraries: Relies on RifleShooterLib for core logic and BackTestLib for backtesting and statistics.
Multi-timeframe Analysis: Incorporates both 30-second and 5-minute RSI calculations.
Chart Annotations: Plots entry/exit points, risk levels, and debug information directly on the chart.
Alert Conditions: Built-in alert triggers for key events (initial move, stall, entry).
Intended Use
Markets: Dow Jones symbols (YM, MYM, US30, or US30 CFD).
Timeframe: 30-second chart.
Purpose: Automated signal generation for discretionary or algorithmic trading, with robust risk management and backtesting support.
Notable Customization & Extension Points
Momentum Calculation: Plans to replace the current momentum measure with "sqz momentum".
Displacement Logic: Future update to use "FVG concept" for displacement.
High-Contrast RSI: Optional visual enhancements for RSI extremes.
Time-based Stop: Consideration for adding a time-based stop mechanism.
This script is highly modular, with extensive user controls, and is suitable for both live trading and historical analysis of Dow Jones index movements

Dynamic Sentiment RSI [UAlgo]The Dynamic Sentiment RSI is a technical analysis tool that combines the classic RSI (Relative Strength Index) concept with dynamic sentiment analysis, offering traders enhanced insights into market conditions. Unlike the traditional RSI, this indicator integrates volume weighting, sentiment factors, and smoothing features to provide a more nuanced view of momentum and potential market reversals. It is designed to assist traders in detecting overbought/oversold conditions, momentum shifts, and to generate potential buy or sell signals using crossover and crossunder techniques. By dynamically adjusting based on sentiment and volume factors, this RSI offers better adaptability to varying market conditions, making it suitable for different trading styles and timeframes.
This tool is particularly helpful for traders who wish to explore not only price movement but also the underlying market sentiment, offering a more comprehensive approach to momentum analysis. The sentiment factor amplifies the RSI's sensitivity to price shifts, making it easier to detect early signals of market reversals or the continuation of a trend.
🔶 Key Features
Dynamic Sentiment Calculation: The indicator incorporates a "Sentiment Factor" that adjusts the RSI length dynamically based on a multiplier, helping traders better understand market sentiment at different time intervals.
Volume Weighting: When enabled, the RSI calculations are weighted by volume, allowing traders to give more importance to price movements with higher trading volume, which may provide more accurate signals.
Smoothing Feature: A customizable smoothing period is applied to the RSI to help filter out noise and make the signal smoother. This feature is particularly useful for traders who prefer to focus on long-term trends while minimizing false signals.
Step Size Customization: A "Step Size" input allows users to round the sentiment RSI to predefined intervals, making the results easier to interpret and act upon. This feature allows you to focus on significant sentiment changes and ignore minor fluctuations.
Crossover/Crossunder Alerts: The indicator includes crossover and crossunder signals on the zero-line, helping traders identify potential buy and sell opportunities as the smoothed RSI crosses these levels.
The indicator offers a clear visual display with multiple color-coded lines and areas:
Sentiment RSI: Plotted as an area chart, color-coded based on sentiment strength.
Raw RSI: A purple line representing the raw adjusted RSI.
Smoothed RSI: A dynamic line, color-coded aqua or orange based on its position relative to the zero line.
Buy/Sell Signals: Triangle shapes are plotted at crossovers and crossunders, providing clear entry and exit points.
🔶 Interpreting the Indicator
Sentiment RSI
-This line represents the sentiment-adjusted RSI, where the higher the value, the stronger the bullish sentiment, and the lower the value, the stronger the bearish sentiment. It is rounded to step intervals, making it easier to detect significant shifts in sentiment.
- A positive sentiment RSI (above 0) suggests bullish market conditions, while a negative sentiment RSI (below 0) suggests bearish conditions.
Smoothed RSI
The smoothed RSI helps reduce noise and shows the trend more clearly.
Crossovers of the zero line are significant:
- Crossover above zero: Indicates that bullish momentum is building, potentially signaling a buying opportunity.
- Crossunder below zero: Signals a shift towards bearish momentum, potentially indicating a sell signal.
Traders should look for these crossovers in conjunction with other signals for more accurate entry/exit points.
Raw RSI (Adjusted)
The raw adjusted RSI offers a less smoothed, more responsive version of the RSI. While it may be noisier, it provides early signals of market reversals and trends.
Crossover/Crossunder Signals
- When the smoothed RSI crosses above the zero line, a "Signal Up" triangle appears, indicating a potential buying opportunity.
- When the smoothed RSI crosses below the zero line, a "Signal Down" triangle appears, signaling a potential sell opportunity.
These signals help traders time their entries and exits by identifying momentum shifts.
Volume Weighting (Optional)
- If volume weighting is enabled, the RSI will give more weight to periods of higher trading volume, making the signals more reliable when the market is highly active.
Strong Up/Down Levels (40/-40)
- These dotted lines represent extreme sentiment levels. When the sentiment RSI reaches 40 or -40, the market may be nearing an overbought or oversold condition, respectively. This could be a signal for traders to prepare for potential reversals or shifts in momentum.
By combining the various components of this indicator, traders can gain a comprehensive view of market sentiment and price action, helping them make more informed trading decisions. The combination of sentiment factors, volume weighting, and smoothing makes this indicator highly flexible and suitable for a variety of trading strategies.
🔶 Disclaimer
Use with Caution: This indicator is provided for educational and informational purposes only and should not be considered as financial advice. Users should exercise caution and perform their own analysis before making trading decisions based on the indicator's signals.
Not Financial Advice: The information provided by this indicator does not constitute financial advice, and the creator (UAlgo) shall not be held responsible for any trading losses incurred as a result of using this indicator.
Backtesting Recommended: Traders are encouraged to backtest the indicator thoroughly on historical data before using it in live trading to assess its performance and suitability for their trading strategies.
Risk Management: Trading involves inherent risks, and users should implement proper risk management strategies, including but not limited to stop-loss orders and position sizing, to mitigate potential losses.
No Guarantees: The accuracy and reliability of the indicator's signals cannot be guaranteed, as they are based on historical price data and past performance may not be indicative of future results.

@tk · fractal rsi levels█ OVERVIEW
This script is an indicator that helps traders to identify the RSI Levels for multiple fractals wherever the current timeframe is. This script was based on RSI Levels, 20-30 & 70-80 by abdomi indicator, that calculates the Relative Strenght Index levels based on the asset's price and plots it into the chart, creating a "wave" style indicator. The core feature of this indicator is the fractal rays, so trader can visualize each of the oversold and overbought levels of multiple timeframe on the current timeframe that he is on. The indicator will plots multiple rays after the chart bars. indicating where is the oversold and overbought levels for others fractals.
█ MOTIVATION
Since the RSI Levels, 20-30 & 70-80 by abdomi indicator helps a lot to identify the possible price levels when the asset is oversold or overbought, I saw myself drawing multiple horizontal lines on these levels in lower timeframes so, in an uptrend or downtrend, I can try to get a pullback of these trends when the asset reaches oversold or overboght levels. So, I get the idea to make those lines visible in multiple timeframes so I don't need to draw it myself manually anymore.
█ CONCEPT
The trading concept to use this indicator is the concept to make entries on uptrend or downtrend pullbacks when the asset price reaches oversold or overbought levels. But this strategy don't works alone. It needs to be aligned together with others indicators like Exponential Moving Averages, Chart Patterns, Support and Resistance, and so on... Even more confluences that you have, bigger are your chances to increase the probability for a successful trade. So, don't use this indicator alone. Compose a trading strategy and use it to improve your analysis.
█ CUSTOMIZATION
This indicator allows the trader to customize the following settings:
GENERAL
Text size
Changes the font size of the labels to improve accessibility.
Type: string
Options: `tiny`, `small`, `normal`, `large`.
Default: `small`
RSI LEVELS · SETTINGS
Pre-oversold Level
Changes the RSI Level to calculate the "pre-oversold" price level on the chart.
Type: int
Min: 1
Max: 49
Default: 33
Pre-overbought Level
Changes the RSI Level to calculate the "pre-overbought" price level on the chart.
Type: int
Min: 51
Max: 100
Default: 67
Show "Pre-over" Levels
Enables / Disables the pre-oversold and pre-overbought levels on the chart.
Type: bool
Default: true
FRACTAL RAYS · SETTINGS
Length
Changes the base length for the RSI calculation.
Type: int
Min: 1
Default: 14
Source
Changes the base source for the RSI calculation.
Type: float
Default: close
FRACTAL RAYS · STYLE
Ray Color
Changes the color of all fractal rays and its label.
Type: color
Default: color.rgb(187, 74, 207)
Ray Style
Changes the style of all fractal rays.
Type: string
Options: `line.style_solid`, `line.style_dashed`, `line.style_dotted`
Default: line.style_dotted
Ray Length
Changes the length of all fractal rays.
Type: int
Default: 15
FRACTAL RAYS · OVERSOLD
Oversold Level
Changes the base RSI Level for fractal rays calculation.
Type: int
Min: 1
Default: 30
Oversold Prefix
Customizes the fractal ray label with a prefix text.
Type: string
Default: 🚀
Oversold Suffix
Customizes the fractal ray label with a suffix text.
Type: string
Default: (empty)
FRACTAL RAYS · OVERBOUGHT
Overbought Level
Changes the base RSI Level for fractal rays calculation.
Type: int
Min: 1
Default: 70
Overbought Prefix
Customizes the fractal ray label with a prefix text.
Type: string
Default: 🐻
Overbought Suffix
Customizes the fractal ray label with a suffix text.
Type: string
Default: (empty)
FRACTAL RAYS · VISIBILITY RULES
These rules are applied for each of fractal rays so, the traders can choose what timeframes they wants to show the fractal rays for each of it. The rule will be applied as the following condition: `if timeframe != CURRENT_TIMEFRAME and timeframe <= CHOSEN_OPTION`. Actually, the fractal rays are on the chart but, isn't visible because it was applied a transparent color, so it is visually not on the chart to prevent chart's over polution.
LABELS
Show Labels on Price Scale
Shows labels on price scale.
Type: bool
Default: false
Show Price on Fractal Rays
Shows the RSI Level price on each of fractal rays respectively.
Type: bool
Default: false
█ EXTERNAL LIBRARIES
This script uses the `tk` library to calculate RSI Levels. It is a library that contains various functions that helps pine script developers to calculate RSI Levels.
█ FUNCTIONS
The library contains the following functions:
fn_fractalVisibilityRule(string visibilityRule)
Converts the fractal rays timeframe visibility rule label to timestamp int.
Parameters:
visibilityRule: (string) Fractal ray visibility rule label.
Returns: (int) Fractal ray visibility rule timestamp.
fn_requestFractal(string period, expression)
Converts the fractal rays timeframe visibility rule label to timestamp int.
Parameters:
period: (string) Timeframe period for the desired fractal.
expression: (mixed) Security expression that will be applied for calculation.
Returns: (mixed) A result determined by expression.
fn_plotRay(float y, string label, color color, int length)
Plots ray after chart bars for the current time.
Parameters:
period: (string) Timeframe period for the desired fractal.
expression: (mixed) Security expression that will be applied for calculation.
Returns: (void) This function only plots the elements into the chart
fn_plotRsiLevelRay(simple string period, simple int level, color color)
Plots RSI Levels ray after chart bars for the current time.
Parameters:
period: (simple string) Timeframe period.
level: (simple int) Relative Strength Index level.
color: (color) The color of both, ray and label text.
Returns: (void) This function only plots the elements into the chart

RSI-RS StrategyRSI-RS Strategy: Smart Trend Following 🚀
Overview
This strategy combines Multi-Timeframe RSI with Mansfield Relative Strength to identify high-momentum breakouts in strong stocks. Unlike standard RSI strategies, it features a "Smart Trailing Stop" that tightens when momentum weakens but respects key RSI 50 support levels to avoid shaking you out of winning trades.
Key Features ✨
1. 🎯 High-Probability Entries
Multi-Confirmations: Requires Monthly RSI > 60 and Weekly RSI > 60 (Trend is Up).
Dual Trigger: Enters on a Daily RSI Breakout (>60) OR a Weekly RSI Catch-up, ensuring you don't miss late moves.
RS Filter: Only buys stocks outperforming the Index (RS > 0).
New Listing Safe: Automatically skips Monthly checks for new IPOs lacking history.
2. 🛡️ Advanced "Hybrid" Stop Loss
This strategy solves the "Wick Out" problem:
Confirmation Exit: If price drops below the Stop Loss, it waits for the Next Candle to confirm the breakdown. It ignores intraday wicks!
Crash Protection: Includes a "Panic Button" (Default 3% buffer). If price crashes rapidly intraday, it exits immediately to save capital.
Smart Trailing: The Stop Loss moves UP when RSI shows weakness (<60), locking in profits.
3. 🧠 Smart Support Buffer
Wait for 50: Uniquely detects when RSI is resting on 50 Support (Zone 50-55).
Patience: It ignores minor weakness signals in this zone, waiting for a bounce instead of exiting prematurely.
4. 🧹 Clean Visuals
Minimalist Labels: Transparent Entry/Exit labels that don't declutter the chart.
Setup Watch: Visually signals "Watch > " before the trade triggers.
Transparency: "SL Update" diamonds prove exactly why the stop moved (showing the RSI value).
Settings Guide ⚙️
Confirmation Window: How many bars the breakout remains valid (Default: 2).
RSI Support Buffer: The "Safe Zone" range above 50 (Default: 5).
Crash Buffer %: Distance below SL for immediate emergency exit (Default: 3.0%).
Visuals: Toggle Setup Labels and SL Diamonds on/off to keep your chart clean.
How to Trade It
Green Background: You are in a trade.
Red Line: Your Hard Stop Loss (Closing Basis).
Maroon Dotted Line: Your Crash Limit (Intraday Danger Zone).
Orange Diamond: Warning! RSI Weakness detected, SL has tightened.
Disclaimer
Backtested on Indian Equities (NSE). Designed for Swing Trading on Daily Timeframe. Always manage your own risk.

Z-Score DeltaHeavily modified from Z Score by jwammo12
Compares the z-score of two assets, the onscreen one and the reference one configured. If you're familiar, you can think of it as Bollinger Band Percent of Onscreen Asset minus the Bollinger Band Percent of Reference Asset.
It's compared off a simple moving average, due to how standard deviation is calculated.
I view this a more literal meaning of relative strength.
Has the ability to offset or delay in time one to another.
TODO: add MAD and MAD/STD.DEV views
Not my greatest work, but it's functional.

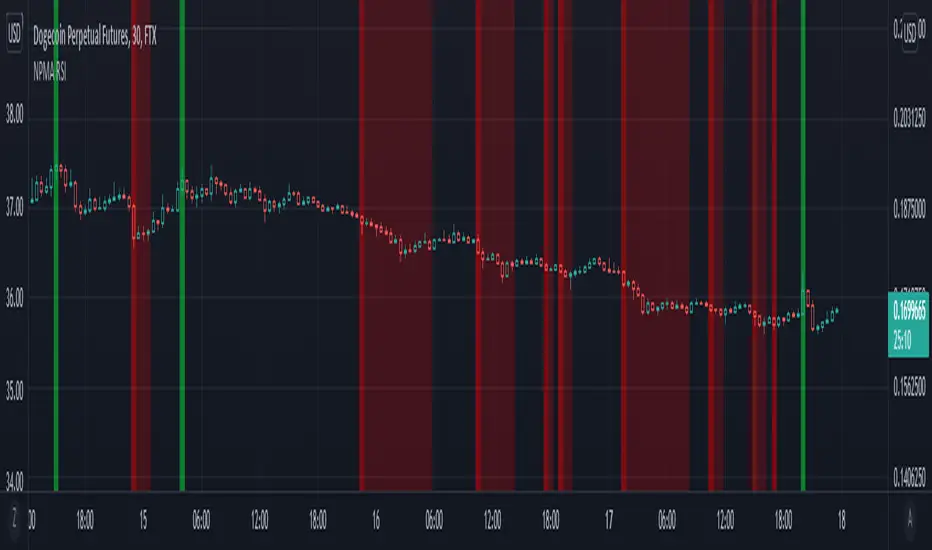
NPMA Relative Strength IndexRecently been amased by the potential of percentile nearest rank. You can apply this to almost any indicator to find extremes, this script might the simplest form of using it while being very powerful. The background will color green when the rsi is in the top percentage ranges of last X amount of bars. I'm currently searching optimal settings to apply this to a simple 3commas bot. Feel free to comment good settings and help the community out making profitable bots.
RSI(Min-Max)RSI (Min-Max) is an enhanced version of Welles Wilder's Relative Strength Index, designed to offer greater analytical precision and dynamic insight into the behavior of the RSI within each candlestick.In addition to displaying the traditional RSI value, this script calculates the possible extreme values — the minimum and maximum RSI — based on the low and high prices of the current candle. This allows you to estimate how the RSI would react if the price moved to the extremes of the bar, providing a predictive and refined reading of momentum.

RSI + MFI Momentum Mapper - CoffeeKillerRSI + MFI Momentum Mapper - CoffeeKiller Indicator Guide
Welcome traders! This guide will walk you through the RSI + MFI Momentum Mapper indicator, an innovative market analysis tool developed by CoffeeKiller that combines two powerful oscillators to create a comprehensive momentum visualization system.
🔔 **Warning: This Is Not a Standard RSI or MFI Indicator** 🔔 This indicator combines and normalizes RSI and MFI data to create a unified momentum representation with boundary detection and peak signaling features.
Core Concept: Combined Momentum Analysis
The foundation of this indicator lies in merging the strengths of two complementary oscillators - Relative Strength Index (RSI) and Money Flow Index (MFI) - to provide a more robust momentum signal that accounts for both price action and volume.
Directional Columns: Momentum Strength
- Positive Green Columns: Bullish momentum
- Negative Red Columns: Bearish momentum
- Color intensity varies based on momentum strength
- Special coloring for new high/low boundaries
Marker Lines: Dynamic Support/Resistance
- High Marker Line (Magenta): Tracks the highest point reached during a bullish phase
- Low Marker Line (Cyan): Tracks the lowest point reached during a bearish phase
- Creates visual boundaries showing momentum extremes
Peak Detection System:
- Triangular markers identify significant local maxima and minima
- Background highlighting shows important momentum peaks
- Helps identify potential reversal points and momentum exhaustion
Reference Lines:
- Zero Line (Gray): Divides bullish from bearish momentum
- High Line (+1): Upper threshold for extremely bullish conditions
- Low Line (-1): Lower threshold for extremely bearish conditions
Core Components
1. Oscillator Normalization
- RSI and MFI values centered around zero
- Values scaled to create consistent visualization
- Normalized range typically between -1 and +1
- Combination of indicators for signal reliability
2. Boundary Tracking System
- Automatic detection of highest values in bullish phases
- Automatic detection of lowest values in bearish phases
- Step-line visualization of boundaries
- Color-coded for easy identification
3. Peak Detection System
- Identification of local maxima and minima
- Background highlighting of significant peaks
- Triangle markers for peak visualization
- Zero-line cross detection for trend changes
4. Signal Smoothing
- Signal line calculation via SMA
- Helps filter noise and identify trends
- Provides confirmation of momentum direction
Main Features
Oscillator Settings
- Customizable RSI length for sensitivity control
- Customizable MFI length for sensitivity control
- Normalized display for consistent visualization
- Signal smoothing for clearer readings
Visual Elements
- Color-coded columns showing momentum direction and strength
- Dynamic marker lines for momentum boundaries
- Peak triangles for significant turning points
- Background highlighting for peak identification
- Reference lines for momentum threshold levels
Signal Generation
- Zero-line crosses for trend change signals
- Boundary breaks for momentum strength
- Peak formation for potential reversals
- Color changes for momentum direction and acceleration
Customization Options
- RSI and MFI length parameters
- Marker line visibility and colors
- Peak marker color selection
- Peak background display options
Trading Applications
1. Trend Identification
- Directional line crossing above zero: bullish trend beginning
- Directional line crossing below zero: bearish trend beginning
- Column color: indicates momentum direction
- Column height: indicates momentum strength
2. Reversal Detection
- Peak triangles after extended trend: potential exhaustion
- Background highlighting: significant reversal points
- Directional line approaching marker lines: potential trend change
- Color shifts from bright to muted: decreasing momentum
3. Momentum Analysis
- Breaking above previous high boundary: accelerating bullish momentum
- Breaking below previous low boundary: accelerating bearish momentum
- Special coloring (magenta/cyan): boundary breaks indicating strength
- Approaching +1/-1 lines: extreme momentum conditions
4. Market Structure Assessment
- Consecutive higher peaks: strengthening bullish structure
- Consecutive lower troughs: strengthening bearish structure
- Peak comparisons: relative strength of momentum phases
- Boundary line steps: market structure levels
Optimization Guide
1. Oscillator Settings
- RSI Length: Default 14 provides balanced signals
- Lower values (7-10): More responsive, potentially noisier
- Higher values (20-30): Smoother, fewer false signals
- MFI Length: Default 14 provides balanced signals
- Lower values: More responsive to volume changes
- Higher values: Less sensitive to short-term volume spikes
2. Visual Customization
- Marker Line Colors: Adjust for visibility on your chart
- Peak Marker Color: Default yellow provides good contrast
- Enable/disable background highlights based on preference
- Consider chart background when selecting colors
3. Signal Interpretation
- Stronger signals: When directional line approaches +1/-1
- Confirmation: When peaks form after extended momentum
- Early warnings: When color intensity changes before direction
- Trend strength: Distance between zero line and current reading
4. Reference Line Usage
- Zero line: Primary trend divider
- +1/-1 lines: Extreme momentum thresholds
- Marker lines: Dynamic support/resistance levels
- Distance from reference: Momentum strength measure
Best Practices
1. Signal Confirmation
- Wait for zero-line crosses to confirm trend changes
- Look for peak formations to identify potential reversals
- Check for boundary breaks to confirm strong momentum
- Use with price action for entry/exit precision
2. Timeframe Selection
- Lower timeframes: more signals, potential noise
- Higher timeframes: cleaner signals, less frequent
- Multiple timeframes: confirm signals across time horizons
- Match to your trading style and holding period
3. Market Context
- Strong bullish phase: positive columns breaking above marker line
- Strong bearish phase: negative columns breaking below marker line
- Columns approaching zero: potential trend change
- Columns approaching +1/-1: extreme conditions, potential reversal
4. Combining with Other Indicators
- Use with trend indicators for confirmation
- Pair with other oscillators for divergence detection
- Combine with volume analysis for validation
- Consider support/resistance levels with boundary lines
Advanced Trading Strategies
1. Boundary Break Strategy
- Enter long when directional line breaks above previous high marker line
- Enter short when directional line breaks below previous low marker line
- Use zero-line as initial stop-loss reference
- Take profits at formation of opposing peaks
2. Peak Trading Strategy
- Identify significant peaks with triangular markers
- Look for consecutive lower peaks in bullish phases for shorting opportunities
- Look for consecutive higher troughs in bearish phases for buying opportunities
- Use zero-line crosses as confirmation
3. Extreme Reading Strategy
- Look for directional line approaching +1/-1 lines
- Watch for color changes and peak formations
- Enter counter-trend positions after confirmed peaks
- Use tight stops due to extreme momentum conditions
4. Column Color Strategy
- Enter long when columns turn bright green (increasing momentum)
- Enter short when columns turn bright red (increasing momentum)
- Exit when color intensity fades (decreasing momentum)
- Use marker lines as dynamic support/resistance
Practical Analysis Examples
Bullish Market Scenario
- Directional line crosses above zero line
- Green columns grow in height and intensity
- High marker line forms steps upward
- Peak triangles appear at local maxima
- Background highlights appear at significant momentum peaks
Bearish Market Scenario
- Directional line crosses below zero line
- Red columns grow in depth and intensity
- Low marker line forms steps downward
- Peak triangles appear at local minima
- Background highlights appear at significant momentum troughs
Consolidation Scenario
- Directional line oscillates around zero line
- Column colors alternate frequently
- Marker lines remain relatively flat
- Few or no new peak highlights appear
- Directional values remain small
Understanding Market Dynamics Through RSI + MFI Momentum Mapper
At its core, this indicator provides a unique lens to visualize market momentum by combining two complementary oscillators:
1. Combined Strength: By averaging RSI (price-based) and MFI (volume-based), the indicator provides a more comprehensive view of market momentum that considers both price action and buying/selling pressure.
2. Normalized Scale: The indicator normalizes values around zero, making it easier to identify bullish vs bearish conditions and the relative strength of momentum in either direction.
3. Dynamic Boundaries: The marker lines create a visual representation of the "high water marks" of momentum in both directions, helping to identify when markets are making new momentum extremes.
4. Exhaustion Signals: The peak detection system highlights moments where momentum has reached a local maximum or minimum, often precursors to reversals or consolidations.
Remember:
- Combine signals from directional line, marker lines, and peak formations
- Use appropriate timeframe settings for your trading style
- Customize the indicator to match your visual preferences
- Consider market conditions and correlate with price action
This indicator works best when:
- Used as part of a comprehensive trading system
- Combined with proper risk management
- Applied with an understanding of current market conditions
- Signals are confirmed by price action and other indicators
DISCLAIMER: This indicator and its signals are intended solely for educational and informational purposes. They do not constitute financial advice. Trading involves significant risk of loss. Always conduct your own analysis and consult with financial professionals before making trading decisions.

Waldo Momentum Cloud Bollinger Bands (WMCBB)
Title: Waldo Momentum Cloud Bollinger Bands (WMCBB)
Description:
Introducing the "Waldo Momentum Cloud Bollinger Bands (WMCBB)," an innovative trading tool crafted for those who aim to deepen their market analysis by merging two dynamic technical indicators: Dynamic RSI Bollinger Bands and the Waldo Cloud.
What is this Indicator?
WMCBB integrates the volatility-based traditional Bollinger Bands with a momentum-sensitive approach through the Relative Strength Index (RSI). Here’s how it works:
Dynamic RSI Bollinger Bands: These bands dynamically adjust according to the RSI, which tracks the momentum of price movements. By scaling the RSI to align with price levels, we generate bands that not only reflect market volatility but also the underlying momentum, offering a refined view of overbought and oversold conditions.
Waldo Cloud: This feature adds a layer of traditional Bollinger Bands, visualized as a 'cloud' on your chart. It employs standard Bollinger Band methodology but enhances it with additional moving average layers to better define market trends.
The cloud's color changes dynamically based on various market conditions, providing visual signals for trend direction and potential trend reversals.
Why Combine These Indicators?
Combining Dynamic RSI Bollinger Bands with the Waldo Cloud in WMCBB aims to:
Enhance Trend Identification: The Waldo Cloud's color-coded system aids in recognizing the overarching market trend, while the Dynamic RSI Bands give insights into momentum changes within that trend, offering a comprehensive view.
Improve Volatility and Momentum Analysis: While traditional Bollinger Bands measure market volatility, integrating RSI adds a layer of momentum analysis, potentially leading to more accurate trading signals.
Visual Clarity: The unified color scheme for both sets of bands, which changes according to RSI levels, moving average crossovers, and price positioning, simplifies the process of gauging market sentiment at a glance.
Customization: Users have the option to toggle the visibility of moving averages (MA) through the settings, allowing for tailored analysis based on individual trading strategies.
Usage:
Utilize WMCBB to identify potential trend shifts by observing price interactions with the dynamic bands or changes in the Waldo Cloud's color.
Watch for divergences between price movements and RSI to forecast potential market reversals or continuations.
This combination shines in sideways markets where traditional indicators might fall short, as it provides additional context through RSI momentum analysis.
Settings:
Customize parameters for both the Dynamic RSI and Waldo Cloud Bollinger Bands, including the calculation source, standard deviation factors, and moving average lengths.
WMCBB is perfect for traders seeking to enhance their market analysis through the synergy of momentum and volatility, all while maintaining visual simplicity. Trade with greater insight using the Waldo Momentum Cloud Bollinger Bands!

RSI Strategy With TP/SL - Lower TFThis Pine Script strategy integrates the Relative Strength Index (RSI) for trade signals with user-defined Take Profit (TP) and Stop Loss (SL) levels. It's designed for flexible application in different market conditions, offering long, short, or dual-direction trading.
Short Description
The strategy uses the RSI to identify overbought and oversold market conditions:
Buy signal: When RSI drops below the specified "Buy Level."
Sell signal: When RSI rises above the "Sell Level."
Additionally, it manages risk and profit targets with:
Take Profit (TP): Exits trades when the price reaches a percentage gain.
Stop Loss (SL): Exits trades to limit losses if the price falls by a certain percentage.
The strategy is versatile and includes options for visualizing performance, monthly profit/loss data, and detailed trade metrics.
How to Use
Set Parameters:
RSI Period: Default is 14. Adjust based on your analysis.
RSI Buy/Sell Levels:
Buy Level: Default is 40. Consider higher levels for conservative entries.
Sell Level: Default is 60. Lower this for earlier exits.
Take Profit (%): Set your profit target (default: 5%).
Stop Loss (%): Set your risk tolerance (default: 2%).
Trade Direction: Choose "Long Only," "Short Only," or "Both."
Interpret Signals:
Buy signals appear when RSI crosses below the buy threshold.
Sell signals appear when RSI crosses above the sell threshold.
Risk Management:
The strategy dynamically calculates TP and SL levels for each trade.
TP/SL is applied using the percentage input based on the entry price.
Monitor Performance:
Review trade statistics in the "Strategy Tester."
Use the monthly performance table to track P/L across months.
Customize Alerts:
Alerts for buy, sell, TP, and SL events can be used to automate notifications.
Key Features
Configurable RSI Settings: Adaptable to various market conditions.
Risk Management: Built-in TP and SL management.
Customizable Trade Direction: Tailored for long-only, short-only, or both directions.
Monthly P/L Table: Visualizes performance trends over time.
Alerts: Notifies when critical trade events occur.
Please do your own research before ase this to your real trading.

Multi Timeframe RSI Buy Sell Strategy [TradeDots]The "Multi Timeframe RSI Buy/Sell Strategy" is a trading strategy that utilizes Relative Strength Index (RSI) indicators from multiple timeframes to provide buy and sell signals.
This strategy allows for extensive customization, supporting up to three distinct RSIs, each configurable with its own timeframe, length, and data source.
HOW DOES IT WORK
This strategy integrates up to three RSIs, each selectable from different timeframes and customizable in terms of length and source. Users have the flexibility to define the number of active RSIs. These selections visualize as plotted lines on the chart, enhancing interpretability.
Users can also manage the moving average of the selected RSI lines. When multiple RSIs are active, the moving average is calculated based on these active lines' average value.
The color intensity of the moving average line changes as it approaches predefined buying or selling thresholds, alerting users to potential signal generation.
A buy or sell signal is generated when all active RSI lines simultaneously cross their respective threshold lines. Concurrently, a label will appear on the chart to signify the order placement.
For those preferring not to display order information or activate the strategy, an "Enable backtest" option is provided in the settings for toggling activation.
APPLICATION
The strategy leverages multiple RSIs to detect extreme market conditions across various timeframes without the need for manual timeframe switching.
This feature is invaluable for identifying divergences across timeframes, such as detecting potential short-term reversals within broader trends, thereby aiding traders in making better trading decisions and potentially avoiding losses.
DEFAULT SETUP
Commission: 0.01%
Initial Capital: $10,000
Equity per Trade: 60%
RISK DISCLAIMER
Trading entails substantial risk, and most day traders incur losses. All content, tools, scripts, articles, and education provided by TradeDots serve purely informational and educational purposes. Past performances are not definitive predictors of future results.
TradeDots Stochastic Z-Score

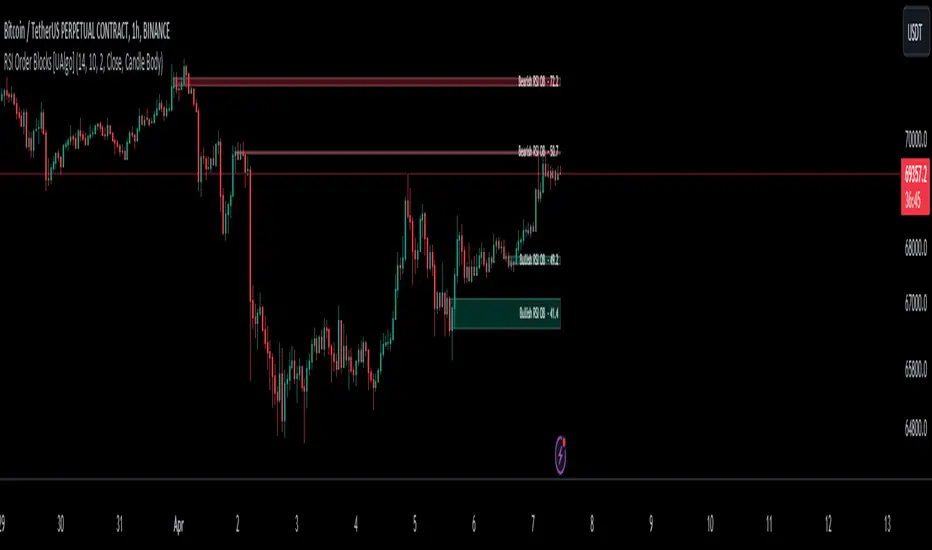
RSI Order Blocks [UAlgo]The "RSI Order Blocks " identifies and visualizes potential order blocks based on the Relative Strength Index (RSI) indicator. These zones may indicating potential support or resistance levels.
🔶 Key Features :
RSI-based Order Block Identification: The script utilizes the RSI indicator to identify potential order blocks. It detects pivot highs and lows in the RSI, which are indicative of potential reversal points, and marks these areas as potential order blocks.
Order Block Visualization: Identified order blocks are visually represented on the chart, making it easy for traders to recognize and interpret these significant price zones. Both bullish and bearish order blocks are differentiated by color, enhancing clarity and ease of analysis. Additionally, within each order block, the RSI value of that block is also shown.
RSI Overbought/Oversold Filter: Optionally, users can apply a filter based on RSI levels to refine the detection of order blocks. This filter prevents the creation of order blocks when the RSI is within specified overbought or oversold conditions (default between 30 and 70), helping traders focus on areas of potentially significant price action.
An Example with the OB/OS Filter Feature Turned Off:
An Example with the OB/OS Filter Feature Turned On:
Mitigation of Broken Order Blocks: Provides flexibility in selecting the mitigation method (based on close or wick) for determining order block breaches.
Customizable Parameters: The script offers a range of customizable parameters to tailor the detection and visualization of order blocks to suit individual trading preferences. Users can adjust parameters such as RSI Length, Order Block Detection Sensitivity, Mitigation Method, and order block style to fine-tune the analysis according to their trading strategy.
🔶 Disclaimer :
Not Financial Advice: This indicator is intended for educational and informational purposes only. It does not constitute financial advice or recommendations to buy, sell, or hold any financial instruments.
Use at Own Risk: Trading involves substantial risk of loss and is not suitable for all investors. Users of this indicator should exercise caution and conduct their own research and analysis before making any trading decisions.
Performance Not Guaranteed: Past performance is not indicative of future results. While the indicator aims to assist traders in analyzing market trends, there is no guarantee of accuracy or success in trading operations.