Unlock the Power of Seasonality: Monthly Performance StrategyThe Monthly Performance Strategy leverages the power of seasonality—those cyclical patterns that emerge in financial markets at specific times of the year. From tax deadlines to industry-specific events and global holidays, historical data shows that certain months can offer strong opportunities for trading. This strategy was designed to help traders capture those opportunities and take advantage of recurring market patterns through an automated and highly customizable approach.
The Inspiration Behind the Strategy:
This strategy began with the idea that market performance is often influenced by seasonal factors. Historically, certain months outperform others due to a variety of reasons, like earnings reports, holiday shopping, or fiscal year-end events. By identifying these periods, traders can better time their market entries and exits, giving them an advantage over those who solely rely on technical indicators or news events.
The Monthly Performance Strategy was built to take this concept and automate it. Instead of manually analyzing market data for each month, this strategy enables you to select which months you want to focus on and then executes trades based on predefined rules, saving you time and optimizing the performance of your trades.
Key Features:
Customizable Month Selection: The strategy allows traders to choose specific months to test or trade on. You can select any combination of months—for example, January, July, and December—to focus on based on historical trends. Whether you’re targeting the historically strong months like December (often driven by the 'Santa Rally') or analyzing quieter months for low volatility trades, this strategy gives you full control.
Automated Monthly Entries and Exits: The strategy automatically enters a long position on the first day of your selected month(s) and exits the trade at the beginning of the next month. This makes it perfect for traders who want to benefit from seasonal patterns without manually monitoring the market. It ensures precision in entering and exiting trades based on pre-set timeframes.
Re-entry on Stop Loss or Take Profit: One of the standout features of this strategy is its ability to re-enter a trade if a position hits the stop loss (SL) or take profit (TP) level during the selected month. If your trade reaches either a SL or TP before the month ends, the strategy will automatically re-enter a new trade the next trading day. This feature ensures that you capture multiple trading opportunities within the same month, instead of exiting entirely after a successful or unsuccessful trade. Essentially, it keeps your capital working for you throughout the entire month, not just when conditions align perfectly at the beginning.
Built-in Risk Management: Risk management is a vital part of this strategy. It incorporates an Average True Range (ATR)-based stop loss and take profit system. The ATR helps set dynamic levels based on the market’s volatility, ensuring that your stops and targets adjust to changing market conditions. This not only helps limit potential losses but also maximizes profit potential by adapting to market behavior.
Historical Performance Testing: You can backtest this strategy on any period by setting the start year. This allows traders to analyze past market data and optimize their strategy based on historical performance. You can fine-tune which months to trade based on years of data, helping you identify trends and patterns that provide the best trading results.
Versatility Across Asset Classes: While this strategy can be particularly effective for stock market indices and sector rotation, it’s versatile enough to apply to other asset classes like forex, commodities, and even cryptocurrencies. Each asset class may exhibit different seasonal behaviors, allowing you to explore opportunities across various markets with this strategy.
How It Works:
The trader selects which months to test or trade, for example, January, April, and October.
The strategy will automatically open a long position on the first trading day of each selected month.
If the trade hits either the take profit or stop loss within the month, the strategy will close the current position and re-enter a new trade on the next trading day, provided the month has not yet ended. This ensures that the strategy continues to capture any potential gains throughout the month, rather than stopping after one successful trade.
At the start of the next month, the position is closed, and if the next month is also selected, a new trade is initiated following the same process.
Risk Management and Dynamic Adjustments:
Incorporating risk management with this strategy is as easy as turning on the ATR-based system. The strategy will automatically calculate stop loss and take profit levels based on the market’s current volatility, adjusting dynamically to the conditions. This ensures that the risk is controlled while allowing for flexibility in capturing profits during both high and low volatility periods.
Maximizing the Seasonal Edge:
By automating entries and exits based on specific months and combining that with dynamic risk management, the Ultimate Monthly Performance Strategy takes advantage of seasonal patterns without requiring constant monitoring. The added re-entry feature after hitting a stop loss or take profit ensures that you are always in the game, maximizing your chances to capture profitable trades during favorable seasonal periods.
Who Can Benefit from This Strategy?
This strategy is perfect for traders who:
Want to exploit the predictable, recurring patterns that occur during specific months of the year.
Prefer a hands-off, automated trading approach that allows them to focus on other aspects of their portfolio or life.
Seek to manage risk effectively with ATR-based stop losses and take profits that adjust to market conditions.
Appreciate the ability to re-enter trades when a take profit or stop loss is hit within the month, ensuring that they don't miss out on multiple opportunities during a favorable period.
In summary, the Ultimate Monthly Performance Strategy provides traders with a comprehensive tool to capitalize on seasonal trends, optimize their trading opportunities throughout the year, and manage risk effectively. The built-in re-entry system ensures you continue to benefit from the market even after hitting targets within the same month, making it a robust strategy for traders looking to maximize their edge in any market.
Risk Disclaimer:
Trading financial markets involves significant risk and may not be suitable for all investors. The Monthly Performance Strategy is designed to help traders identify seasonal trends, but past performance does not guarantee future results. It is important to carefully consider your risk tolerance, financial situation, and trading goals before using any strategy. Always use appropriate risk management and consult with a professional financial advisor if necessary. The use of this strategy does not eliminate the risk of losses, and traders should be prepared for the possibility of losing their entire investment. Be sure to test the strategy on a demo account before applying it in live markets.
Search in scripts for "TAKE"

E9 Shark-32 Pattern Strategy The E9 Shark-32 Pattern is a powerful trading tool designed to capitalize on the Shark-32 pattern—a specific Candlestick pattern.
The Shark-32 Pattern: What Is It?
The Shark-32 pattern is a technical formation that occurs when the following conditions are met:
Higher Highs and Lower Lows: The low of two bars ago is lower than the previous bar, and the previous bar's low is lower than the current bar. At the same time, the high of two bars ago is higher than the previous bar, and the previous bar’s high is higher than the current bar.
This unique setup forms the "Shark-32" pattern, which signals potential volume squeezes and trend changes in the market.
How Does the Strategy Work?
The E9 Shark-32 Pattern Strategy builds upon this pattern by defining clear entry and exit rules based on the pattern's confirmation. Here's a breakdown of how the strategy operates:
1. Identifying the Shark-32 Pattern
When the Shark-32 pattern is confirmed, the strategy "locks" the high and low prices from the initial bar of the pattern. These locked prices serve as key levels for future trade entries and exits.
2. Entry Conditions
The strategy waits for the price to cross the pattern's locked high or low, signaling potential market direction.
Long Entry: A long trade is triggered when the closing price crosses above the locked pattern high (green line).
Short Entry: A short trade is triggered when the closing price crosses below the locked pattern low (red line).
The strategy ensures that only one trade is taken for each Shark-32 pattern, preventing overtrading and allowing traders to focus on high-probability setups.
3. Stop Loss and Take Profit Levels
The strategy has built-in risk management through stop-loss and take-profit levels, which are visually represented by the lines on the chart:
Stop Loss:
Stop loss can be adjusted in settings.
Take Profit:
For long trades: The take-profit target is set at the upper white dotted line, which is projected above the pattern high.
For short trades: The take-profit target is set at the lower white dotted line, which is projected below the pattern low.
These clearly defined levels help traders to manage risk effectively while maximizing potential returns.
4. Visual Cues
To make trading decisions even easier, the strategy provides helpful visual cues:
Green Line (Pattern High): This line represents the high of the Shark-32 pattern and serves as a resistance level and short entry signal.
Red Line (Pattern Low): This line represents the low of the Shark-32 pattern and serves as a support level and long entry signal.
White Dotted Lines: These lines represent potential profit targets, projected both above and below the pattern. They help traders define where the market might go next.
Additionally, the strategy highlights the pattern formation with color-coded bars and background shading to draw attention to the Shark-32 pattern when it is confirmed. This adds a layer of visual confirmation, making it easier to spot opportunities in real-time.
5. No Repeated Trades
An important aspect of the strategy is that once a trade is taken (either long or short), no additional trades are executed until a new Shark-32 pattern is identified. This ensures that only valid and confirmed setups are acted upon.

StyleLibraryLibrary "StyleLibrary"
A small library of Pine Script functions that return built-in style variables.
method sizeStyle(size)
Takes a `string` that returns the corresponding built-in size style variable.
Namespace types: series string, simple string, input string, const string
Parameters:
size (string) : A `string` representing a built-in size style: `"Tiny"`, `"Small"`, `"Normal"`, `"Large"`,
`"Huge"`, `"Auto"`.
Returns: The respective built-in size style variable.
method sizeStyle(size)
Takes a `sizeStyle` that returns the corresponding built-in size style variable.
Namespace types: series sizeStyle
Parameters:
size (series sizeStyle) : A `sizeStyle` representing a built-in size style variable.
Returns: The respective built-in size style variable.
method lineStyle(style)
Takes a `string` that returns the corresponding built-in line style variable.
Namespace types: series string, simple string, input string, const string
Parameters:
style (string) : A `string` representing a built-in line style: `"Dashed"`, `"Dotted"`, `"Solid"`.
Returns: The respective built-in line style variable.
method lineStyle(style)
Takes a `lineStyle` that returns the corresponding built-in line style variable.
Namespace types: series lineStyle
Parameters:
style (series lineStyle) : A `lineStyle` representing a built-in line style variable.
Returns: The respective built-in line style variable.
method labelStyle(style)
Takes a `string` that returns the corresponding built-in label style variable.
Namespace types: series string, simple string, input string, const string
Parameters:
style (string) : A `string` representing a built-in label style:
`"Arrow Down"`, `"Arrow Up"`, `"Circle"`, `"Cross"`, `"Diamond"`, `"Flag"`,
`"Label Center"`, `"Label Down"`, `"Label Left"`, `"Label Lower Left"`,
`"Label Lower Right"`, `"Label Right"`, `"Label Up"`, `"Label Upper Left"`,
`"Label Upper Right"`, `"None"`, `"Square"`, `"Text Outline"`, `"Triangle Down"`,
`"Triangle Up"`, `"XCross"`.
Returns: The respective built-in label style variable.
method labelStyle(style)
Takes a `labelStyle` that returns the corresponding built-in label style variable.
Namespace types: series labelStyle
Parameters:
style (series labelStyle) : A `labelStyle` representing a built-in label style variable.
Returns: The respective built-in label style variable.
method fontStyle(font)
Takes a `string` that returns the corresponding built-in font style variable.
Namespace types: series string, simple string, input string, const string
Parameters:
font (string) : A `string` representing a built-in font style: `"Default"`, `"Monospace"`.
Returns: The respective built-in font style variable.
method positionStyle(position)
Takes a `string` that returns the corresponding built-in position style variable.
Namespace types: series string, simple string, input string, const string
Parameters:
position (string) : A `string` representing a built-in position style:
`"Bottom Center", `"Bottom Left", `"Bottom Right", `"Middle Center", `"Middle Left",
`"Middle Right", `"Top Center", `"Top Left", `"Top Right".
Returns: The respective built-in position style variable.
method displayStyle(display)
Takes a `simple string` that returns the corresponding built-in display style variable.
Namespace types: simple string, input string, const string
Parameters:
display (simple string) : A `simple string` representing a built-in display style: `"All"`, `"Data Window"`,
`"None"`, `"Pane"`, `"Price Scale"`, `"Status Line"`.
Returns: The respective built-in display style variable.

Daily Bias Engine | PDH/PDL Range This program is designed to track the previous day range and interactions with the mean threshold on the following day.
The bias strategy is simple:
If you create new range highs over a PDH, you will lean towards calls.
If you create new range lows over a PDL, you will learn towards puts.
If neither event happens, no bias can be determined and therefore no trades taken.
If by 12:00pm there still is no bias determined, it will show moderate strength based on the trend.
Remember, use this strategy to outline your bias and find a cheap entry model to take advantage of.

Multi-Factor StrategyThis trading strategy combines multiple technical indicators to create a systematic approach for entering and exiting trades. The goal is to capture trends by aligning several key indicators to confirm the direction and strength of a potential trade. Below is a detailed description of how the strategy works:
Indicators Used
MACD (Moving Average Convergence Divergence):
MACD Line: The difference between the 12-period and 26-period Exponential Moving Averages (EMAs).
Signal Line: A 9-period EMA of the MACD line.
Usage: The strategy looks for crossovers between the MACD line and the Signal line as entry signals. A bullish crossover (MACD line crossing above the Signal line) indicates a potential upward movement, while a bearish crossover (MACD line crossing below the Signal line) signals a potential downward movement.
RSI (Relative Strength Index):
Usage: RSI is used to gauge the momentum of the price movement. The strategy uses specific thresholds: below 70 for long positions to avoid overbought conditions and above 30 for short positions to avoid oversold conditions.
ATR (Average True Range):
Usage: ATR measures market volatility and is used to set dynamic stop-loss and take-profit levels. A stop loss is set at 2 times the ATR, and a take profit at 3 times the ATR, ensuring that risk is managed relative to market conditions.
Simple Moving Averages (SMA):
50-day SMA: A short-term trend indicator.
200-day SMA: A long-term trend indicator.
Usage: The strategy uses the relationship between the 50-day and 200-day SMAs to determine the overall market trend. Long positions are taken when the price is above the 50-day SMA and the 50-day SMA is above the 200-day SMA, indicating an uptrend. Conversely, short positions are taken when the price is below the 50-day SMA and the 50-day SMA is below the 200-day SMA, indicating a downtrend.
Entry Conditions
Long Position:
-MACD Crossover: The MACD line crosses above the Signal line.
-RSI Confirmation: RSI is below 70, ensuring the asset is not overbought.
-SMA Confirmation: The price is above the 50-day SMA, and the 50-day SMA is above the 200-day SMA, indicating a strong uptrend.
Short Position:
MACD Crossunder: The MACD line crosses below the Signal line.
RSI Confirmation: RSI is above 30, ensuring the asset is not oversold.
SMA Confirmation: The price is below the 50-day SMA, and the 50-day SMA is below the 200-day SMA, indicating a strong downtrend.
Opposite conditions for shorts
Exit Strategy
Stop Loss: Set at 2 times the ATR from the entry price. This dynamically adjusts to market volatility, allowing for wider stops in volatile markets and tighter stops in calmer markets.
Take Profit: Set at 3 times the ATR from the entry price. This ensures a favorable risk-reward ratio of 1:1.5, aiming for higher rewards on successful trades.
Visualization
SMAs: The 50-day and 200-day SMAs are plotted on the chart to visualize the trend direction.
MACD Crossovers: Bullish and bearish MACD crossovers are highlighted on the chart to identify potential entry points.
Summary
This strategy is designed to align multiple indicators to increase the probability of successful trades by confirming trends and momentum before entering a position. It systematically manages risk with ATR-based stop loss and take profit levels, ensuring that trades are exited based on market conditions rather than arbitrary points. The combination of trend indicators (SMAs) with momentum and volatility indicators (MACD, RSI, ATR) creates a robust approach to trading in various market environments.

Partial Profit Calculator [TFO]This indicator was built to help calculate the outcome of trades that utilize multiple profit targets and/or multiple entries.
In its simplest form, we can have a single entry and a single profit target. As shown below in this long trade example, the indicator will draw risk and reward boxes (red and green, respectively) with several annotations. On the left-hand side, all entries will be displayed (in this case there is only one entry, "E1"). On the bottom, the "SL" label indicates the trade's stop loss placement. On the top, all target prices are displayed (in this case there is only one target, "TP1"). Lastly, on the right-hand side a label will display the total R that is to be expected from a winning trade, where R is one's unit of risk.
In the following example, we have two target prices - one at 18600 and one at 18700. You can input as many target prices as you'd like, separated by commas, i.e. "18600,18700" in this example. Make sure the values are separated by commas only, and not spaces, new lines, etc. As a result, we can see that the indicator draws where our profit targets would be with respect to our entry, E1. The indicator assumes that equal parts of the trade position are taken off at each target price. In this example on Nasdaq futures (NQ1!), since we have 2 target prices, this would be equivalent to assuming that we take exactly half the trade position off at TP1, and the remaining half of the position at TP2.
If we wanted to take more of the position off at a certain target, we could simply duplicate the target price. Here I set the target prices to "18600,18600,18700" to enforce that two thirds of the position be taken off at TP1 and TP2, while the remaining third gets taken off at TP3.
We can also show outcome annotations to describe how much R is generated from each possible trade outcome. Using the below chart as an example, the stop loss indicates a -1R loss. The total R from this trade criteria is 1.33 R, and each target price shows how much R is being generated if one were to take off an equal part of the position at said target prices. In this case, we would generate 0.17 R from taking one third of the position off at TP1, another 0.5 R from taking one third of the position off at TP2, and another 0.67 R from taking the remaining one third of the position off at TP3, all adding up to the total R indicated on the right-hand side label.
Using multiple entries works the same way as using multiple target prices, where the input should indicate each entry price separated by commas. In this example I've used "18550,18450" to achieve an average price of 18500, as indicated by the "E_avg" label that appears when more than one entry price is utilized. We can also opt to display risk as dollars instead of R values, where you can input your desired risk per trade, and all values are shown as dollar amounts instead of R multiples, as shown below with a risk per trade of $100.
This is meant to be an educational tool for trades that utilize multiple profit targets and/or entries. Hope you like it!

Liquidity Swings & SweepsThis Pine script indicator is designed to create a visual representation liquidity as identified by swing Highs/Lows along with an indication of the liquidity level that was swept, optionally rating the strength of the sweep based on time & price.
Relevance:
Liquidity levels & sweeps are crucial for many SMC/ICT setups and can indicate a point at which the price changes direction or may re-trace in an opposite direction to provide additional liquidity for continued move in the original direction. Additionally, liquidity levels may provide targets for setups, as price action will often seek to take out those levels as they main contain many buy/sell stops.
How It Works:
The indicator tracks all swing points, as identified using user-defined strength of the swing. Once a swing is formed that meets the criteria, it is represented by a horizontal line starting at the price of the current swing until the last bar on the chart. While the swing is valid, this line will continue to be extended until the swing is invalid or a new swing is formed. Upon identifying a new swing, the indicator then scans the earlier swings in the same direction looking for a point of greatest liquidity that was taken by the current swing. This level is then denoted by dashed horizontal line, connecting earlier swing point to the current. At the same time any liquidity zones between the two swings are automatically removed from the chart if they had previously been rendered on the chart. If the setting to enable scan for maximum liquidity is enabled, then while looking back, the indicator will look for lowest low or highest high that was taken by the current swing point, which may not be a swing itself, however, is a lowest/highest price point taken (mitigated) by the current swing, which in many cases will be better price then then the one represented by previous swing. If the option to render sweep label is enabled, the sweep line will also be completed by a label, that will score the sweep and a tooltip showing the details of the level swept and the time it took to sweep it. The score explained further in configurability section ranks the strength of the sweep based on time and is complemented by price (difference in price between the two liquidity levels).
Configurability:
A user may configure the strength of the swing using both left/right strength (number of bars) as well as optionally instruct the indicator to seek the lowest/highest price point which may not be previous swing that was taken out by newly formed swing.
From appearance perspective liquidity level colors & line width presenting the liquidity/swing can be configured. There is also an option to render the liquidity sweep label that will generate an icon-based rating of the liquidity sweep and a tooltip that provides details on the scope of the swing, which includes liquidity level swept and when it was formed along with the time it took to sweep the liquidity.
Rating is of sweeps is primarily based on time with a secondary reference to price
💥- Best rating, very strong sweep with an hourly or better liquidity sweep
🔥- Second rating, strong sweep with 15 – 59 minute liquidity sweep, or 5+ minute sweep of 10+ points
✅- Third rating, ok sweep with 5 - 15 minute liquidity sweep, or lower-time-frame sweep of 10+ points
❄️ - Weakest sweep, with liquidity of 5 or less minutes swept
What makes this indicator different:
Designed with high performance in mind, to reduce impact on chart render time.
Only keeps valid liquidity levels & sweeps on the chart
Automatically removes previously taken liquidity levels
Ranks liquidity sweeps to indicate strength of the sweep

Order Blocks Indicator [TradingFinder] Lightning|CHOCH |OB | BOS🔵 Introduction
In "Price Action," an "Order Block" is essentially an area on the price chart where significant players such as institutional traders have executed their moves by placing noteworthy orders. These points often indicate areas where price either attempts to break through (resistance) or returns when it reaches there (support).
Therefore, when discussing the identification of order blocks, we typically refer to finding points where the price has stalled for a while and has accumulated strength before making a significant move in one direction.
Essentially, order blocks assist traders in understanding where large players with "smart money" have likely placed their bulk orders in the market. Traders use these order blocks as part of their overall analysis to identify probable levels where price may change direction.
This version of the order block indicator is designed for traders, adding many indicators to their charts. The minimal design helps minimize disruptions to user focus.
🔵 Identification of Order Blocks
To identify order blocks, first, a "Level Break" must occur. To identify a "Demand Zone," a "High Level Break" is required, and to identify a "Supply Zone," a "Low Level Break" is needed.
Demand Zone :
Supply Zone :
🔵 "Change of Character" or "Market Shift Structure"
"ChoCh" or "MSS" is the "Break Level" that is contrary to the previous trend. For example, if a "Bearish Level" is established in the market and consecutive "Low Levels" are being broken, the price turns upward, breaking a "High Level." This break is called "ChoCh" or "MSS."
🔵 "Break of Structure"
"Break of Structure," or "BoS" for short, is the "Break Level" in the direction of the current trend. For example, if a "Bullish Level" is established in the market, when the price breaks a "High Level," a "BoS" has occurred.
🔵 Features
🟣 Major Level
This feature helps you easily identify major levels. These levels form when the price breaks another major level.
🟣 Refine Order Block
The "Refinement" feature allows you to adjust the width of the order block based on your strategy. There are two modes, "Aggressive" and "Defensive," in Order Block Refine. The difference between "Aggressive" and "Defensive" lies in the width of the order block. For "Risk Averse" traders, the "Defensive" mode is suitable because it provides smaller stop losses and larger reward-to-risk ratios. For "Risk Taker" traders, the "Aggressive" mode is more suitable. These traders prefer to enter trades at higher prices and this mode, where the width of the order block is greater, is more suitable for this group of individuals.
🔵 How to Use
After adding the indicator to your chart, you will see a visual similar to the image below. Green order blocks are "Demand Zones" and red order blocks are "Supply Zones." The midpoint of the order blocks also indicates 50% of it.
Refine Order Block is defaulted to On and refines the order blocks. If you want the order blocks to remain original, you should set it to Off.
Refine is defaulted to "Defensive" mode. If you want it to be in "Aggressive" mode, you should change its mode through Refine Type.
Displaying "Major Levels" is turned off by default and to display them, you should set "Show High Level" and "Show Low Level" to "Yes." You can use these lines to identify liquidity or determine stop loss and take profit levels.

VWAP 8EMA Crossover Scalping IndicatorWhy?
Everybody, especially in Indian context, from 9:15 AM to 3:30 PM, wants to trade in BankNifty.
And even 15m is Too Big timeframe for The Great Indian Options buyers. Everyone knows how potentially BankNifty (& FinNifty on Tuesday and Sensex on Friday) can show dance within 15m.
So there always been an overarching longing among traders to have something in shorter timeframes. And this 5m timeframe, looks like a universally (sic) accepted Standard Timeframe for Indian Options traders.
So here is this.
What?
The time we are publishing this public indicator Indian market (Nifty) is in ATH at ~22200.
In any such super trending market it's always good to wait for a dip and then in suitable time, enter the trade in the direction of the larger trend. The reversal trading systems, in such a situation, proves to be ineffective.
Of course there are time when market is sideways and keeps on oscillating between +/2 standard deviation of the 20 SMA. In such a situation the reversal play works perfectly. But not so in such a trending market.
So the question comes up - after a dip what's the right point to enter.
Hence comes the importance of such a crossover based trading system.
In this indicator, it's a well-known technique (nothing originally from ours, it's taken from social media, exact one we forgot) to find out the 8EMA and VWAP crossover.
So we learned from social media, practice in our daily trading a bit, actuate it and now publishing it.
A few salient points
It does not make sense to jump into the trade just on the crossover (or crossunder).
So we added some more sugar to it, e.g. we check the color the candle. Also the next candle if crosses and closes above (or below) the breakout candle's high/low.
The polarity (color) of both the alert (breakout/breakdown) and confirmation candle to be same (green for crossover, red from crossunder).
Of course, it does provider BUY and SELL alerts separately.
These all we have found out doing backtesting and forward testing with 1/2 lots and saw this sort of approaches works.
Hence all of these are added to this script.
Nomenclature
Here green line is the 8EMA and the red line is the VWAP.
Also there is a black dotted line. That's 50 EMA. It's to show you the trend.
The recent trade is shown in the top right of the chart as green (for buy) or red (for sell) with SL and 1:1 target.
How to trade using this system?
This is roughly we have found the best possible use of this indicator.
Lets explain with a bullish BUY positive crossover (means 8EMA is crossing over the daily VWAP)
Keep timeframe as 5m
Check the direction/slope of the black dotted line (50 EMA). If it's upwards, only take bullish positions.
Open the chart which has the VWAP. (e.g. FinNifty spot or MidcapNifty spot does not have vwap). So in those cases Future is the way to go.
Wait for a breakout crossover and let the indicator gives a green, triangular UP arrow.
Draw a horizontal line to the close of that candle for next few (say 6 candles i.e. 30m) candles.
Wait for the price first to retest the 8EMA or even better the VWAP (or near to the 8EMA, VWAP)
Let the price moves and closes above the horizontal line drawn in the 4th step.
Take a bullish trade, keeping VWAP as the SL and 1:1 as the target.
Additionally, Options buyer can consult ADX also to see if the ADX is more than 25 and moving up for the bullish trade. (This has to be added seperately in the chart, it's not a part of the indicator).
Mention
The concept we have taken from some social media. Forget exactly where we heard this first time. We just coded it with some additional steps.
Statutory Disclaimer
There is no silver bullet / holy grail in trading. Nothing works 100% time. One has to be careful about the loss (s)he can bear in case of the trade goes against.
We, as the author of this script, is not responsible for any trading or position decision one is taken based on the outcome of this.
It is our sole discretion to change, add, delete the portion or withdraw the whole script without any prior notice or intimation.
In Indian Context: We are not SEBI registered.

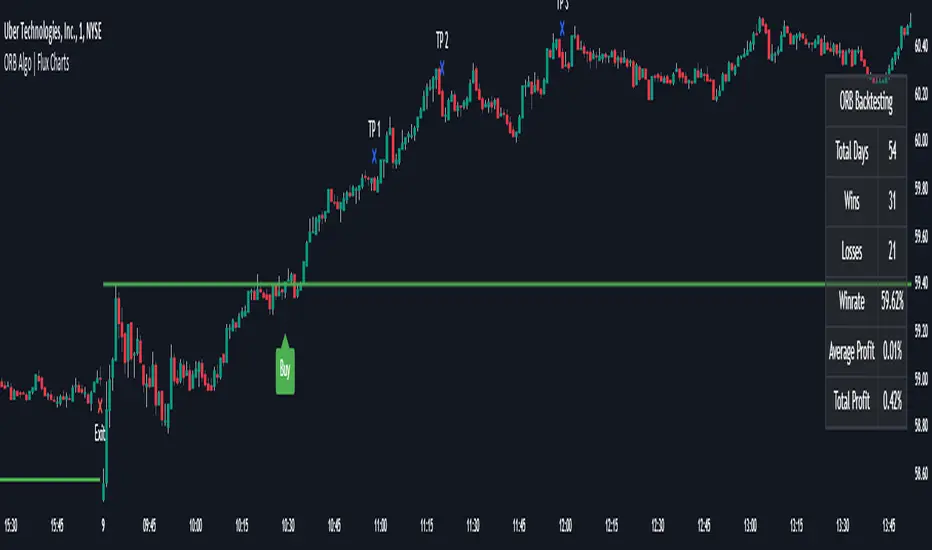
ORB Algo | Flux Charts💎 GENERAL OVERVIEW
Introducing our new ORB Algo indicator! ORB stands for "Opening Range Breakout" which is a common trading strategy. The indicator can analyze the market trend in the current session and give "Buy / Sell", "Take Profit" and "Stop Loss" signals. For more information about the analyzing process of the indicator, you can read "How Does It Work ?" section of the description.
Features of the new ORB Algo indicator :
Buy & Sell Signals
Up To 3 Take Profit Signals
Stop-Loss Signals
Alerts for Buy / Sell, Take-Profit and Stop-Loss
Customizable Algoritm
Session Dashboard
Backtesting Dashboard
📌 HOW DOES IT WORK ?
This indicator works best in 1-minute timeframe. The idea is that the trend of the current session can be forecasted by analyzing the market for a while after the session starts. However, each market has it's own dynamics and the algorithm will need fine-tuning to get the best performance possible. So, we've implemented a "Backtesting Dashboard" that shows the past performance of the algorithm in the current ticker with your current settings. Always keep in mind that past performance does not guarantee future results.
Here are the steps of the algorithm explained briefly :
1. The algorithm follows and analyzes the first 30 minutes (can be adjusted) of the session.
2. Then, algorithm checks for breakouts of the opening range's high or low.
3. If a breakout happens in a bullish or a bearish direction, the algorithm will now check for retests of the breakout. Depending on the sensitivity setting, there must be 0 / 1 / 2 / 3 failed retests for the breakout to be considered as reliable.
4. If the breakout is reliable, the algorithm will give an entry signal.
5. After the position entry, algorithm will now wait for Take-Profit or Stop-Loss zones and signal if any of them occur.
If you wonder how does the indicator find Take-Profit & Stop-Loss zones, you can check the "Settings" section of the description.
🚩UNIQUENESS
While there are indicators that show the opening range of the session, they come short with features like indicating breakouts, entries, and Take-Profit & Stop-Loss zones. We are also aware of that different stock markets have different dynamics, and tuning the algorithm for different markets is really important for better results, so we decided to make the algorithm fully customizable. Besides all that, our indicator contains a detailed backtesting dashboard, so you can see past performance of the algorithm in the current ticker. While past performance does not yield any guarantee for future results, we believe that a backtesting dashboard is necessary for tuning the algorithm. Another strength of this indicator is that there are multiple options for detection of Take-Profit and Stop-Loss zones, which the trader can select one of their liking.
⚙️SETTINGS
Keep in mind that best chart timeframe for this indicator to work is the 1-minute timeframe.
TP = Take-Profit
SL = Stop-Loss
EMA = Exponential Moving Average
OR = Opening Range
ATR = Average True Range
1. Algorithm
ORB Timeframe -> This setting determines the timeframe that the algorithm will analyze the market after a new session begins before giving any signals. It's important to experiment with this setting and find the best option that suits the current ticker for the best performance. More volatile stocks will often require this setting to be larger, while more stabilized stocks may have this setting shorter.
Sensitivity -> This setting determines how much failed retests are needed to take a position entry. Higher senstivity means that less retests are needed to consider the breakout as reliable. If you think that the current ticker makes strong movements in a bullish & bearish direction after a breakout, you should set this setting higher. If you think the opposite, meaning that the ticker does not decide the trend right after a breakout, this setting show be lower.
(High = 0 Retests, Medium = 1 Retest, Low = 2 Retests, Lowest = 3 Retests)
Breakout Condition -> The condition for the algorithm to detect breakouts.
Close = Bar needs to close higher than the OR High Line in a bullish breakout, or lower than the OR Low Line in a bearish breakout. EMA = The EMA of the bar must be higher / lower than OR Lines instead of the close price.
TP Method -> The method for the algorithm to use when determining TP zones.
Dynamic = This TP method essentially tries to find the bar that price starts declining the current trend and going to the other direction, and puts a TP zone there. To achieve this, it uses an EMA line, and when the close price of a bar crosses the EMA line, It's a TP spot.
ATR = In this TP method, instead of a dynamic approach the TP zones are pre-determined using the ATR of the entry bar. This option is generally for traders who just want to know their TP spots beforehand while trading. Selecting this option will also show TP zones at the ORB Dashboard.
"Dynamic" option generally performs better, while the "ATR" method is safer to use.
EMA Length -> This setting determines the length of the EMA line used in "Dynamic TP method" and "EMA Breakout Condition". This is completely up to the trader's choice, though the default option should generally perform well. You might want to experiment with this setting and find the optimal length for the current ticker.
Stop-Loss -> Algorithm will place the Stop-Loss zone using setting.
Safer = The SL zone will be placed closer to the OR High for a bullish entry, and closer to the OR Low for a bearish entry.
Balanced = The SL zone will be placed in the center of OR High & OR Low
Risky = The SL zone will be placed closer to the OR Low for a bullish entry, and closer to the OR High for a bearish entry.
Adaptive SL -> This option only takes effect if the first TP zone is hit.
Enabled = After the 1st TP zone is hit, the SL zone will be moved to the entry price, essentially making the position risk-free.
Disabled = The SL zone will never change.
2. ORB Dashboard
ORB Dashboard shows the information about the current session.
3. ORB Backtesting
ORB Backtesting Dashboard allows you to see past performance of the algorithm in the current ticker with current settings.
Total amount of days that can be backtested depends on your TV subscription.
Backtesting Exit Ratios -> You can select how much of percent your entry will be closed at any TP zone while backtesting. For example, %90, %5, %5 means that %90 of the position will be closed at the first TP zone, %5 of it will be closed at the 2nd TP zone, and %5 of it will be closed at the last TP zone.
Machine Learning: Optimal RSI [YinYangAlgorithms]This Indicator, will rate multiple different lengths of RSIs to determine which RSI to RSI MA cross produced the highest profit within the lookback span. This ‘Optimal RSI’ is then passed back, and if toggled will then be thrown into a Machine Learning calculation. You have the option to Filter RSI and RSI MA’s within the Machine Learning calculation. What this does is, only other Optimal RSI’s which are in the same bullish or bearish direction (is the RSI above or below the RSI MA) will be added to the calculation.
You can either (by default) use a Simple Average; which is essentially just a Mean of all the Optimal RSI’s with a length of Machine Learning. Or, you can opt to use a k-Nearest Neighbour (KNN) calculation which takes a Fast and Slow Speed. We essentially turn the Optimal RSI into a MA with different lengths and then compare the distance between the two within our KNN Function.
RSI may very well be one of the most used Indicators for identifying crucial Overbought and Oversold locations. Not only that but when it crosses its Moving Average (MA) line it may also indicate good locations to Buy and Sell. Many traders simply use the RSI with the standard length (14), however, does that mean this is the best length?
By using the length of the top performing RSI and then applying some Machine Learning logic to it, we hope to create what may be a more accurate, smooth, optimal, RSI.
Tutorial:
This is a pretty zoomed out Perspective of what the Indicator looks like with its default settings (except with Bollinger Bands and Signals disabled). If you look at the Tables above, you’ll notice, currently the Top Performing RSI Length is 13 with an Optimal Profit % of: 1.00054973. On its default settings, what it does is Scan X amount of RSI Lengths and checks for when the RSI and RSI MA cross each other. It then records the profitability of each cross to identify which length produced the overall highest crossing profitability. Whichever length produces the highest profit is then the RSI length that is used in the plots, until another length takes its place. This may result in what we deem to be the ‘Optimal RSI’ as it is an adaptive RSI which changes based on performance.
In our next example, we changed the ‘Optimal RSI Type’ from ‘All Crossings’ to ‘Extremity Crossings’. If you compare the last two examples to each other, you’ll notice some similarities, but overall they’re quite different. The reason why is, the Optimal RSI is calculated differently. When using ‘All Crossings’ everytime the RSI and RSI MA cross, we evaluate it for profit (short and long). However, with ‘Extremity Crossings’, we only evaluate it when the RSI crosses over the RSI MA and RSI <= 40 or RSI crosses under the RSI MA and RSI >= 60. We conclude the crossing when it crosses back on its opposite of the extremity, and that is how it finds its Optimal RSI.
The way we determine the Optimal RSI is crucial to calculating which length is currently optimal.
In this next example we have zoomed in a bit, and have the full default settings on. Now we have signals (which you can set alerts for), for when the RSI and RSI MA cross (green is bullish and red is bearish). We also have our Optimal RSI Bollinger Bands enabled here too. These bands allow you to see where there may be Support and Resistance within the RSI at levels that aren’t static; such as 30 and 70. The length the RSI Bollinger Bands use is the Optimal RSI Length, allowing it to likewise change in correlation to the Optimal RSI.
In the example above, we’ve zoomed out as far as the Optimal RSI Bollinger Bands go. You’ll notice, the Bollinger Bands may act as Support and Resistance locations within and outside of the RSI Mid zone (30-70). In the next example we will highlight these areas so they may be easier to see.
Circled above, you may see how many times the Optimal RSI faced Support and Resistance locations on the Bollinger Bands. These Bollinger Bands may give a second location for Support and Resistance. The key Support and Resistance may still be the 30/50/70, however the Bollinger Bands allows us to have a more adaptive, moving form of Support and Resistance. This helps to show where it may ‘bounce’ if it surpasses any of the static levels (30/50/70).
Due to the fact that this Indicator may take a long time to execute and it can throw errors for such, we have added a Setting called: Adjust Optimal RSI Lookback and RSI Count. This settings will automatically modify the Optimal RSI Lookback Length and the RSI Count based on the Time Frame you are on and the Bar Indexes that are within. For instance, if we switch to the 1 Hour Time Frame, it will adjust the length from 200->90 and RSI Count from 30->20. If this wasn’t adjusted, the Indicator would Timeout.
You may however, change the Setting ‘Adjust Optimal RSI Lookback and RSI Count’ to ‘Manual’ from ‘Auto’. This will give you control over the ‘Optimal RSI Lookback Length’ and ‘RSI Count’ within the Settings. Please note, it will likely take some “fine tuning” to find working settings without the Indicator timing out, but there are definitely times you can find better settings than our ‘Auto’ will create; especially on higher Time Frames. The Minimum our ‘Auto’ will create is:
Optimal RSI Lookback Length: 90
RSI Count: 20
The Maximum it will create is:
Optimal RSI Lookback Length: 200
RSI Count: 30
If there isn’t much bar index history, for instance, if you’re on the 1 Day and the pair is BTC/USDT you’ll get < 4000 Bar Indexes worth of data. For this reason it is possible to manually increase the settings to say:
Optimal RSI Lookback Length: 500
RSI Count: 50
But, please note, if you make it too high, it may also lead to inaccuracies.
We will conclude our Tutorial here, hopefully this has given you some insight as to how calculating our Optimal RSI and then using it within Machine Learning may create a more adaptive RSI.
Settings:
Optimal RSI:
Show Crossing Signals: Display signals where the RSI and RSI Cross.
Show Tables: Display Information Tables to show information like, Optimal RSI Length, Best Profit, New Optimal RSI Lookback Length and New RSI Count.
Show Bollinger Bands: Show RSI Bollinger Bands. These bands work like the TDI Indicator, except its length changes as it uses the current RSI Optimal Length.
Optimal RSI Type: This is how we calculate our Optimal RSI. Do we use all RSI and RSI MA Crossings or just when it crosses within the Extremities.
Adjust Optimal RSI Lookback and RSI Count: Auto means the script will automatically adjust the Optimal RSI Lookback Length and RSI Count based on the current Time Frame and Bar Index's on chart. This will attempt to stop the script from 'Taking too long to Execute'. Manual means you have full control of the Optimal RSI Lookback Length and RSI Count.
Optimal RSI Lookback Length: How far back are we looking to see which RSI length is optimal? Please note the more bars the lower this needs to be. For instance with BTC/USDT you can use 500 here on 1D but only 200 for 15 Minutes; otherwise it will timeout.
RSI Count: How many lengths are we checking? For instance, if our 'RSI Minimum Length' is 4 and this is 30, the valid RSI lengths we check is 4-34.
RSI Minimum Length: What is the RSI length we start our scans at? We are capped with RSI Count otherwise it will cause the Indicator to timeout, so we don't want to waste any processing power on irrelevant lengths.
RSI MA Length: What length are we using to calculate the optimal RSI cross' and likewise plot our RSI MA with?
Extremity Crossings RSI Backup Length: When there is no Optimal RSI (if using Extremity Crossings), which RSI should we use instead?
Machine Learning:
Use Rational Quadratics: Rationalizing our Close may be beneficial for usage within ML calculations.
Filter RSI and RSI MA: Should we filter the RSI's before usage in ML calculations? Essentially should we only use RSI data that are of the same type as our Optimal RSI? For instance if our Optimal RSI is Bullish (RSI > RSI MA), should we only use ML RSI's that are likewise bullish?
Machine Learning Type: Are we using a Simple ML Average, KNN Mean Average, KNN Exponential Average or None?
KNN Distance Type: We need to check if distance is within the KNN Min/Max distance, which distance checks are we using.
Machine Learning Length: How far back is our Machine Learning going to keep data for.
k-Nearest Neighbour (KNN) Length: How many k-Nearest Neighbours will we account for?
Fast ML Data Length: What is our Fast ML Length? This is used with our Slow Length to create our KNN Distance.
Slow ML Data Length: What is our Slow ML Length? This is used with our Fast Length to create our KNN Distance.
If you have any questions, comments, ideas or concerns please don't hesitate to contact us.
HAPPY TRADING!

Statistical Package for the Trading Sciences [SS]
This is SPTS.
It stands for Statistical Package for the Trading Sciences.
Its a play on SPSS (Statistical Package for the Social Sciences) by IBM (software that, prior to Pinescript, I would use on a daily basis for trading).
Let's preface this indicator first:
This isn't so much an indicator as it is a project. A passion project really.
This has been in the works for months and I still feel like its incomplete. But the plan here is to continue to add functionality to it and actually have the Pinecoding and Tradingview community contribute to it.
As a math based trader, I relied on Excel, SPSS and R constantly to plan my trades. Since learning a functional amount of Pinescript and coding a lot of what I do and what I relied on SPSS, Excel and R for, I use it perhaps maybe a few times a week.
This indicator, or package, has some of the key things I used Excel and SPSS for on a daily and weekly basis. This also adds a lot of, I would say, fairly complex math functionality to Pinescript. Because this is adding functionality not necessarily native to Pinescript, I have placed most, if not all, of the functionality into actual exportable functions. I have also set it up as a kind of library, with explanations and tips on how other coders can take these functions and implement them into other scripts.
The hope here is that other coders will take it, build upon it, improve it and hopefully share additional functionality that can be added into this package. Hence why I call it a project. Okay, let's get into an overview:
Current Functions of SPTS:
SPTS currently has the following functionality (further explanations will be offered below):
Ability to Perform a One-Tailed, Two-Tailed and Paired Sample T-Test, with corresponding P value.
Standard Pearson Correlation (with functionality to be able to calculate the Pearson Correlation between 2 arrays).
Quadratic (or Curvlinear) correlation assessments.
R squared Assessments.
Standard Linear Regression.
Multiple Regression of 2 independent variables.
Tests of Normality (with Kurtosis and Skewness) and recognition of up to 7 Different Distributions.
ARIMA Modeller (Sort of, more details below)
Okay, so let's go over each of them!
T-Tests
So traditionally, most correlation assessments on Pinescript are done with a generic Pearson Correlation using the "ta.correlation" argument. However, this is not always the best test to be used for correlations and determine effects. One approach to correlation assessments used frequently in economics is the T-Test assessment.
The t-test is a statistical hypothesis test used to determine if there is a significant difference between the means of two groups. It assesses whether the sample means are likely to have come from populations with the same mean. The test produces a t-statistic, which is then compared to a critical value from the t-distribution to determine statistical significance. Lower p-values indicate stronger evidence against the null hypothesis of equal means.
A significant t-test result, indicating the rejection of the null hypothesis, suggests that there is statistical evidence to support that there is a significant difference between the means of the two groups being compared. In practical terms, it means that the observed difference in sample means is unlikely to have occurred by random chance alone. Researchers typically interpret this as evidence that there is a real, meaningful difference between the groups being studied.
Some uses of the T-Test in finance include:
Risk Assessment: The t-test can be used to compare the risk profiles of different financial assets or portfolios. It helps investors assess whether the differences in returns or volatility are statistically significant.
Pairs Trading: Traders often apply the t-test when engaging in pairs trading, a strategy that involves trading two correlated securities. It helps determine when the price spread between the two assets is statistically significant and may revert to the mean.
Volatility Analysis: Traders and risk managers use t-tests to compare the volatility of different assets or portfolios, assessing whether one is significantly more or less volatile than another.
Market Efficiency Tests: Financial researchers use t-tests to test the Efficient Market Hypothesis by assessing whether stock price movements follow a random walk or if there are statistically significant deviations from it.
Value at Risk (VaR) Calculation: Risk managers use t-tests to calculate VaR, a measure of potential losses in a portfolio. It helps assess whether a portfolio's value is likely to fall below a certain threshold.
There are many other applications, but these are a few of the highlights. SPTS permits 3 different types of T-Test analyses, these being the One Tailed T-Test (if you want to test a single direction), two tailed T-Test (if you are unsure of which direction is significant) and a paired sample t-test.
Which T is the Right T?
Generally, a one-tailed t-test is used to determine if a sample mean is significantly greater than or less than a specified population mean, whereas a two-tailed t-test assesses if the sample mean is significantly different (either greater or less) from the population mean. In contrast, a paired sample t-test compares two sets of paired observations (e.g., before and after treatment) to assess if there's a significant difference in their means, typically used when the data points in each pair are related or dependent.
So which do you use? Well, it depends on what you want to know. As a general rule a one tailed t-test is sufficient and will help you pinpoint directionality of the relationship (that one ticker or economic indicator has a significant affect on another in a linear way).
A two tailed is more broad and looks for significance in either direction.
A paired sample t-test usually looks at identical groups to see if one group has a statistically different outcome. This is usually used in clinical trials to compare treatment interventions in identical groups. It's use in finance is somewhat limited, but it is invaluable when you want to compare equities that track the same thing (for example SPX vs SPY vs ES1!) or you want to test a hypothesis about an index and a leveraged share (for example, the relationship between FNGU and, say, MSFT or NVDA).
Statistical Significance
In general, with a t-test you would need to reference a T-Table to determine the statistical significance of the degree of Freedom and the T-Statistic.
However, because I wanted Pinescript to full fledge replace SPSS and Excel, I went ahead and threw the T-Table into an array, so that Pinescript can make the determination itself of the actual P value for a t-test, no cross referencing required :-).
Left tail (Significant):
Both tails (Significant):
Distributed throughout (insignificant):
As you can see in the images above, the t-test will also display a bell-curve analysis of where the significance falls (left tail, both tails or insignificant, distributed throughout).
That said, I have not included this function for the paired sample t-test because that is a bit more nuanced. But for the one and two tailed assessments, the indicator will provide you the P value.
Pearson Correlation Assessment
I don't think I need to go into too much detail on this one.
I have put in functionality to quickly calculate the Pearson Correlation of two array's, which is not currently possible with the "ta.correlation" function.
Quadratic (Curvlinear) Correlation
Not everything in life is linear, sometimes things are curved!
The Pearson Correlation is great for linear assessments, but tends to under-estimate the degree of the relationship in curved relationships. There currently is no native function to t-test for quadratic/curvlinear relationships, so I went ahead and created one.
You can see an example of how Quadratic and Pearson Correlations vary when you look at CME_MINI:ES1! against AMEX:DIA for the past 10 ish months:
Pearson Correlation:
Quadratic Correlation:
One or the other is not always the best, so it is important to check both!
R-Squared Assessments:
The R-squared value, or the square of the Pearson correlation coefficient (r), is used to measure the proportion of variance in one variable that can be explained by the linear relationship with another variable. It represents the goodness-of-fit of a linear regression model with a single predictor variable.
R-Squared is offered in 3 separate forms within this indicator. First, there is the generic R squared which is taking the square root of a Pearson Correlation assessment to assess the variance.
The next is the R-Squared which is calculated from an actual linear regression model done within the indicator.
The first is the R-Squared which is calculated from a multiple regression model done within the indicator.
Regardless of which R-Squared value you are using, the meaning is the same. R-Square assesses the variance between the variables under assessment and can offer an insight into the goodness of fit and the ability of the model to account for the degree of variance.
Here is the R Squared assessment of the SPX against the US Money Supply:
Standard Linear Regression
The indicator contains the ability to do a standard linear regression model. You can convert one ticker or economic indicator into a stock, ticker or other economic indicator. The indicator will provide you with all of the expected information from a linear regression model, including the coefficients, intercept, error assessments, correlation and R2 value.
Here is AAPL and MSFT as an example:
Multiple Regression
Oh man, this was something I really wanted in Pinescript, and now we have it!
I have created a function for multiple regression, which, if you export the function, will permit you to perform multiple regression on any variables available in Pinescript!
Using this functionality in the indicator, you will need to select 2, dependent variables and a single independent variable.
Here is an example of multiple regression for NASDAQ:AAPL using NASDAQ:MSFT and NASDAQ:NVDA :
And an example of SPX using the US Money Supply (M2) and AMEX:GLD :
Tests of Normality:
Many indicators perform a lot of functions on the assumption of normality, yet there are no indicators that actually test that assumption!
So, I have inputted a function to assess for normality. It uses the Kurtosis and Skewness to determine up to 7 different distribution types and it will explain the implication of the distribution. Here is an example of SP:SPX on the Monthly Perspective since 2010:
And NYSE:BA since the 60s:
And NVDA since 2015:
ARIMA Modeller
Okay, so let me disclose, this isn't a full fledge ARIMA modeller. I took some shortcuts.
True ARIMA modelling would involve decomposing the seasonality from the trend. I omitted this step for simplicity sake. Instead, you can select between using an EMA or SMA based approach, and it will perform an autogressive type analysis on the EMA or SMA.
I have tested it on lookback with results provided by SPSS and this actually works better than SPSS' ARIMA function. So I am actually kind of impressed.
You will need to input your parameters for the ARIMA model, I usually would do a 14, 21 and 50 day EMA of the close price, and it will forecast out that range over the length of the EMA.
So for example, if you select the EMA 50 on the daily, it will plot out the forecast for the next 50 days based on an autoregressive model created on the EMA 50. Here is how it looks on AMEX:SPY :
You can also elect to plot the upper and lower confidence bands:
Closing Remarks
So that is the indicator/package.
I do hope to continue expanding its functionality, but as of now, it does already have quite a lot of functionality.
I really hope you enjoy it and find it helpful. This. Has. Taken. AGES! No joke. Between referencing my old statistics textbooks, trying to remember how to calculate some of these things, and wanting to throw my computer against the wall because of errors in the code, this was a task, that's for sure. So I really hope you find some usefulness in it all and enjoy the ability to be able to do functions that previously could really only be done in external software.
As always, leave your comments, suggestions and feedback below!
Take care!

Filtered Volume Profile [ChartPrime]The "Filtered Volume Profile" is a powerful tool that offers insights into market activity. It's a technical analysis tool used to understand the behavior of financial markets. It uses a fixed range volume profile to provide a histogram representing how much volume occurred at distinct price levels.
Profile in action with various significant levels displayed
How to Use
The script is designed to analyze cumulative trading volumes in different price bins over a certain period, also known as `'lookback'`. This lookback period can be defined by the user and it represents the number of bars to look back for calculating levels of support and resistance.
The `'Smoothing'` input determines the degree to which the output is smoothed. Higher values lead to smoother results but may impede the responsiveness of the indicator to rapid changes in volatility.
The `'Peak Sensitivity'` input is used to adjust the sensitivity of the script's peak detection algorithm. Setting this to a lower value makes the algorithm more sensitive to local changes in trading volume and may result in "noisier" outputs.
The `'Peak Threshold'` input specifies the number of bins that the peak detection mechanism should account for. Larger numbers imply that more volume bins are taken into account, and the resultant peaks are based on wider intervals.
The `'Mean Score Length'` input is used for scaling the mean score range. This is particularly important in defining the length of lookback bars that will be used to calculate the average close price.
Sinc Filter
The application of the sinc-filter to the Filtered Volume Profile reduces the risk of viewing artefacts that may misrepresent the underlying market behavior. Sinc filtering is a high-quality and sharp filter that doesn't manifest any ringing effects, making it an optimal choice for such volume profiling.
Histogram
On the histogram, the volume profile is colored based on the balance of bullish to bearish volume. If a particular bar is more intense in color, it represents a larger than usual volume during a single price bar. This is a clear signal of a strong buying or selling pressure at a particular price level.
Threshold for Peaks
The `peak_thresh` input determines the number of bins the algorithm takes in account for the peak detection feature. The 'peak' represents the level where a significant amount of volume trading has occurred, and usually is of interest as an indicative of support or resistance level.
By increasing the `peak_thresh`, you're raising the bar for what the algorithm perceives as a peak. This could result in fewer, but more significant peaks being identified.
History of Volume Profiles and Evolution into Sinc Filtering
Volume profiling has a rich history in market analysis, dating back to the 1950s when Richard D. Wyckoff, a legendary trader, introduced the concept of volume studies. He understood the critical significance of volume and its relationship with market price movement. The core of Wyckoff's technical analysis suite was the relationship between prices and volume, often termed as "Effort vs Results".
Moving forward, in the early 1800s, the esteemed mathematician J. R. Carson made key improvements to the sinc function, which formed the basis for sinc filtering application in time series data. Following these contributions, trading studies continued to create and integrate more advanced statistical measures into market analysis.
This culminated in the 1980s with J. Peter Steidlmayer’s introduction of Market Profile. He suggested that markets were a function of continuous two-way auction processes thus introducing the concept of viewing markets in price/time continuum and price distribution forms. Steidlmayer's Market Profile was the first wide-scale operation of organized volume and price data.
However, despite the introduction of such features, challenges in the analysis persisted, especially due to noise that could misinform trading decisions. This gap has given rise to the need for smoothing functions to help eliminate the noise and better interpret the data. Among such techniques, the sinc filter has become widely recognized within the trading community.
The sinc filter, because of its properties of constructing a smooth passing through all data points precisely and its ability to eliminate high-frequency noise, has been considered a natural transition in the evolution of volume profile strategies. The superior ability of the sinc filter to reduce noise and shield against over-fitting makes it an ideal choice for smoothing purposes in trading scripts, particularly where volume profiling forms the crux of the market analysis strategy, such as in Filtered Volume Profile.
Moving ahead, the use of volume-based studies seems likely to remain a core part of technical analysis. As long as markets operate based on supply and demand principles, understanding volume will remain key to discerning the intent behind price movements. And with the incorporation of advanced methods like sinc filtering, the accuracy and insight provided by these methodologies will only improve.
Mean Score
The mean score in the Filtered Volume Profile script plays an important role in probabilistic inferences regarding future price direction. This score essentially characterizes the statistical likelihood of price trends based on historical data.
The mean score is calculated over a configurable `'Mean Score Length'`. This variable sets the window or the timeframe for calculation of the mean score of the closing prices.
Statistically, this score takes advantage of the concept of z-scores and probabilities associated with the t-distribution (a type of probability distribution that is symmetric and bell-shaped, just like the standard normal distribution, but has heavier tails).
The z-score represents how many standard deviations an element is from the mean. In this case, the "element" is the price level (Point of Control).
The mean score section of the script calculates standard errors for the root mean squared error (RMSE) and addresses the uncertainty in the prediction of the future value of a random variable.
The RMSE of a model prediction concerning observed values is used to measure the differences between values predicted by a model and the values observed.
The lower the RMSE, the better the model is able to predict. A zero RMSE means a perfect fit to the data. In essence, it's a measure of how concentrated the data is around the line of best fit.
Through the mean score, the script effectively predicts the likelihood of the future close price being above or below our identified price level.
Summary
Filtered Volume Profile is a comprehensive trading view indicator which utilizes volume profiling, peak detection, mean score computations, and sinc-filter smoothing, altogether providing the finer details of market behavior.
It offers a customizable look back period, smoothing options, and peak sensitivity setting along with a uniquely set peak threshold. The application of the Sinc Filter ensures a high level of accuracy and noise reduction in volume profiling, making this script a reliable tool for gaining market insights.
Furthermore, the use of mean score calculations provides probabilistic insights into price movements, thus providing traders with a statistically sound foundation for their trading decisions. As trading markets advance, the use of such methodologies plays a pivotal role in formulating effective trading strategies and the Filtered Volume Profile is a successful embodiment of such advancements in the field of market analysis.

Previous Day High Low Strategy only for LongWelcome to the "Previous Day High Low Strategy only for Long"!.
This strategy aims to identify potential long trading opportunities based on the previous day's high and low prices, along with certain market strength conditions.
Key Features:
Entry Conditions: The strategy triggers a long position when the current day's closing price crosses above the previous day's high or low.
Market Strength Filter: The strategy incorporates a market strength filter using the Average Directional Index (ADX). It only takes long positions when the ADX value is above a specific threshold and when there is a predominance of upward movement.
Trade Timing: The strategy operates within a specified trade window, starting at 09:30 and ending at 15:10. Positions are closed at 15:15 if still active.
Risk Management: The strategy employs dynamic stop-loss and profit-taking levels based on a user-defined Max Profit value. It has three profit targets (T1, T2, T3) and a stop-loss level to manage risk effectively.
Rules:
Ensure that the strategy idea is clearly understandable. Provide an easy-to-read title and a thoughtful description explaining the reasoning behind the strategy.
All content should be ad-free. Avoid any form of promotion, advertising, or solicitation.
No fundraising requests or money solicitation is allowed on TradingView.
Publish in the same language as the TradingView subdomain you're on, except for script titles, which must be in English.
Don't plagiarize. Create and share only unique content, and always give credit when using someone else's work.
Be respectful, kind, and constructive when engaging with others.
Zero tolerance for contentious political discourse, defamatory, threatening, or discriminatory remarks.
Avoid sharing harmful, misleading, or inappropriate content.
Respect the moderators' work and address complaints privately.
Use only your original account and avoid creating duplicate or fake accounts.
Do not attempt to manipulate the reputation system or engage in like-for-like schemes.
Explanation of how the strategy works
1. Previous Day's High and Low (HH, LL):
In this strategy, we start by obtaining the high and low prices of the previous day (not the current day) using the request.security function. This function allows us to access historical data for a specific time frame. The high and low prices are stored in the variables HH and LL, respectively.
2. Entry Conditions:
The strategy uses two conditions to trigger a long position:
Condition 1 (Long Condition 1): If the closing price of the current day crosses above the previous day's high (HH), it generates a long signal. This is achieved using the ta.crossover function, which detects when a crossover occurs.
Condition 2 (Long Condition 2): Similarly, if the closing price of the current day crosses above the previous day's low (LL), it also generates a long signal.
Combined Condition: To take long positions, the strategy combines both long conditions using the logical OR operator (or). This means that if either of the two conditions is met, a long position will be initiated.
3. Market Strength Filter:
The strategy also includes a filter based on the Average Directional Index (ADX) to gauge the market's strength before taking long positions. The ADX measures the strength of a trend in the market. The higher the ADX value, the stronger the trend.
Calculation of ADX: The ADX is calculated using the adx function, which takes two parameters: LWdilength (DMI Length) and LWadxlength (ADX period).
Strength Condition (strength_up): The strategy requires that the ADX value should be above a threshold (11 in this case) and that there is a predominance of upward movement (up > down) before initiating a long position. The LWADX value is multiplied by 2.5 and compared to the highest value of LWADX from the last 4 periods using ta.highest(LWADX , 4). If these conditions are met, the variable strength_up is set to true.
Combined Condition: The strength_up condition is then combined with the long conditions using the logical AND operator (and). This means that the strategy will only take a long position if both the long conditions and the market strength condition are met.
4. Trade Timing:
The strategy sets a specific trade window between 09:30 and 15:10. It will only execute trades within this time frame (TradeTime).
5. Risk Management:
The strategy implements dynamic stop-loss (SL) and profit-taking levels (T1, T2, T3) based on a user-defined Max Profit value. The stop-loss is set as a percentage of the Max Profit value. As the position moves in favor of the trader, the profit targets are adjusted accordingly.
6. Position Management:
The strategy uses the strategy.entry function to enter long positions based on the combined entry conditions. Once a position is open, the script uses strategy.exit to define the exit condition when either the profit target or stop-loss level is hit. The strategy.close function is used to close any open position at the end of the trade window (15:15).
7. Plotting:
The strategy uses the plot function to visualize the previous day's high and low prices, as well as the stop-loss (SL) and profit-taking (T1, T2, T3) levels on the chart.
Overall, the "Previous Day High Low Strategy only for Long" aims to identify potential long trading opportunities based on the previous day's price action and market strength conditions. However, as with any trading strategy, it's essential to thoroughly test it and consider risk management before applying it to real-world trading scenarios.
Disclaimer:
The information presented by this strategy is for educational purposes only and should not be considered as investment advice. The strategy is not designed for qualified investors. Always conduct your own research and consult with a financial advisor before making any trading decisions.
Remember, the success of any trading strategy depends on various factors, including market conditions, risk management, and individual trading skills. Past performance is not indicative of future results.

Bracket Trading VisualizerThe Bracket Trading Visualizer highlights locations in the past when a bracket trade would of won.
🔶 Purpose
Show the opportunities a trader had in the past to give a intuitive idea of how to trade the chart.
🔶 How It Works
Red color indicates the location a Short would of won.
Green color indicates the location a Long would of won.
Yellow color indicates the location a Long OR Short would of won.
Empty color indicates the location a Long OR Short would of Lost.
Empty color also indicates undecided, especially on the latest candles as the future has not been drawn yet.
🔶 What Is A Bracket Trade?
A bracket trade is when your take profit and stop loss are automatically set on entry.
Example: Take profit is set to 1%, Stop loss is set to 1%, when entering a trade the take and stop will set above and bellow the entry price by 1% each.
🔶 More Info
The default Take%/Stop% need to be increased for higher time frames as each candle moves larger distances.
The indicator crawls from left to right on each candle to check what part of that candle was a win for longs and shorts.
This Indicator updates past data based on current information, so empty areas are being filled in as new candles are created.
Because of pinescript limitations the script can only see 375 bars into the future. If a trade takes longer then 375 bars to finalize it will be empty color.
🔶 Theme Setup
It wont look as good with basic candles so set candles to "Bars" and color them white.
🔶 Experiments
Set a take profit larger then the stop loss and look at the opportunities, notice how there are Less.
Set a Stop Loss larger then the take profit and look at the opportunities, notice how there are More, including yellow overlaping.
🔶 Settings
Take %: Take Profit percent distance from the entry price
Stop %: Stop Loss percent distance from the entry price
Commission %: Commission is calculated twice for entry and exit. A 0.03% commission will increase take profit by 0.06% and decrease stop loss by 0.06%.
Calculation Bars Back: If you need to see more candles into the past increase this number, its purpose is to speed up calculation time, Higher number is slower. Also if things aren't drawing properly zoom out all the way then zoom back in.
🔶 Community
I hope you guys find this useful, if you have any questions or feature requests leave me a comment! Take care :D

FalconRed 5 EMA Indicator (Powerofstocks)Improved version:
This indicator is based on Subhashish Pani's "Power of Stocks" 5 EMA Strategy, which aims to identify potential buying and selling opportunities in the market. The indicator plots the 5 EMA (Exponential Moving Average) and generates Buy/Sell signals with corresponding Target and Stoploss levels.
Subhashish Pani's 5 EMA Strategy is a straightforward approach. For intraday trading, a 5-minute timeframe is recommended for selling. In this strategy, you can choose to sell futures, sell calls, or buy puts as part of your selling strategy. The goal is to capture market tops by selling at the peak, anticipating a reversal for profitable trades. Although this strategy may result in frequent stop losses, they are typically small, while the minimum target should be at least three times the risk taken. By staying aligned with the trend, significant profits can be achieved. Subhashish Pani claims that this strategy has a 60% success rate.
Strategy for Selling (Short Future/Call/Stock or Buy Put):
1. When a candle completely closes above the 5 EMA (with no part of the candle touching the 5 EMA), it is considered an Alert Candle.
2. If the next candle is also entirely above the 5 EMA and does not break the low of the previous Alert Candle, ignore the previous Alert Candle and consider the new candle as the new Alert Candle.
3. Continue shifting the Alert Candle in this manner. However, when the next candle breaks the low of the Alert Candle, take a short trade (e.g., short futures, calls, stocks, or buy puts).
4. Set the stop loss above the high of the Alert Candle, and the minimum target should be 1:3 (at least three times the stop loss).
Strategy for Buying (Buy Future/Call/Stock or Sell Put):
1. When a candle completely closes below the 5 EMA (with no part of the candle touching the 5 EMA), it is considered an Alert Candle.
2. If the next candle is also entirely below the 5 EMA and does not break the high of the previous Alert Candle, ignore the previous Alert Candle and consider the new candle as the new Alert Candle.
3. Continue shifting the Alert Candle in this manner. However, when the next candle breaks the high of the Alert Candle, take a long trade (e.g., buy futures, calls, stocks, or sell puts).
4. Set the stop loss below the low of the Alert Candle, and the minimum target should be 1:3 (at least three times the stop loss).
Buy/Sell with Additional Conditions:
An additional condition is added to the buying/selling strategy:
1. Check if the closing price of the current candle is lower than the closing price of the Alert Candle for selling, or higher than the closing price of the Alert Candle for buying.
- This condition aims to filter out false moves, potentially preventing entering trades based on temporary fluctuations. However, it may cause you to miss out on significant moves, as you will enter trades after the candle closes, rather than at the breakout point.
Note: According to Subhashish Pani, the recommended timeframe for intraday buying is 15 minutes. However, this strategy can also be applied to positional/swing trading. If used on a monthly timeframe, it can be beneficial for long-term investing as well. The rules remain the same for all types of trades and timeframes.
If you need a deeper understanding of this strategy, you can search for "Subhashish Pani's (Power of Stocks) 5 EMA Strategy" on YouTube for further explanations.
Note: This strategy is not limited to intraday trading and can be applied to positional/swing
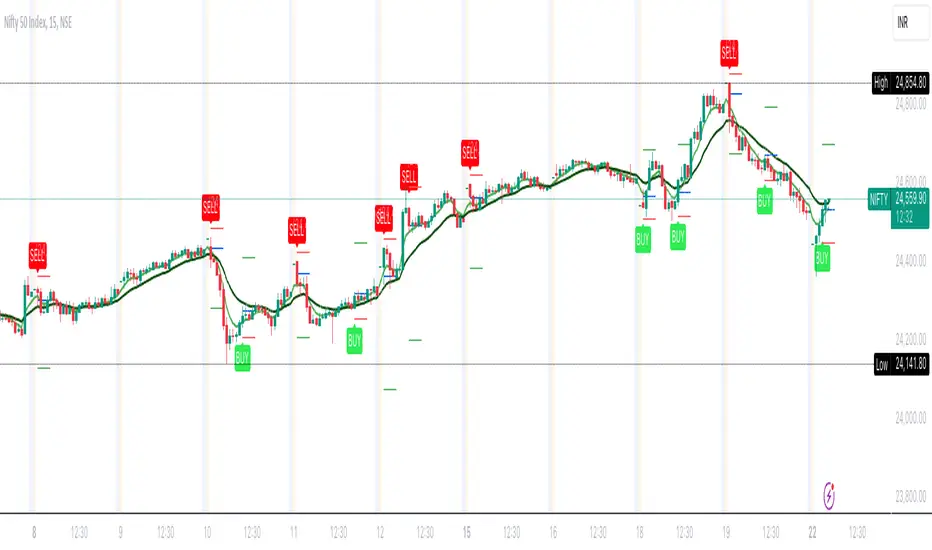
ICT Donchian Smart Money Structure (Expo)█ Concept Overview
The Inner Circle Trader (ICT) methodology is focused on understanding the actions and implications of the so-called "smart money" - large institutions and professional traders who often influence market movements. Key to this is the concept of market structure and how it can provide insights into potential price moves.
Over time, however, there has been a notable shift in how some traders interpret and apply this methodology. Initially, it was designed with a focus on the fractal nature of markets. Fractals are recurring patterns in price action that are self-similar across different time scales, providing a nuanced and dynamic understanding of market structure.
However, as the ICT methodology has grown in popularity, there has been a drift away from this fractal-based perspective. Instead, many traders have started to focus more on pivot points as their primary tool for understanding market structure.
Pivot points provide static levels of potential support and resistance. While they can be useful in some contexts, relying heavily on them could provide a skewed perspective of market structure. They offer a static, backward-looking view that may not accurately reflect real-time changes in market sentiment or the dynamic nature of markets.
This shift from a fractal-based perspective to a pivot point perspective has significant implications. It can lead traders to misinterpret market structure and potentially make incorrect trading decisions.
To highlight this issue, you've developed a Donchian Structure indicator that mirrors the use of pivot points. The Donchian Channels are formed by the highest high and the lowest low over a certain period, providing another representation of potential market extremes. The fact that the Donchian Structure indicator produces the same results as pivot points underscores the inherent limitations of relying too heavily on these tools.
While the Donchian Structure indicator or pivot points can be useful tools, they should not replace the original, fractal-based perspective of the ICT methodology. These tools can provide a broad overview of market structure but may not capture the intricate dynamics and real-time changes that a fractal-based approach can offer.
It's essential for traders to understand these differences and to apply these tools correctly within the broader context of the ICT methodology and the Smart Money Concept Structure. A well-rounded approach that incorporates fractals, along with other tools and forms of analysis, is likely to provide a more accurate and comprehensive understanding of market structure.
█ Smart Money Concept - Misunderstandings
The Smart Money Concept is a popular concept among traders, and it's based on the idea that the "smart money" - typically large institutional investors, market makers, and professional traders - have superior knowledge or information, and their actions can provide valuable insight for other traders.
One of the biggest misunderstandings with this concept is the belief that tracking smart money activity can guarantee profitable trading.
█ Here are a few common misconceptions:
Following Smart Money Equals Guaranteed Success: Many traders believe that if they can follow the smart money, they will be successful. However, tracking the activity of large institutional investors and other professionals isn't easy, as they use complex strategies, have access to information not available to the public, and often intentionally hide their moves to prevent others from detecting their strategies.
Instantaneous Reaction and Results: Another misconception is that market movements will reflect smart money actions immediately. However, large institutions often slowly accumulate or distribute positions over time to avoid moving the market drastically. As a result, their actions might not produce an immediate noticeable effect on the market.
Smart Money Always Wins: It's not accurate to assume that smart money always makes the right decisions. Even the most experienced institutional investors and professional traders make mistakes, misjudge market conditions, or are affected by unpredictable events.
Smart Money Activity is Transparent: Understanding what constitutes smart money activity can be quite challenging. There are many indicators and metrics that traders use to try and track smart money, such as the COT (Commitments of Traders) reports, Level II market data, block trades, etc. However, these can be difficult to interpret correctly and are often misleading.
Assuming Uniformity Among Smart Money: 'Smart Money' is not a monolithic entity. Different institutional investors and professional traders have different strategies, risk tolerances, and investment horizons. What might be a good trade for a long-term institutional investor might not be a good trade for a short-term professional trader, and vice versa.
█ Market Structure
The Smart Money Concept Structure deals with the interpretation of price action that forms the market structure, focusing on understanding key shifts or changes in the market that may indicate where 'smart money' (large institutional investors and professional traders) might be moving in the market.
█ Three common concepts in this regard are Change of Character (CHoCH), and Shift in Market Structure (SMS), Break of Structure (BMS/BoS).
Change of Character (CHoCH): This refers to a noticeable change in the behavior of price movement, which could suggest that a shift in the market might be about to occur. This might be signaled by a sudden increase in volatility, a break of a trendline, or a change in volume, among other things.
Shift in Market Structure (SMS): This is when the overall structure of the market changes, suggesting a potential new trend. It usually involves a sequence of lower highs and lower lows for a downtrend, or higher highs and higher lows for an uptrend.
Break of Structure (BMS/BoS): This is when a previously defined trend or pattern in the price structure is broken, which may suggest a trend continuation.
A key component of this approach is the use of fractals, which are repeating patterns in price action that can give insights into potential market reversals. They appear at all scales of a price chart, reflecting the self-similar nature of markets.
█ Market Structure - Misunderstandings
One of the biggest misunderstandings about the ICT approach is the over-reliance or incorrect application of pivot points. Pivot points are a popular tool among traders due to their simplicity and easy-to-understand nature. However, when it comes to the Smart Money Concept and trying to follow the steps of professional traders or large institutions, relying heavily on pivot points can create misconceptions and lead to confusion. Here's why:
Delayed and Static Information: Pivot points are inherently backward-looking because they're calculated based on the previous period's data. As such, they may not reflect real-time market dynamics or sudden changes in market sentiment. Furthermore, they present a static view of market structure, delineating pre-defined levels of support and resistance. This static nature can be misleading because markets are fundamentally dynamic and constantly changing due to countless variables.
Inadequate Representation of Market Complexity: Markets are influenced by a myriad of factors, including economic indicators, geopolitical events, institutional actions, and market sentiment, among others. Relying on pivot points alone for reading market structure oversimplifies this complexity and can lead to a myopic understanding of market dynamics.
False Signals and Misinterpretations: Pivot points can often give false signals, especially in volatile markets. Prices might react to these levels temporarily but then continue in the original direction, leading to potential misinterpretation of market structure and sentiment. Also, a trader might wrongly perceive a break of a pivot point as a significant market event, when in fact, it could be due to random price fluctuations or temporary volatility.
Over-simplification: Viewing market structure only through the lens of pivot points simplifies the market to static levels of support and resistance, which can lead to misinterpretation of market dynamics. For instance, a trader might view a break of a pivot point as a definite sign of a trend, when it could just be a temporary price spike.
Ignoring the Fractal Nature of Markets: In the context of the Smart Money Concept Structure, understanding the fractal nature of markets is crucial. Fractals are self-similar patterns that repeat at all scales and provide a more dynamic and nuanced understanding of market structure. They can help traders identify shifts in market sentiment or direction in real-time, providing more relevant and timely information compared to pivot points.
The key takeaway here is not that pivot points should be entirely avoided or that they're useless. They can provide valuable insights and serve as a useful tool in a trader's toolbox when used correctly. However, they should not be the sole or primary method for understanding the market structure, especially in the context of the Smart Money Concept Structure.
█ Fractals
Instead, traders should aim for a comprehensive understanding of markets that incorporates a range of tools and concepts, including but not limited to fractals, order flow, volume analysis, fundamental analysis, and, yes, even pivot points. Fractals offer a more dynamic and nuanced view of the market. They reflect the recursive nature of markets and can provide valuable insights into potential market reversals. Because they appear at all scales of a price chart, they can provide a more holistic and real-time understanding of market structure.
In contrast, the Smart Money Concept Structure, focusing on fractals and comprehensive market analysis, aims to capture a more holistic and real-time view of the market. Fractals, being self-similar patterns that repeat at different scales, offer a dynamic understanding of market structure. As a result, they can help to identify shifts in market sentiment or direction as they happen, providing a more detailed and timely perspective.
Furthermore, a comprehensive market analysis would consider a broader set of factors, including order flow, volume analysis, and fundamental analysis, which could provide additional insights into 'smart money' actions.
█ Donchian Structure
Donchian Channels are a type of indicator used in technical analysis to identify potential price breakouts and trends, and they may also serve as a tool for understanding market structure. The channels are formed by taking the highest high and the lowest low over a certain number of periods, creating an envelope of price action.
Donchian Channels (or pivot points) can be useful tools for providing a general view of market structure, and they may not capture the intricate dynamics associated with the Smart Money Concept Structure. A more nuanced approach, centered on real-time fractals and a comprehensive analysis of various market factors, offers a more accurate understanding of 'smart money' actions and market structure.
█ Here is why Donchian Structure may be misleading:
Lack of Nuance: Donchian Channels, like pivot points, provide a simplified view of market structure. They don't take into account the nuanced behaviors of price action or the complex dynamics between buyers and sellers that can be critical in the Smart Money Concept Structure.
Limited Insights into 'Smart Money' Actions: While Donchian Channels can highlight potential breakout points and trends, they don't necessarily provide insights into the actions of 'smart money'. These large institutional traders often use sophisticated strategies that can't be easily inferred from price action alone.
█ Indicator Overview
We have built this Donchian Structure indicator to show that it returns the same results as using pivot points. The Donchian Structure indicator can be a useful tool for market analysis. However, it should not be seen as a direct replacement or equivalent to the original Smart Money concept, nor should any indicator based on pivot points. The indicator highlights the importance of understanding what kind of trading tools we use and how they can affect our decisions.
The Donchian Structure Indicator displays CHoCH, SMS, BoS/BMS, as well as premium and discount areas. This indicator plots everything in real-time and allows for easy backtesting on any market and timeframe. A unique candle coloring has been added to make it more engaging and visually appealing when identifying new trading setups and strategies. This candle coloring is "leading," meaning it can signal a structural change before it actually happens, giving traders ample time to plan their next trade accordingly.
█ How to use
The indicator is great for traders who want to simplify their view on the market structure and easily backtest Smart Money Concept Strategies. The added candle coloring function serves as a heads-up for structure change or can be used as trend confirmation. This new candle coloring feature can generate many new Smart Money Concepts strategies.
█ Features
Market Structure
The market structure is based on the Donchian channel, to which we have added what we call 'Structure Response'. This addition makes the indicator more useful, especially in trending markets. The core concept involves traders buying at a discount and selling or shorting at a premium, depending on the order flow. Structure response enables traders to determine the order flow more clearly. Consequently, more trading opportunities will appear in trending markets.
Structure Candles
Structure Candles highlight the current order flow and are significantly more responsive to structural changes. They can provide traders with a heads-up before a break in structure occurs
-----------------
Disclaimer
The information contained in my Scripts/Indicators/Ideas/Algos/Systems does not constitute financial advice or a solicitation to buy or sell any securities of any type. I will not accept liability for any loss or damage, including without limitation any loss of profit, which may arise directly or indirectly from the use of or reliance on such information.
All investments involve risk, and the past performance of a security, industry, sector, market, financial product, trading strategy, backtest, or individual's trading does not guarantee future results or returns. Investors are fully responsible for any investment decisions they make. Such decisions should be based solely on an evaluation of their financial circumstances, investment objectives, risk tolerance, and liquidity needs.
My Scripts/Indicators/Ideas/Algos/Systems are only for educational purposes!

Cobra's CryptoMarket VisualizerCobra's Crypto Market Screener is designed to provide a comprehensive overview of the top 40 marketcap cryptocurrencies in a table\heatmap format. This indicator incorporates essential metrics such as Beta, Alpha, Sharpe Ratio, Sortino Ratio, Omega Ratio, Z-Score, and Average Daily Range (ADR). The table utilizes cell coloring resembling a heatmap, allowing for quick visual analysis and comparison of multiple cryptocurrencies.
The indicator also includes a shortened explanation tooltip of each metric when hovering over it's respected cell. I shall elaborate on each here for anyone interested.
Metric Descriptions:
1. Beta: measures the sensitivity of an asset's returns to the overall market returns. It indicates how much the asset's price is likely to move in relation to a benchmark index. A beta of 1 suggests the asset moves in line with the market, while a beta greater than 1 implies the asset is more volatile, and a beta less than 1 suggests lower volatility.
2. Alpha: is a measure of the excess return generated by an investment compared to its expected return, given its risk (as indicated by its beta). It assesses the performance of an investment after adjusting for market risk. Positive alpha indicates outperformance, while negative alpha suggests underperformance.
3. Sharpe Ratio: measures the risk-adjusted return of an investment or portfolio. It evaluates the excess return earned per unit of risk taken. A higher Sharpe ratio indicates better risk-adjusted performance, as it reflects a higher return for each unit of volatility or risk.
4. Sortino Ratio: is a risk-adjusted measure similar to the Sharpe ratio but focuses only on downside risk. It considers the excess return per unit of downside volatility. The Sortino ratio emphasizes the risk associated with below-target returns and is particularly useful for assessing investments with asymmetric risk profiles.
5. Omega Ratio: measures the ratio of the cumulative average positive returns to the cumulative average negative returns. It assesses the reward-to-risk ratio by considering both upside and downside performance. A higher Omega ratio indicates a higher reward relative to the risk taken.
6. Z-Score: is a statistical measure that represents the number of standard deviations a data point is from the mean of a dataset. In finance, the Z-score is commonly used to assess the financial health or risk of a company. It quantifies the distance of a company's financial ratios from the average and provides insight into its relative position.
7. Average Daily Range: ADR represents the average range of price movement of an asset during a trading day. It measures the average difference between the high and low prices over a specific period. Traders use ADR to gauge the potential price range within which an asset might fluctuate during a typical trading session.
Utility:
Comprehensive Overview: The indicator allows for monitoring up to 40 cryptocurrencies simultaneously, providing a consolidated view of essential metrics in a single table.
Efficient Comparison: The heatmap-like coloring of the cells enables easy visual comparison of different cryptocurrencies, helping identify relative strengths and weaknesses.
Risk Assessment: Metrics such as Beta, Alpha, Sharpe Ratio, Sortino Ratio, and Omega Ratio offer insights into the risk associated with each cryptocurrency, aiding risk assessment and portfolio management decisions.
Performance Evaluation: The Alpha, Sharpe Ratio, and Sortino Ratio provide measures of a cryptocurrency's performance adjusted for risk. This helps assess investment performance over time and across different assets.
Market Analysis: By considering the Z-Score and Average Daily Range (ADR), traders can evaluate the financial health and potential price volatility of cryptocurrencies, aiding in trade selection and risk management.
Features:
Reference period optimization, alpha and ADR in particular
Source calculation
Table sizing and positioning options to fit the user's screen size.
Tooltips
Important Notes -
1. The Sharpe, Sortino and Omega ratios cell coloring threshold might be subjective, I did the best I can to gauge the median value of each to provide more accurate coloring sentiment, it may change in the future.
The median values are : Sharpe -1, Sortino - 1.5, Omega - 20.
2. Limitations - Some cryptos have a Z-Score value of NaN due to their short lifetime, I tried to overcome this issue as with the rest of the metrics as best I can. Moreover, it limits the time horizon for replay mode to somewhere around Q3 of 2021 and that's with using the split option of the top half, to remain with the older cryptos.
3. For the beginner Pine enthusiasts, I recommend scimming through the script as it serves as a prime example of using key features, to name a few : Arrays, User Defined Functions, User Defined Types, For loops, Switches and Tables.
4. Beta and Alpha's benchmark instrument is BTC, due to cryptos volatility I saw no reason to use SPY or any other asset for that matter.

Dominant Period-Based Moving Average (DPBMA)Exploit Market Cycles with the Dominant Period-Based Moving Average Indicator
Introduction:
In the world of trading, market cycles play a crucial role in determining the rhythm of the market. These cycles often consist of recurring patterns that traders can exploit to maximize their profits. One effective way to capitalize on these cycles is by using a moving average (MA) indicator. Today, we are going to introduce you to a unique indicator that takes the most frequent dominant period of the market and uses it as the length of the moving average. This indicator is designed to adapt to the ever-changing market conditions, providing traders with a dynamic tool to better analyze the market.
Dominant Period-Based Moving Average Indicator Overview:
The Dominant Period-Based Moving Average (DPBMA) Indicator is a custom indicator designed to find the most frequent dominant period of the market and use that period as the length of the moving average. This innovative approach allows the indicator to adapt to the market cycles, making it more responsive to the market's changing conditions.
Here's a quick overview of the DPBMA Indicator's features:
Takes the most frequent dominant period of the market.
Uses the dominant period as the length of the moving average.
Adapts to the changing market cycles.
Works as an overlay on your price chart.
Using the Dominant Period-Based Moving Average Indicator:
How the Dominant Period-Based Moving Average Indicator Works:
The DPBMA Indicator works by first importing the DominantCycle function from the lastguru/DominantCycle/2 script. This function calculates the dominant cycle period of the given market data. The DPBMA Indicator then calculates the Exponential Moving Average (EMA) using the dominant period as the length parameter.
The EMA calculation uses an alpha factor, which is calculated as 2 / (length + 1). The alpha factor is then used to smooth the source data (closing prices) and calculate the adaptive moving average.
The DPBMA Indicator also includes a harmonic input, which allows you to multiply the dominant cycle period by an integer value. This can help you fine-tune the indicator to better fit your trading strategy or style.
The Raw Dominant Frequency:
The raw dominant frequency represents the primary cycle period present in the given market data. By identifying the raw dominant frequency, traders can gain insights into the market's current cycle and use this information to make informed trading decisions. The raw dominant frequency can be useful for detecting major trend reversals, support and resistance levels, and potential entry and exit points.
However, using the raw dominant frequency alone has its limitations. For instance, it may not always provide a clear picture of the market's prevailing trend, especially during periods of high market volatility. Additionally, relying solely on the raw dominant frequency may not capture the nuances of shorter-term cycles that can also impact price movements.
The Most Likely Dominant Frequency:
Our approach takes a different angle by focusing on the most likely dominant frequency. This method aims to identify the frequency with the highest probability of being the dominant frequency in the market data. The idea behind this approach is to filter out potential noise and improve the accuracy of the dominant frequency analysis. By using the most likely dominant frequency, traders can gain a more reliable understanding of the market's primary cycle, which can lead to better trading decisions.
In our Dominant Period-Based Moving Average Indicator, we calculate the most likely dominant frequency by analyzing an array of cycle periods and their occurrences in the given market data. We then determine the cycle period with the highest occurrence, representing the most likely dominant frequency. This method allows the indicator to be more adaptive and responsive to the changing market conditions, capturing the nuances of both long-term and short-term cycles.
Why Not the Average Dominant Frequency?
While using the average dominant frequency might seem like a reasonable approach, it can be less effective in accurately capturing the market's primary cycle. Averaging the dominant frequencies may dilute the impact of the true dominant frequency, resulting in a less accurate representation of the market's current cycle. By focusing on the most likely dominant frequency, our approach provides a more accurate and reliable analysis of the market's primary cycle, which can ultimately lead to more effective trading decisions.
Conclusion:
The Dominant Period-Based Moving Average Indicator, enhanced with the most likely dominant frequency approach, offers traders a powerful tool for exploiting market cycles. By adapting to the most frequent dominant period and focusing on the most likely dominant frequency, this indicator provides a more accurate and reliable analysis of the market's primary cycle. As a result, traders can make better-informed decisions, ultimately leading to improved trading performance. Incorporate the DPBMA Indicator into your trading toolbox today, and take advantage of the enhanced market analysis it provides.
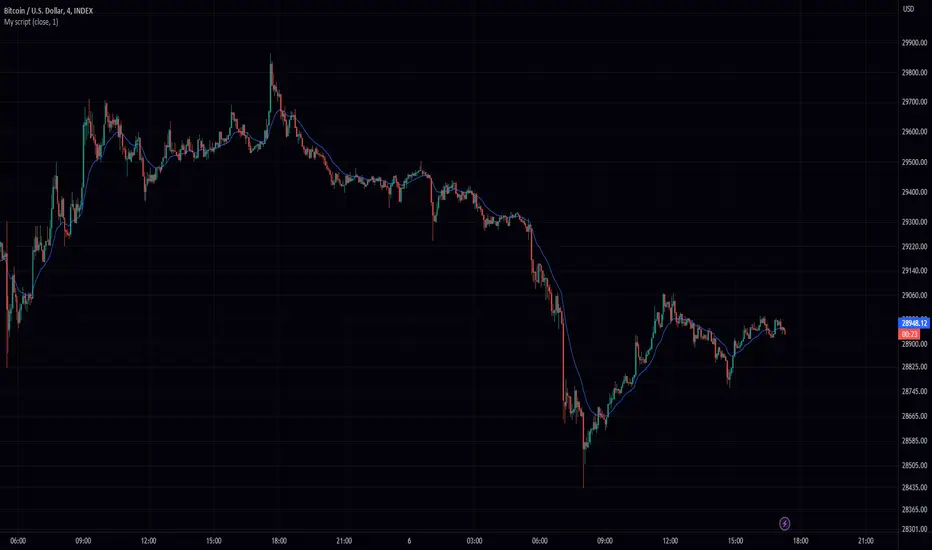
Radar RiderThe Radar Rider indicator is a powerful tool that combines multiple technical indicators into a single spider plot, providing traders with a comprehensive view of market conditions. This article will delve into the workings of each built-in indicator and their arrangement within the spider plot. To better understand the structure of the script, let's first examine some of the primary functions and how they are utilized in the script.
Normalize Function: normalize(close, len)
The normalize function takes the close price and a length as arguments and normalizes the price data by scaling it between 0 and 1, making it easier to compare different indicators.
Exponential Moving Average (EMA) Filter: bes(source, alpha)
The EMA filter is used to smooth out data using an exponential moving average, with the given alpha value defining the level of smoothing. This helps reduce noise and enhance the trend-following characteristics of the indicators.
Maximum and Minimum Functions: max(src) and min(src)
These functions find the maximum and minimum values of the input data over a certain period, respectively. These values are used in the normalization process and can help identify extreme conditions in the market.
Min-Max Function: min_max(src)
The min-max function scales the input data between 0 and 100 by dividing the difference between the data point and the minimum value by the range between the maximum and minimum values. This standardizes the data, making it easier to compare across different indicators.
Slope Function: slope(source, length, n_len, pre_smoothing = 0.15, post_smoothing = 0.7)
The slope function calculates the slope of a given data source over a specified length, and then normalizes it using the provided normalization length. Pre-smoothing and post-smoothing values can be adjusted to control the level of smoothing applied to the data before and after calculating the slope.
Percent Function: percent(x, y)
The percent function calculates the percentage difference between two values, x and y. This is useful for comparing the relative change in different indicators.
In the given code, there are multiple indicators included. Here, we will discuss each of them in detail.
EMA Diff:
The Exponential Moving Average (EMA) Diff is the difference between two EMA values of different lengths. The EMA is a type of moving average that gives more weight to recent data points. The EMA Diff helps traders identify trends and potential trend reversals. In the code, the EMA Diff is calculated using the ema_diff() function, which takes length, close, filter, and len_norm as parameters.
Percent Rank EMA Diff:
The Percent Rank EMA Diff is the percentage rank of the EMA Diff within a given range. It helps traders identify overbought or oversold conditions in the market. In the code, the Percent Rank EMA Diff is calculated using the percent_rank_ema_diff() function, which takes length, close, filter, and len_norm as parameters.
EMA Diff Longer:
The EMA Diff Longer is the difference between two EMA values of different lengths, similar to EMA Diff but with a longer period. In the code, the EMA Diff Longer is calculated using the ema_diff_longer() function, which takes length, close, filter, and len_norm as parameters.
RSI Filter:
The Relative Strength Index (RSI) is a momentum oscillator that measures the speed and change of price movements. The RSI Filter is the RSI value passed through a filter to smooth out the data. In the code, the RSI Filter is calculated using the rsi_filter() function, which takes length, close, and filter as parameters.
RSI Diff Normalized:
The RSI Diff Normalized is the normalized value of the derivative of the RSI. It helps traders identify potential trend reversals in the market. In the code, the RSI Diff Normalized is calculated using the rsi_diff_normalized() function, which takes length, close, filter, len_mad, and len_norm as parameters.
Z Score:
The Z Score is a statistical measurement that describes a value's relationship to the mean of a group of values. In the context of the code, the Z Score is calculated for the closing price of a security. The z_score() function takes length, close, filter, and len_norm as parameters.
EMA Normalized:
The EMA Normalized is the normalized value of the EMA, which helps traders identify trends and potential trend reversals in the market. In the code, the EMA Normalized is calculated using the ema_normalized() function, which takes length, close, filter, and len_norm as parameters.
WMA Volume Normalized:
The Weighted Moving Average (WMA) Volume Normalized is the normalized value of the WMA of the volume. It helps traders identify volume trends and potential trend reversals in the market. In the code, the WMA Volume Normalized is calculated using the wma_volume_normalized() function, which takes length, volume, filter, and len_norm as parameters.
EMA Close Diff Normalized:
The EMA Close Diff Normalized is the normalized value of the derivative of the EMA of the closing price. It helps traders identify potential trend reversals in the market. In the code, the EMA Close Diff Normalized is calculated using the ema_close_diff_normalized() function, which takes length, close, filter, len_mad, and len_norm as parameters.
Momentum Normalized:
The Momentum Normalized is the normalized value of the momentum, which measures the rate of change of a security's price. It helps traders identify trends and potential trend reversals in the market. In the code, the Momentum Normalized is calculated using the momentum_normalized() function, which takes length, close, filter, and len_norm as parameters.
Slope Normalized:
The Slope Normalized is the normalized value of the slope, which measures the rate of change of a security's price over a specified period. It helps traders identify trends and potential trend reversals in the market. In the code, the Slope Normalized is calculated using the slope_normalized() function, which takes length, close, filter, and len_norm as parameters.
Trend Intensity:
Trend Intensity is a measure of the strength of a security's price trend. It is based on the difference between the average of price increases and the average of price decreases over a given period. The trend_intensity() function in the code calculates the Trend Intensity by taking length, close, filter, and len_norm as parameters.
Volatility Ratio:
The Volatility Ratio is a measure of the volatility of a security's price, calculated as the ratio of the True Range (TR) to the Exponential Moving Average (EMA) of the TR. The volatility_ratio() function in the code calculates the Volatility Ratio by taking length, high, low, close, and filter as parameters.
Commodity Channel Index (CCI):
The Commodity Channel Index (CCI) is a momentum-based oscillator used to help determine when an investment vehicle is reaching a condition of being overbought or oversold. The CCI is calculated as the difference between the mean price of a security and its moving average, divided by the mean absolute deviation (MAD) of the mean price. In the code, the CCI is calculated using the cci() function, which takes length, high, low, close, and filter as parameters.
These indicators are combined in the code to create a comprehensive trading strategy that considers multiple factors such as trend strength, momentum, volatility, and overbought/oversold conditions. The combined analysis provided by these indicators can help traders make informed decisions and improve their chances of success in the market.
The Radar Rider indicator is a powerful tool that combines multiple technical indicators into a single, easy-to-read visualization. By understanding the inner workings of each built-in indicator and their arrangement within the spider plot, traders can better interpret market conditions and make informed trading decisions.
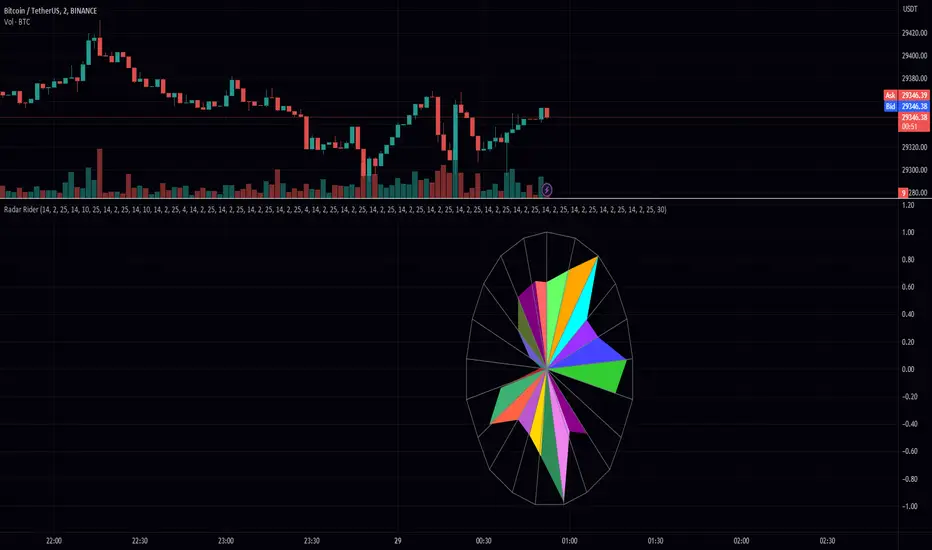
Crypto Uptrend Script + Pullback//Volume CandlesDescription: his is an adaption of my Pullback candle - This works on all timeframes and Markets (Forex//Stocks//)
Crypto Uptrend Script with Pullback Candle allows traders to get into a trend when the price is at end of a pullback and entering a balance phase in the market (works on all markets). The use of Moving averages to help identify a Trends and the use of Key levels to help traders be aware of where strong areas are in the market.
This script can work really well in Crypto Bull Runs when used on HTF and with confluences
The script has key support and resistance zones which are made up of quarterly data. Price reacts to these areas but patience is required as price will take time to come into these areas
I have updated the Pullback Candle with the use of Volume to filter out the weak Pullback Candles -
There are new candles to the script.
The First candle is the Bullish Volume Candle - This candle is set to a multiplier of 2x with a crossover of 50/100 on Volume - this then will paint a purple candle.
Uses of the Bullish Volume Candle:
Breakthrough of key areas // special chart patterns
Rejection of key areas
End of a impulse wave (Profit Takers)
The second candle is a Hammer - I prefer using the Hammers on Higher Timeframes however they do work on all timeframes. .
The third candle is a Exhaustion of impulse downward move.
Uses of this candle - can denote a new trend but has to be with confluence to a demand area // support area or with any use of technical analysis - using this alone is not advised
The fourth candle is a indecision candle in the shape of a Doji - this candle can help identify if the trend is in a continuation or a reversal
This script can work really well in Crypto Bull Runs
Disclaimer: There will be Pullbacks with High Volume (Breakouts) and not go the way as intended but this script is to allow traders to get into trends at good price levels. The script can paint signals in areas where price is too expensive so please do your own due diligence on the markets as this script is to help get into good areas of price
Please leave a thumbs up if you like this script and message me for information on how to use the script.

peterzorve-libraryLibrary "library"
is_bullish_engulfing()
is_bearish_engulfing()
is_hammer(fib_level)
Parameters:
fib_level (float)
is_shooting_star(fib_level)
Parameters:
fib_level (float)
is_hammer_and_star(fib_level)
Parameters:
fib_level (float)
is_star_and_hammer(fib_level)
Parameters:
fib_level (float)
is_dogi(dogi_body_ratio)
Parameters:
dogi_body_ratio (float)
is_bear_bear_bullish_engulf()
is_atr_stoploss_takeprofit(atr_multiplier, atr_length, reward_ratio)
Parameters:
atr_multiplier (float)
atr_length (simple int)
reward_ratio (float)
is_fixed_stoploss_takeprofit(stoploss_pips, reward_ratio)
Parameters:
stoploss_pips (float)
reward_ratio (float)
is_step_trailing_stoploss(stoploss_pips)
Parameters:
stoploss_pips (float)
is_atr_trailing_stoploss(atr_multiplier, break_even_pip)
Parameters:
atr_multiplier (float)
break_even_pip (int)
is_pull_back_strategy(length)
Parameters:
length (simple int)
is_trade_statistics(condition, entrypoint, stoploss, takeprofit)
Parameters:
condition (bool)
entrypoint (float)
stoploss (float)
takeprofit (float)
is_table_of_statistics(win_trades, lost_trades, even_trades, pips_won, pips_lost)
Parameters:
win_trades (int)
lost_trades (int)
even_trades (int)
pips_won (float)
pips_lost (float)
is_pine_info(lotsize, stoploss, takeprofit)
Parameters:
lotsize (float)
stoploss (float)
takeprofit (float)
is_support_and_resistance_strategy(look_back, look_forward)
Parameters:
look_back (int)
look_forward (int)
is_choral_strategy(smoothing_period, constant_d)
Parameters:
smoothing_period (int)
constant_d (float)
is_bollinger_band_strategy(length, dev_entry, dev_stoploss, dev_takeprofit)
Parameters:
length (int)
dev_entry (simple float)
dev_stoploss (simple float)
dev_takeprofit (simple float)
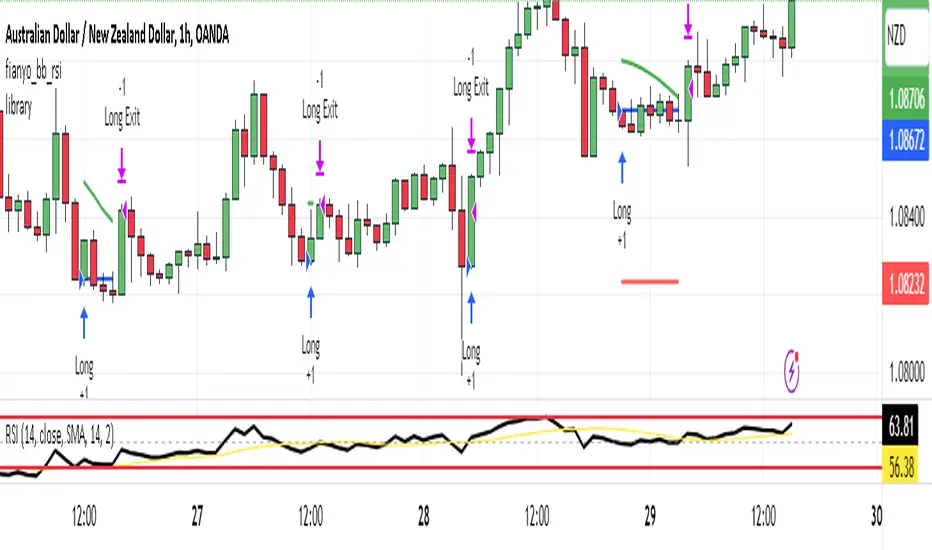
Strategy: Range BreakoutWhat?
In the price action, levels have a significant role to play. Based on the price moving above/below the levels - the underlying instrument shows some price-action in the direction of breakout/breakdown.
There are plenty of ways level can be determined. Levels are the decision point to take a trade or not. But if we make the level derivation complex, then the execution may get hamper.
This strategy script, developed in PineScript v5, is our attempt at solving this problem at the core by providing this simple, yet elegant solution to this problem.
It's essentially an attempt to Trade Simple by drawing logical (horizontal) lines in the chart and take actions, after multiple associated parameters confirmation, on the breakout / breakdown of the levels.
How?
Let us explain how we are drawing the levels.
We are depending on some of the parameters as described below:
Open Range : During intraday movement, often if prices move beyond a particular level, it exibits more movement in the same swing in same direction. We found out, through our back testing for Indian Indices like NSE:NIFTY , NSE:BANKNIFTY or NSE:CNXFINANCE the first 15m (i.e 09:15 AM to 09:30 AM, IST) is one of such range. For Indian stocks, it is 9:15 to 9:45. And for MCX MCX:CRUDEOIL1! it's 5:00 pm to 6:00 pm. There are our first levels.
PDHCL : Previous Day High, Close, Low. This is our next level
VWAP : The rolling VWAP (volume weighted average price)
In the breakout/breakdown of the Open Range and Previous Day High/Low, we are taking the trade decisions as follows using CEST principle:
C onditions :
If current bar's (say you are in 5m timeframe) closing is broken out the Open Range High or Previous Day High, taken a Buy/Long decision (let's say buying a Call Option CE or selling a Put Option PE or buying the future or cash).
If current bar's (say you are in 5m timeframe) closing is broken down the Open Range Low or Previous Day Low, taken a Sell/Short decision (let's say buying a Put Option CE or selling a Call Option PE or selling the future or cash).
Additionally, and optionally (default ON, one can turn off): we are checking various other associated multiple confirmations as follows:
1. Momentum : Checking 14-period RSI value is more than 50 or less than 50 (all parameters like period, OB, OS ranges are configurable through settings)
2. Current bar's volume is more than the last 20 bars volume average. How much more - that multiplier is also configurable. (default is 1)
3. The breakout candle is bullish (green) or bearish (red).
E ntry :
All of these happens only on the closing of the candle . Means: Non Repainting! .
Clearly in the chart we are showing as green up arrow BO (breakout for buy) and red down arrow BD (breakdown for sell) to take your decision process smooth.
So, on the closing of the decision BO/BD candle we are entering the trade (with a thumping heart and nail biting ...)
S top Loss :
We are relying on the time tasted (last 40 years) mechanism of Average True Range (ATR) of default 14 period. This default period is also configurable.
So for Long trades: the 14 period ATR low band is the SL.
For Short trades: the 14 period ATR high band is the SL.
T arget :
We are depending on the thump rule of 1:2 Risk Reward. It's simple and effective. No fancy thing. We are closing the trade on double the favorable price movement compared to the SL placed. Of course, this RR ratio is confiurable from the settings, as usual.
What's Unqiue in it?
The utter simplicity of this trading mechanism. No fancy things like complex chart pattern, OI data, multiple candlestick patterns, Order flow analysis etc.
Simple level determination,
Marking clearly in the chart.
Making each parameter configurable in Settings and showing tooltip adjacent to the parameter to make you understand it better for your customization,
Wait for the candle close, thus eliminating the chances of repainting menace (as much as possible)
Additional momentum and volume check to trade entry confirmation.
Works with normal candlestick (nothing special ones like HA ...)
Showing everything as a Summary Table (which, again can be turned off optionally) overlaying at the bottom-right corner of the chart,
Optionally the Summary Table can be configured to alert you back (say you get it notified in your email or SMS).
That way, a single, simple, effective trade setup will ease your journey as smooth sail as possible.
Mentions
There are plenty of friends from whom time to time we borrowed some of the ideas while working closely together over last one year.
From tradingview community, we took the spirit of @zzzcrypto123 awesome work done long back (in 2020) as the indicator "ORB - Opening Range Breakout". (We tried to reach him for his explicit consent, unable to catch hold of him).
Some other publicly available materials we have consulted to get the additional checks (like RSI, volume).
Lat word
Use it please and thank you for your constant patronage in following us in this awesome platform. Let's keep growing together.
Disclaimer :
This piece of software does not come up with any warrantee or any rights of not changing it over the future course of time.
We are not responsible for any trading/investment decision you are taking out of the outcome of this indicator.
