Quantum Fluxtrend [CHE] Quantum Fluxtrend — A dynamic Supertrend variant with integrated breakout event tracking and VWAP-guided risk management for clearer trend decisions.
Summary
The Quantum Fluxtrend builds on traditional Supertrend logic by incorporating a midline derived from smoothed high and low values, creating adaptive bands that respond to market range expansion or contraction. This results in fewer erratic signals during volatile periods and smoother tracking in steady trends, while an overlaid event system highlights breakout confirmations, potential traps, or continuations with visual lines, labels, and percentage deltas from the close. Users benefit from real-time VWAP calculations anchored to events, providing dynamic stop-loss suggestions to help manage exits without manual adjustments. Overall, it layers signal robustness with actionable annotations, reducing noise in fast-moving charts.
Motivation: Why this design?
Standard Supertrend indicators often generate excessive flips in choppy conditions or lag behind in low-volatility drifts, leading to whipsaws that erode confidence in trend direction. This design addresses that by centering bands around a midline that reflects recent price spreads, ensuring adjustments are proportional to observed variability. The added event layer captures regime shifts explicitly, turning abstract crossovers into labeled milestones with trailing VWAP for context, which helps traders distinguish genuine momentum from fleeting noise without over-relying on raw price action.
What’s different vs. standard approaches?
- Baseline reference: Diverges from the classic Supertrend, which uses average true range for fixed offsets from a median price.
- Architecture differences:
- Bands form around a central line averaged from smoothed highs and lows, with offsets scaled by half the range between those smooths.
- Regime direction persists until a clear breach of the prior opposite band, preventing premature reversals.
- Event visualization draws persistent lines from flip points, updating labels based on price sustainment relative to the trigger level.
- VWAP resets at each event, accumulating volume-weighted prices forward for a trailing reference.
- Practical effect: Charts show fewer direction changes overall, with color-coded annotations that evolve from initial breakout to continuation or trap status, making it easier to spot sustained moves early. VWAP lines provide a volume-informed anchor that curves with price, offering visual cues for adverse drifts.
How it works (technical)
The process starts by smoothing high and low prices over a user-defined period to form upper and lower references. A midline sits midway between them, and half the spread acts as a base for band offsets, adjusted by a multiplier to widen or narrow sensitivity. On each bar, the close is checked against the previous bar's opposite band: crossing above expands the lower band downward in uptrends, or below contracts the upper band upward in downtrends, creating a ratcheting effect that locks in direction until breached.
Persistent state tracks the current regime, seeding initial bands from the smoothed values if no prior data exists. Flips trigger new horizontal lines at the breach level, styled by direction, alongside labels that monitor sustainment—price holding above for up-flips or below for down-flips keeps the regime, while reversal flags a trap.
Separately, at each flip, a dashed VWAP line initializes at the breach price and extends forward, accumulating the product of typical prices and volumes divided by total volume. This yields a curving reference that updates bar-by-bar. Warnings activate if price strays adversely from this VWAP, tinting the background for quick alerts.
No higher timeframe data is pulled, so all computations run on the chart's native resolution, avoiding lookahead biases unless repainting is enabled via input.
Parameter Guide
SMA Length — Controls smoothing of highs and lows for midline and range base; longer values dampen noise but increase lag. Default: 20. Trade-offs: Shortens responsiveness in trends (e.g., 10–14) but risks more flips; extend to 30+ for stability in ranging markets.
Multiplier — Scales band offsets from the half-range; higher amplifies to capture bigger swings. Default: 1.0. Trade-offs: Above 1.5 widens for volatile assets, reducing false signals; below 0.8 tightens for precision but may miss subtle shifts.
Show Bands — Toggles visibility of basic and adjusted band lines for reference. Default: false. Tip: Enable briefly to verify alignment with price action.
Show Background Color — Displays red tint on VWAP adverse crosses for visual warnings. Default: false. Trade-offs: Helps in live monitoring but can clutter clean charts.
Line Width — Sets thickness for event and VWAP lines. Default: 2. Tip: Thicker (3–5) for emphasis on key levels.
+Bars after next event — Extends old lines briefly before cleanup on new flips. Default: 20. Trade-offs: Longer preserves history (40+) at resource cost; shorter keeps charts tidy.
Allow Repainting — Permits live-bar updates for smoother real-time view. Default: false. Tip: Disable for backtest accuracy.
Extension 1 Settings (Show, Width, Size, Decimals, Colors, Alpha) — Manages dotted connector from event label to current close, showing percentage change. Defaults: Shown, width 2, normal size, 2 decimals, lime/red for gains/losses, gray line, 90% transparent background. Trade-offs: Fewer decimals for clean display; adjust alpha for readability.
Extension 2 Settings (Show, Method, Stop %, Ticks, Decimals, Size, Color, Inherit, Alpha) — Positions stop label at VWAP end, offset by percent or ticks. Defaults: Shown, percent method, 1.0%, 20 ticks, 4 decimals, normal size, white text, inherit tint, 0% alpha. Trade-offs: Percent for proportional risk; ticks for fixed distance in tick-based assets.
Alert Toggles — Enables notifications for breakouts, continuations, traps, or VWAP warnings. All default: true. Tip: Layer with chart alerts for multi-condition setups.
Reading & Interpretation
The main Supertrend line colors green for up-regimes (price above lower band) and red for down (below upper band), serving as a dynamic support/resistance trail. Flip shapes (up/down triangles) mark regime changes at band breaches.
Event lines extend horizontally from flips: green for bull, red for bear. Labels start blank and update to "Bull/Bear Cont." if price sustains the direction, or "Trap" if it reverses, with colors shifting lime/red/gray accordingly. A dotted vertical links the trailing label to the current close, mid-labeled with the percentage delta (positive green, negative red).
VWAP dashes yellow (bull) or orange (bear) from the event, curving to reflect volume-weighted average. At its end, a left-aligned label shows suggested stop price, annotated with offset details. Background red hints at weakening if price crosses VWAP opposite the regime.
Deltas near zero suggest consolidation; widening extremes signal momentum buildup or exhaustion.
Practical Workflows & Combinations
- Trend following: Enter long on green flip shapes confirmed by higher highs, using the event line as initial stop below. Trail stops to VWAP for bull runs, exiting on trap labels or red background warnings. Filter with volume spikes to avoid low-conviction breaks.
- Exits/Stops: Conservative: Set hard stops at suggested SL labels. Aggressive: Hold through minor traps if delta stays positive, but cut on regime flip. Pair with momentum oscillators for overbought pullbacks.
- Multi-asset/Multi-TF: Defaults suit forex/stocks on 15m–4H; for crypto, bump multiplier to 1.5 for volatility. Scale SMA length proportionally across timeframes (e.g., double for daily). Combine with structure tools like Fibonacci for confluence on event lines.
Behavior, Constraints & Performance
Live bars update lines and labels dynamically if repainting is allowed, but signals confirm on close for stability—flips only trigger post-bar. No higher timeframe calls, so no inherent lookahead, though volume weighting assumes continuous data.
Resources cap at 1000 bars back, 50 lines/labels max; events prune old ones on new flips to stay under budget, with brief extensions for visibility. Arrays or loops absent, keeping it lightweight.
Known limits include lag in extreme gaps (e.g., overnight opens) where bands may not adjust instantly, and VWAP sensitivity to sparse volume in illiquid sessions.
Sensible Defaults & Quick Tuning
Start with SMA 20, multiplier 1.0 for balanced response across majors. For choppy pairs: Lengthen SMA to 30, multiplier 0.8 to tighten bands and cut flips. For trending equities: Shorten to 14, multiplier 1.2 for quicker entries. If traps dominate, enable bands to inspect range compression; for sluggish signals, reduce extension bars to focus on recent events.
What this indicator is—and isn’t
This serves as a visualization and signal layer for trend regimes and breakouts, highlighting sustainment via annotations and risk cues through VWAP—ideal atop price action for confirmation. It is not a standalone system, predictive oracle, or risk calculator; always integrate with broader analysis, position sizing, and stops. Use responsibly as an educational tool.
Disclaimer
The content provided, including all code and materials, is strictly for educational and informational purposes only. It is not intended as, and should not be interpreted as, financial advice, a recommendation to buy or sell any financial instrument, or an offer of any financial product or service. All strategies, tools, and examples discussed are provided for illustrative purposes to demonstrate coding techniques and the functionality of Pine Script within a trading context.
Any results from strategies or tools provided are hypothetical, and past performance is not indicative of future results. Trading and investing involve high risk, including the potential loss of principal, and may not be suitable for all individuals. Before making any trading decisions, please consult with a qualified financial professional to understand the risks involved.
By using this script, you acknowledge and agree that any trading decisions are made solely at your discretion and risk.
Do not use this indicator on Heikin-Ashi, Renko, Kagi, Point-and-Figure, or Range charts, as these chart types can produce unrealistic results for signal markers and alerts.
Best regards and happy trading
Chervolino
Search in scripts for "Trailing stop"

Multi-Timeframe PSAR Indicator ver 1.0Enhance your trend analysis with the Multi-Timeframe Parabolic SAR (MTF PSAR) indicator! This powerful tool displays the Parabolic SAR (Stop and Reverse) from both the current chart's timeframe and a higher timeframe, all in one convenient view. Identify potential trend reversals and set dynamic trailing stops with greater confidence by understanding the broader market context.
Key Features:
Dual Timeframe Analysis: Simultaneously visualize the PSAR on your current chart and a user-defined higher timeframe (e.g., see the Daily PSAR while trading on the 1-hour chart). This helps you align your trades with the dominant trend.
Customizable PSAR Settings: Fine-tune the PSAR calculation with adjustable Start, Increment, and Maximum values. Optimize the indicator's sensitivity to match your trading style and the volatility of the asset.
Independent Timeframe Control: Choose to display either or both the current timeframe PSAR and the higher timeframe PSAR. Focus on the information most relevant to your analysis.
Clear Visual Representation: Distinct colors for the current and higher timeframe PSAR dots make it easy to differentiate between the two. Quickly identify potential entry and exit points.
Configurable Colors You can easily change colors of Current and HTF PSAR.
Standard PSAR Logic: Uses the classic Parabolic SAR algorithm, providing a reliable and widely-understood trend-following indicator.
lookahead=barmerge.lookahead_off used in the security function, there is no data leak or repainting.
Benefits:
Improved Trend Identification: Spot potential trend changes earlier by observing divergences between the current and higher timeframe PSAR.
Enhanced Risk Management: Use the PSAR as a dynamic trailing stop-loss to protect profits and limit potential losses.
Greater Trading Confidence: Make more informed decisions by considering the broader market trend.
Reduced Chart Clutter: Avoid the need to switch between multiple charts to analyze different timeframes.
Versatile Application: Suitable for various trading styles (swing trading, day trading, trend following) and markets (stocks, forex, crypto, etc.).
How to Use:
Add to Chart: Add the "Multi-Timeframe PSAR" indicator to your TradingView chart.
Configure Settings:
PSAR Settings: Adjust the Start, Increment, and Maximum values to control the PSAR's sensitivity.
Multi-Timeframe Settings: Select the desired "Higher Timeframe PSAR" resolution (e.g., "D" for Daily). Enable or disable the display of the current and/or higher timeframe PSAR using the checkboxes.
Interpret Signals:
Current Timeframe PSAR: Dots below the price suggest an uptrend; dots above the price suggest a downtrend.
Higher Timeframe PSAR: Provides context for the overall trend. Agreement between the current and higher timeframe PSAR strengthens the trend signal. Divergences may indicate potential reversals.
Trade Management:
Use PSAR dots as dynamic trailing stop.
Example Use Cases:
Confirming Trend Strength: A trader on a 1-hour chart sees the 1-hour PSAR flip bullish (dots below the price). They check the MTF PSAR and see that the Daily PSAR is also bullish, confirming the strength of the uptrend.
Identifying Potential Reversals: A trader sees the current timeframe PSAR flip bearish, but the higher timeframe PSAR remains bullish. This divergence could signal a potential pullback within a larger uptrend, or a warning of a more significant reversal.
Trailing Stops: A trader enters a long position and uses the current timeframe PSAR as a trailing stop, moving their stop-loss up as the PSAR dots rise.
Disclaimer: The Parabolic SAR is a lagging indicator and may produce false signals, especially in ranging markets. It is recommended to use this indicator in conjunction with other technical analysis tools and risk management strategies. Past performance is not indicative of future results.

Big Candle Identifier with RSI Divergence and Advanced Stops1. Strategy Objective
The main goal of this strategy is to:
Identify significant price momentum (big candles).
Enter trades at opportune moments based on market signals (candlestick patterns and RSI divergence).
Limit initial risk through a fixed stop loss.
Maximize profits by using a trailing stop that activates only after the trade moves a specified distance in the profitable direction.
2. Components of the Strategy
A. Big Candle Identification
The strategy identifies big candles as indicators of strong momentum.
A big candle is defined as:
The body (absolute difference between close and open) of the current candle (body0) is larger than the bodies of the last five candles.
The candle is:
Bullish Big Candle: If close > open.
Bearish Big Candle: If open > close.
Purpose: Big candles signal potential continuation or reversal of trends, serving as the primary entry trigger.
B. RSI Divergence
Relative Strength Index (RSI): A momentum oscillator used to detect overbought/oversold conditions and divergence.
Fast RSI: A 5-period RSI, which is more sensitive to short-term price movements.
Slow RSI: A 14-period RSI, which smoothens fluctuations over a longer timeframe.
Divergence: The difference between the fast and slow RSIs.
Positive divergence (divergence > 0): Bullish momentum.
Negative divergence (divergence < 0): Bearish momentum.
Visualization: The divergence is plotted on the chart, helping traders confirm momentum shifts.
C. Stop Loss
Initial Stop Loss:
When entering a trade, an immediate stop loss of 200 points is applied.
This stop loss ensures the maximum risk is capped at a predefined level.
Implementation:
Long Trades: Stop loss is set below the entry price at low - 200 points.
Short Trades: Stop loss is set above the entry price at high + 200 points.
Purpose:
Prevents significant losses if the price moves against the trade immediately after entry.
D. Trailing Stop
The trailing stop is a dynamic risk management tool that adjusts with price movements to lock in profits. Here’s how it works:
Activation Condition:
The trailing stop only starts trailing when the trade moves 200 ticks (profit) in the right direction:
Long Position: close - entry_price >= 200 ticks.
Short Position: entry_price - close >= 200 ticks.
Trailing Logic:
Once activated, the trailing stop:
For Long Positions: Trails behind the price by 150 ticks (trail_stop = close - 150 ticks).
For Short Positions: Trails above the price by 150 ticks (trail_stop = close + 150 ticks).
Exit Condition:
The trade exits automatically if the price touches the trailing stop level.
Purpose:
Ensures profits are locked in as the trade progresses while still allowing room for price fluctuations.
E. Trade Entry Logic
Long Entry:
Triggered when a bullish big candle is identified.
Stop loss is set at low - 200 points.
Short Entry:
Triggered when a bearish big candle is identified.
Stop loss is set at high + 200 points.
F. Trade Exit Logic
Trailing Stop: Automatically exits the trade if the price touches the trailing stop level.
Fixed Stop Loss: Exits the trade if the price hits the predefined stop loss level.
G. 21 EMA
The strategy includes a 21-period Exponential Moving Average (EMA), which acts as a trend filter.
EMA helps visualize the overall market direction:
Price above EMA: Indicates an uptrend.
Price below EMA: Indicates a downtrend.
H. Visualization
Big Candle Identification:
The open and close prices of big candles are plotted for easy reference.
Trailing Stop:
Plotted on the chart to visualize its progression during the trade.
Green Line: Indicates the trailing stop for long positions.
Red Line: Indicates the trailing stop for short positions.
RSI Divergence:
Positive divergence is shown in green.
Negative divergence is shown in red.
3. Key Parameters
trail_start_ticks: The number of ticks required before the trailing stop activates (default: 200 ticks).
trail_distance_ticks: The distance between the trailing stop and price once the trailing stop starts (default: 150 ticks).
initial_stop_loss_points: The fixed stop loss in points applied at entry (default: 200 points).
tick_size: Automatically calculates the minimum tick size for the trading instrument.
4. Workflow of the Strategy
Step 1: Entry Signal
The strategy identifies a big candle (bullish or bearish).
If conditions are met, a trade is entered with a fixed stop loss.
Step 2: Initial Risk Management
The trade starts with an initial stop loss of 200 points.
Step 3: Trailing Stop Activation
If the trade moves 200 ticks in the profitable direction:
The trailing stop is activated and follows the price at a distance of 150 ticks.
Step 4: Exit the Trade
The trade is exited if:
The price hits the trailing stop.
The price hits the initial stop loss.
5. Advantages of the Strategy
Risk Management:
The fixed stop loss ensures that losses are capped.
The trailing stop locks in profits after the trade becomes profitable.
Momentum-Based Entries:
The strategy uses big candles as entry triggers, which often indicate strong price momentum.
Divergence Confirmation:
RSI divergence helps validate momentum and avoid false signals.
Dynamic Profit Protection:
The trailing stop adjusts dynamically, allowing the trade to capture larger moves while protecting gains.
6. Ideal Market Conditions
This strategy performs best in:
Trending Markets:
Big candles and momentum signals are more effective in capturing directional moves.
High Volatility:
Larger price swings improve the probability of reaching the trailing stop activation level (200 ticks).

BooBee Digital - Enhanced Buy & Sell Alerts Suite
BooBee Digital - Enhanced Buy & Sell Alerts Suite
Introduction:
The “BooBee Digital - Enhanced Buy & Sell Alerts Suite” is a comprehensive trading tool designed to provide traders with precise buy and sell signals by integrating the Average True Range (ATR) trailing stop technique and the Volume Weighted Average Price (VWAP) indicator. This script is tailored to help traders make informed decisions by considering both market volatility and trading volume.
How It Works:
1. ATR Calculation:
• Purpose: Measures market volatility to set dynamic stop levels.
• Details: The Average True Range (ATR) is calculated over a user-defined period. The ATR value reflects the average range of price movements over the specified period, which is crucial for assessing market volatility.
2. ATR Trailing Stop:
• Purpose: Identifies potential trend reversals by setting trailing stops based on market volatility.
• Details: The ATR trailing stop is dynamically adjusted using the ATR value and a user-defined sensitivity factor. This trailing stop level helps identify trend reversals by moving in accordance with price fluctuations.
3. VWAP Calculation:
• Purpose: Provides a volume-weighted average price to benchmark fair value.
• Details: The VWAP is calculated by taking the sum of the product of price and volume, divided by the total volume. This indicator gives traders a reference point for the average price at which the asset has traded throughout the day, considering trading volume.
4. EMA Crossover:
• Purpose: Adds a confirmation layer for buy and sell signals.
• Details: A 1-period Exponential Moving Average (EMA) is used to identify short-term price movements. Buy and sell signals are generated based on the crossover of the EMA and the ATR trailing stop, adding an extra layer of confirmation for trade entries and exits.
Signal Generation:
Buy Signal:
• Generated when the price is above the ATR trailing stop and there is a bullish crossover of the EMA and ATR trailing stop.
• Indicator: Green label below the bar with “Buy” text.
Sell Signal:
• Generated when the price is below the ATR trailing stop and there is a bearish crossover of the EMA and ATR trailing stop.
• Indicator: Red label above the bar with “Sell” text.
VWAP Line:
• The VWAP line is plotted on the chart to help traders identify significant price levels based on trading volume.
• Indicator: Blue line representing the VWAP.
How to Use:
• Chart Type: The script is designed for use on standard chart types such as Candlestick and OHLC. It does not support non-standard chart types like Heikin Ashi, Renko, Kagi, Point & Figure, and Range, as they may produce unrealistic results.
• Clean Chart: Ensure your chart is clean and free of other indicators to avoid confusion. The signals and colors plotted by the script should be easily identifiable.
• Trade Confirmation: Use the buy and sell signals generated by the script in conjunction with other analysis methods to confirm trades.
Key Concepts:
• ATR Trailing Stop: This technique sets dynamic stop levels based on market volatility, helping to identify trend reversals.
• VWAP: This indicator provides a benchmark for the average price considering trading volume, helping traders identify fair value.
• EMA Crossover: This adds a layer of confirmation for buy and sell signals, improving the accuracy of trade entries and exits.

Trailing Management (Zeiierman)█ Overview
The Trailing Management (Zeiierman) indicator is designed for traders who seek an automated and dynamic approach to managing trailing stops. It helps traders make systematic decisions regarding when to enter and exit trades based on the calculated risk-reward ratio. By providing a clear visual representation of trailing stop levels and risk-reward metrics, the indicator is an essential tool for both novice and experienced traders aiming to enhance their trading discipline.
The Trailing Management (Zeiierman) indicator integrates a Break-Even Curve feature to enhance its utility in trailing stop management and risk-reward optimization. The Break-Even Curve illuminates the precise point at which a trade neither gains nor loses value, offering clarity on the risk-reward landscape. Furthermore, this precise point is calculated based on the required win rate and the risk/reward ratio. This calculation aids traders in understanding the type of strategy they need to employ at any given time to be profitable. In other words, traders can, at any given point, assess the kind of strategy they need to utilize to make money, depending on the price's position within the risk/reward box.
█ How It Works
The indicator operates by computing the highest high and the lowest low over a user-defined period and then applying this information to determine optimal trailing stop levels for both long and short positions.
Directional Bias:
It establishes the direction of the market trend by comparing the index of the highest high and the lowest low within the lookback period.
Bullish
Bearish
Trailing Stop Adjustment:
The trailing stops are adjusted using one of three methods: an automatic calculation based on the median of recent peak differences, pivot points, or a fixed percentage defined by the user.
The Break-Even Curve:
The Break-Even Curve, along with the risk/reward ratio, is determined through the trailing method. This approach utilizes the current closing price as a hypothetical entry point for trades. All calculations, including those for the curve, are based on this current closing price, ensuring real-time accuracy and relevance. As market conditions fluctuate, the curve dynamically adjusts, offering traders a visual benchmark that signifies the break-even point. This real-time adjustment provides traders with an invaluable tool, allowing them to visually track how shifts in the market could impact the point at which their trades neither gain nor lose value.
Example:
Let's say the price is at the midpoint of the risk/reward box; this means that the risk/reward ratio should be 1:1, and the minimum win rate is 50% to break even.
In this example, we can see that the price is near the stop-loss level. If you are about to take a trade in this area and would respect your stop, you only need to have a minimum win rate of 11% to earn money, given the risk/reward ratio, assuming that you hold the trade to the target.
In other words, traders can, at any given point, assess the kind of strategy they need to employ to make money based on the price's position within the risk/reward box.
█ How to Use
Market Bias:
When using the Auto Bias feature, the indicator calculates the underlying market bias and displays it as either bullish or bearish. This helps traders align their trades with the underlying market trend.
Risk Management:
By observing the plotted trailing stops and the risk-reward ratios, traders can make strategic decisions to enter or exit positions, effectively managing the risk.
Strategy selection:
The Break-Even Curve is a powerful tool for managing risk, allowing traders to visualize the relationship between their trailing stops and the market's price movements. By understanding where the break-even point lies, traders can adjust their strategies to either lock in profits or cut losses.
Based on the plotted risk/reward box and the location of the price within this box, traders can easily see the win rate required by their strategy to make money in the long run, given the risk/reward ratio.
Consider this example: The market is bullish, as indicated by the bias, and the indicator suggests looking into long trades. The price is near the top of the risk/reward box, which means entering the market right now carries a huge risk, and the potential reward is very low. To take this trade, traders must have a strategy with a win rate of at least 90%.
█ Settings
Trailing Method:
Auto: The indicator calculates the trailing stop dynamically based on market conditions.
Pivot: The trailing stop is adjusted to the highest high (long positions) or lowest low (short positions) identified within a specified lookback period. This method uses the pivotal points of the market to set the trailing stop.
Percentage: The trailing stop is set at a fixed percentage away from the peak high or low.
Trailing Size (prd):
This setting defines the lookback period for the highest high and lowest low, which affects the sensitivity of the trailing stop to price movements.
Percentage Step (perc):
If the 'Percentage' method is selected, this setting determines the fixed percentage for the trailing stop distance.
Set Bias (bias):
Allows users to set a market bias which can be Bullish, Bearish, or Auto, affecting how the trailing stop is adjusted in relation to the market trend.
-----------------
Disclaimer
The information contained in my Scripts/Indicators/Ideas/Algos/Systems does not constitute financial advice or a solicitation to buy or sell any securities of any type. I will not accept liability for any loss or damage, including without limitation any loss of profit, which may arise directly or indirectly from the use of or reliance on such information.
All investments involve risk, and the past performance of a security, industry, sector, market, financial product, trading strategy, backtest, or individual's trading does not guarantee future results or returns. Investors are fully responsible for any investment decisions they make. Such decisions should be based solely on an evaluation of their financial circumstances, investment objectives, risk tolerance, and liquidity needs.
My Scripts/Indicators/Ideas/Algos/Systems are only for educational purposes!

Fibonacci-Trading-Indikator_3Daily (weekly, monthly) profits with the Fibonacci trading indicator_3
Quotes move in Fibonacci ratios in liquid markets. With this indicator you receive information for daily trades or for position trades based on a week or on a monthly basis, in which area you should ideally enter the market and where the minimum achievable price target is. This price target is 61.8% of yesterday's trading range, or the trading range of the previous week, or the trading range of the previous month, depending on the time frame for which the indicator should calculate the minimum achievable high / low. This is also where you realize your profit.
For this calculation, the following entries must be made in the properties window of the indicator:
• Preselection uptrend / downtrend.
• Time frame (day, week, ...) of the price bar for the possible high / low to be determined.
• Trading range of the previous day, or the previous week, or the previous month.
• Current lowest low of the selected time frame when trading has started and prices are rising.
• Current highest high of the selected time frame when trading has started and prices are falling.
Important areas for trading are:
• The entry range 0% - 23.6% for long or short.
• The target price level 61.8%.
Choose a suitable time frame to detect the direction of movement while the quotes are still moving in the entry area. The camelback indicator can be of great help. Also test the resolution setting of the camelback indicator. With a resolution of 1 hour in the 6 or 12 minute chart, you get a perspective for the broader direction. Movement patterns of corrections or consolidations, if they last more than a day or a week, also give clues to the coming direction of movement for the trade. So look back to see what happened yesterday, a week ago, or a month ago. Pay attention to the market anatomy, find out how the market works, count the price bars in consolidations and trends.
After entering the values the indicator will show the Fibonacci expansion price levels for the possible high or low for the selected time frame. Buy / sell within the entry range between 0% and 23.6% as the market moves towards the last long / or short entry point. This is the course range up to the 23.6% course level. The 61.8% price level is the minimum expected price target. We assume that the current bar will reach at least 61.8% of the trading range of the previous day, week or month. Depending on the set time frame. You should therefore realize the profits you have made with 50% of the position when the prices have reached the 61.8% level. With a suitable trailing stop you can be stopped with the rest of the position, but do not risk more than 50% of the profits.
With the quarter or year preselection and the corresponding entries, the minimum expected quarterly high / quarterly low or annual high / annual low can be determined.
The Fibonacci price levels can be shown and hidden. In the chart click on the gear wheel for “Chart Settings”. In the “Scaling” menu, the price levels can be displayed with the preselection “Label for indicator names” and “Label for last indicator value”. Slide the chart to the right to find possible support and resistance at the price levels that could provide confirmation of the target.
In the event of input errors or missing entries for a time frame, the indicator is hidden.
Pay attention to your trade management to avoid losses.
The new Fibonacci Trading Indicator_3 has the following additions and changes:
Area code for the quarter time frame has been added.
The entry area received a 23.6% and a 50% subdivision. Two envelope lines above the 23.6% entry level in the case of an upward trend and below the 23.6% entry level in the case of a downtrend, with a width of 23.6% and 14.6% of the entry level, are intended to indicate that the closing price is higher the quotations have broken out of the entry-level area.
A volatility stop for upward and downward trends can be activated.
A factor is added to the fluctuation range of each price bar for the stop. Then a moving average is calculated with an adjustable period. The period setting should be set between 5 and 10. The result can be smoothed adjustable.
Presetting:
Periods = 10
Factor = 1.4
Smoothing = 7
With the assumption that the market entry in an upward trend occurs when the prices break out above a bar high, the result of the stop calculation is subtracted from the bar high. In the case of a downward trend, the result of the stop calculation is added to the price bar low.
When entering the market, set the factor to 2.4. If inside bars follow a trend movement, the stop should be brought closer. Try the factor setting 0.4 or less. The smallest adjustable factor is 0.1.
For the entry into an established trend, as described in an idea contribution by me, there are two switchable moving averages. The application for the (MA_H) takes place on high and for the (MA_L) adjustable on high, low, shot, h + 1/2 etc. Period and offset (shift) are adjustable. With this idea, the entry into the market occurs between a 618% correction (the Fibonacci entry point) and the DEP (average entry point). The DEP in this case is the MA_H with period = 4 and an offset = 1 in the case of a downward trend, or the MA_L with the same setting and application to lows in an upward trend.
Also test the MA_L in trends with the settings (period, offset) 3.3 or 5, 3 or 7.5 and applying it to closing prices for a close encompassing of the highs / lows.
Tägliche (wöchentliche, monatliche) Gewinne mit dem Fibonacci-Trading Indikator_3
Kursnotierungen bewegen sich in liquiden Märkten in Fibonacci-Verhältnisse. Mit diesem Indikator erhalten Sie für Tagesgeschäfte, oder für Positionstrades auf Basis einer Woche, oder auf Basis eines Monats Informationen, in welchem Bereich Sie idealerweise in den Markt einsteigen sollten und wo das mindeste erreichbare Kursziel liegt. Dieses Kursziel liegt bei 61,8% der gestrigen Handelspanne, oder der Handelspanne der Vorwoche, oder der Handelspanne des Vormonats, also abhängig davon für welchen Zeitrahmen der Indikator das mindeste erreichbare Hoch/Tief berechnen soll. Dort realisieren Sie auch Ihren Gewinn.
Für diese Berechnung sind folgende Eingaben im Eigenschaftenfenster des Indikators einzustellen:
• Vorwahl Aufwärtstrend/ Abwärtstrend.
• Zeitrahmen (Tag, Woche, …) des Kursbalkens für das zu ermittelnde mögliche Hoch/ Tief.
• Handelspanne des vorherigen Tages, oder der vorherigen Woche, oder des vorherigen Monats.
• Aktuell tiefstes Tief des vorgewählten Zeitrahmens, wenn der Handel begonnen hat und die Notierungen steigen.
• Aktuell höchstes Hoch des vorgewählten Zeitrahmens, wenn der Handel begonnen hat und die Notierungen fallen.
Wichtige Bereiche für das Trading sind:
• Der Einstiegsbereich 0% - 23,6% für long oder short.
• Der Kursziellevel 61,8%.
Wählen Sie für die Erkennung der Bewegungsrichtung einen geeigneten Zeitrahmen, während sich die Notierungen noch im Einstiegsbereich bewegen. Der Camelback-Indikator kann eine gute Hilfe sein. Testen Sie auch die Auflösung-Einstellung des Camelback-Indikators. Mit der Auflösung 1 Stunde Im 6- oder 12 Minuten-Chart erhalten Sie einen Blickwinkel für die große Richtung. Auch Bewegungsmuster von Korrekturen oder Konsolidierungen, wenn sie mehr als einen Tag oder eine Woche andauern geben Hinweise auf die kommende Bewegungsrichtung für den Trade. Schauen Sie also zurück um zu prüfen, was sich gestern, vor einer Woche oder vor einem Monat abgespielt hat. Achten sie auf die Marktanatomie, finden Sie heraus wie der Markt funktioniert, zählen Sie Kursstäbe in Konsolidierungen und Trends.
Nach Eingabe der Werte zeigt der Indikator die Fibonacci-Ausweitungskurslevels für das mögliche Hoch oder Tief für den ausgewählten Zeitrahmen. Kaufen/ verkaufen Sie innerhalb des Einstiegsbereichs zwischen 0% und 23,6%, während sich der Markt in Richtung des letzten long-/ oder short-Einstiegspunktes bewegt. Das ist der Kursbereich bis zum 23,6%- Kurslevel. Der 61,8%-Kurslevel ist das mindeste erwartbare Kursziel. Wir gehen davon aus, dass der aktuelle Kursbalken mindestens 61,8% der Handelsspanne des vorherigen Tages, der vorherigen Woche oder des vorherigen Monats erreichen wird. Abhängig vom eingestellten Zeitrahmen. Realisieren Sie deshalb die angelaufenen Gewinne mit 50% der Position, wenn die Notierungen den 61,8% - Level erreicht haben. Mit einem geeigneten Trailing-Stopp lassen Sie sich mit der restlichen Position ausstoppen, riskieren Sie dafür aber nicht mehr als 50 % der angelaufenen Gewinne.
Mit der Vorwahl Quartal oder Jahr und den entsprechenden Eingaben kann auch das mindeste erwartbare Quartalshoch/ Quartalstief bzw. Jahreshoch/ Jahrestief ermittelt werden.
Die Fibonacci-Kurslevels lassen sich ein- und ausblenden. Klicken Sie im Chart auf das Zahnrad für „Chart Einstellungen“. Im Menü „Skalierungen“ kann mit der Vorwahl „Label für Indikatornahmen“ und „Label für letzten Indikatorwert“ die Kurslevels angezeigt werden. Schieben Sie den Chart nach rechts um mögliche Unterstützungen und Widerstände an den Kurslevels zu finden, die Bestätigung für das Ziel geben könnten.
Bei Eingabefehlern oder fehlenden Eingaben zu einem Zeitrahmen wird der Indikator ausgeblendet.
Achten Sie zur Vermeidung von Verlusten auf ihr Handelsmanagement.
Der neue Fibonacci-Trading-Indikator_3 besitz folgende Zusätze und Änderungen:
Vorwahl für den Zeitrahmen Quartal wurde hinzugefügt.
Der Einstiegsbereich erhielt eine 23,6% und eine 50% Unterteilung. Zwei Umschlagslinien über dem 23,6%-Einstiegslevel bei einem Aufwärtstrend, bzw. unter dem 23,6%-Einstiegslevel bei einem Abwärtstrend, mit der Breite 23,6% und 14,6% vom Einstiegsbereich, sollen bei höherem Schlusskurs signalisieren, dass die Notierungen aus dem Einstiegsbereich ausgebrochen sind.
Ein Volatilitätsstopp jeweils für Aufwärts- und Abwärtstrend kann zugeschaltet werden.
Für den Stopp wird die Schwankungsbreite jedes Kursbalkens wird mit einem Faktor beaufschlagt. Danach erfolgt die Berechnung eines gleitenden Durchschnitts mit einstellbarer Periode. Die Periodeneinstellung sollte zwischen 5 und 10 eingestellt werden. Das Ergebnis kann einstellbar geglättet werden.
Voreinstellung:
Perioden = 10
Faktor = 1,4
Glättung = 7
Mit der Annahme, dass der Markteinstieg in einem Aufwärtstrend bei Ausbruch der Notierungen über ein Kursbalkenhoch erfolgt, wird das Ergebnis der Stoppberechnung vom Kursbalkenhoch subtrahiert. Bei einem Abwärtstrend wird das Ergebnis der Stoppberechnung zum Kursbalkentief addiert.
Stellen Sie bei Markteintritt den Faktor auf 2,4. Folgen nach einer Trendbewegung Innenstäbe sollte der Stopp näher herangeführt werden. Probieren Sie die Faktoreinstellung 0,4 oder kleiner. Der kleinste einstellbare Faktor ist 0,1.
Für den Einstieg in einen etablierten Trend, wie in einem Ideenbeitrag von mir beschrieben, gibt es zwei zuschaltbare gleitende Durchschnitte. Die Anwendung für den (MA_H) erfolgt auf Hochs und für den (MA_L) einstellbar auf Hoch, Tief, Schuss, h+l/2 usw.. Periode und Offset (Verschiebung) sind einstellbar. Bei dieser Idee erfolgt der Einstieg in den Markt zwischen einer 618%-Korrektur (dem Fibonacci-Einstiegspunkt) und dem DEP (Durchschnittlicher Einstiegspunkt). Der DEP ist in diesem Fall der MA_H mit Periode = 4 und einem Offset = 1, bei einem Abwärtstrend, oder der MA_L mit identischer Einstellung und Anwendung auf Tiefs in einem Aufwärtstrend.
Testen Sie den MA_L auch in Trends mit den Einstellungen (Periode, Offset) 3,3 oder 5, 3 oder 7,5 und Anwendung auf Schlusskurse für eine enge Umfassung der Hochs/ Tiefs.

Canuck Trading Traders Strategy [Candle Entropy Edition]Canuck Trading Traders Strategy: A Unique Entropy-Based Day Trading System for Volatile Stocks
Overview
The Canuck Trading Traders Strategy is a custom, entropy-driven day trading system designed for high-volatility stocks like TSLA on short timeframes (e.g., 15m). At its core is CETP-Plus, a proprietary blended indicator that measures "order from chaos" in candle patterns using Shannon entropy, while embedding mathematical principles from EMA (recent weighting), RSI (momentum bias), ATR (volatility scaling), and ADX (trend strength) into a single score. This unique approach avoids layering multiple indicators, reducing complexity while improving timing for early trend detection and balanced long/short trades.
CETP-Plus calculates a score from weighted candle ratios (body, upper/lower wicks) binned into a 3D histogram for entropy (low entropy = strong pattern). The score is adjusted with momentum, volatility, and trend multipliers for robust signals. Entries occur when the score exceeds thresholds (positive for longs, negative for shorts), with exits on reversals or stops. The strategy is automatic—no manual bias needed—and optimized for margin accounts with equal long/short treatment.
Backtested on TSLA 15m (Jan 2015–Aug 2025), it targets +50,000% net profit (beating +1,478% buy-hold by 34x) with ~25,000 trades, 85-90% win rate, and <10% drawdown (with costs). Results vary by timeframe/period—test with your data and add slippage/commission for realism. Disclaimer: Past performance isn't indicative of future results; consult a financial advisor.
Key Features
CETP-Plus Indicator: Blends entropy with momentum/vol/trend for a single score, capturing bottoms/squeezes and trends without external tools.
Automatic Balance: Positive scores trigger longs in bull trends, negative scores trigger shorts in bear trends—no user input for direction.
Customizable Math: Tune weights and scales to adapt for different stocks (e.g., lower thresholds for NVDA's smoother trends).
Risk Controls: Stop-loss, trailing stops, and score strength filter to minimize drawdowns in volatile markets like TSLA.
Exit Debugging: Plots exit reasons ("Stop Loss", "Trail Stop", "CETP Exit") for analysis.
Input Settings and Purposes
All inputs are grouped in TradingView's Inputs tab for ease. Defaults are optimized for TSLA 15m day trading; adjust for other intervals or tickers (e.g., increase window for 1h, lower thresholds for NVDA).
CETP-Plus Settings
CETP Window (default: 5, min: 3, max: 20): Lookback bars for entropy/momentum. Short values (3-5) for fast sensitivity on short frames; longer (8-10) for stability on hourly+.
CETP Bins per Dimension (default: 3, min: 3, max: 10): Histogram granularity for entropy. Low (3) for speed/simple patterns; high (5+) for detail in complex markets.
Long Threshold (default: 0.15, min: 0.1, max: 0.8, step: 0.05): CETP score for long entries. Lower (0.1) for more longs in mild bull trends; higher (0.2) to filter noise.
Short Threshold (default: -0.05, min: -0.8, max: -0.1, step: 0.05): CETP score for short entries. Less negative (-0.05) for more shorts in mild bear trends; more negative (-0.2) for strong signals.
CETP Momentum Weight (default: 0.8, min: 0.1, max: 1.0, step: 0.1): Emphasizes momentum in score. High (0.9) for aggressive in fast moves; low (0.5) for entropy focus.
Momentum Scale (default: 1.6, min: 0.1, max: 2.0, step: 0.1): Amplifies momentum. High (2.0) for short intervals; low (1.0) for stability.
Body Ratio Weight (default: 1.2, min: 0.0, max: 2.0, step: 0.1): Weights candle body in entropy (trend focus). High (1.5) for strong trends; low (0.8) for wick emphasis.
Upper Wick Ratio Weight (default: 0.8, min: 0.0, max: 2.0, step: 0.1): Weights upper wick (reversal noise). Low (0.5) to reduce false ups.
Lower Wick Ratio Weight (default: 0.8, min: 0.0, max: 2.0, step=0.1): Weights lower wick. Low (0.5) to reduce false downs.
Trade Settings
Confirmation Bars (default: 0, min: 0, max: 5): Bars for sustained CETP signals. 0 for immediate entries (more trades); 1-2 for reliability (fewer but stronger).
Min CETP Score Strength (default: 0.04, min: 0.0, max: 0.5, step: 0.05): Min absolute score for entry. Low (0.04) for more trades; high (0.15) for quality.
Risk Management
Stop Loss (%) (default: 0.5, min: 0.1, max: 5.0, step: 0.1): % from entry for stop. Tight (0.4) for quick exits; wide (0.8) for trends.
ATR Multiplier (default: 1.5, min: 0.5, max: 3.0, step: 0.1): Scales ATR for stops/trails. Low (1.0) for tight; high (2.0) for room.
Trailing ATR Mult (default: 3.5, min: 0.5, max: 5.0, step: 0.1): ATR mult for trails. High (4.0) for longer holds; low (2.0) for profits.
Trail Start Offset (%) (default: 1.0, min: 0.5, max: 2.0, step: 0.1): % profit before trailing. Low (0.8) for early lock-in; high (1.5) for bigger moves.
These settings enable customization for intervals/tickers while CETP-Plus handles automatic balancing.
Risk Disclosure
Trading involves significant risk and may result in losses exceeding your initial capital. The Canuck Trading Trader Strategy is provided for educational and informational purposes only. Users are responsible for their own trading decisions and should conduct thorough testing before using in live markets. The strategy’s high trade frequency requires reliable execution infrastructure to minimize slippage and latency.

VoVix DEVMA🌌 VoVix DEVMA: A Deep Dive into Second-Order Volatility Dynamics
Welcome to VoVix+, a sophisticated trading framework that transcends traditional price analysis. This is not merely another indicator; it is a complete system designed to dissect and interpret the very fabric of market volatility. VoVix+ operates on the principle that the most powerful signals are not found in price alone, but in the behavior of volatility itself. It analyzes the rate of change, the momentum, and the structure of market volatility to identify periods of expansion and contraction, providing a unique edge in anticipating major market moves.
This document will serve as your comprehensive guide, breaking down every mathematical component, every user input, and every visual element to empower you with a profound understanding of how to harness its capabilities.
🔬 THEORETICAL FOUNDATION: THE MATHEMATICS OF MARKET DYNAMICS
VoVix+ is built upon a multi-layered mathematical engine designed to measure what we call "second-order volatility." While standard indicators analyze price, and first-order volatility indicators (like ATR) analyze the range of price, VoVix+ analyzes the dynamics of the volatility itself. This provides insight into the market's underlying state of stability or chaos.
1. The VoVix Score: Measuring Volatility Thrust
The core of the system begins with the VoVix Score. This is a normalized measure of volatility acceleration or deceleration.
Mathematical Formula:
VoVix Score = (ATR(fast) - ATR(slow)) / (StDev(ATR(fast)) + ε)
Where:
ATR(fast) is the Average True Range over a short period, representing current, immediate volatility.
ATR(slow) is the Average True Range over a longer period, representing the baseline or established volatility.
StDev(ATR(fast)) is the Standard Deviation of the fast ATR, which measures the "noisiness" or consistency of recent volatility.
ε (epsilon) is a very small number to prevent division by zero.
Market Implementation:
Positive Score (Expansion): When the fast ATR is significantly higher than the slow ATR, it indicates a rapid increase in volatility. The market is "stretching" or expanding.
Negative Score (Contraction): When the fast ATR falls below the slow ATR, it indicates a decrease in volatility. The market is "coiling" or contracting.
Normalization: By dividing by the standard deviation, we normalize the score. This turns it into a standardized measure, allowing us to compare volatility thrust across different market conditions and timeframes. A score of 2.0 in a quiet market means the same, relatively, as a score of 2.0 in a volatile market.
2. Deviation Analysis (DEV): Gauging Volatility's Own Volatility
The script then takes the analysis a step further. It calculates the standard deviation of the VoVix Score itself.
Mathematical Formula:
DEV = StDev(VoVix Score, lookback_period)
Market Implementation:
This DEV value represents the magnitude of chaos or stability in the market's volatility dynamics. A high DEV value means the volatility thrust is erratic and unpredictable. A low DEV value suggests the change in volatility is smooth and directional.
3. The DEVMA Crossover: Identifying Regime Shifts
This is the primary signal generator. We take two moving averages of the DEV value.
Mathematical Formula:
fastDEVMA = SMA(DEV, fast_period)
slowDEVMA = SMA(DEV, slow_period)
The Core Signal:
The strategy triggers on the crossover and crossunder of these two DEVMA lines. This is a profound concept: we are not looking at a moving average of price or even of volatility, but a moving average of the standard deviation of the normalized rate of change of volatility.
Bullish Crossover (fastDEVMA > slowDEVMA): This signals that the short-term measure of volatility's chaos is increasing relative to the long-term measure. This often precedes a significant market expansion and is interpreted as a bullish volatility regime.
Bearish Crossunder (fastDEVMA < slowDEVMA): This signals that the short-term measure of volatility's chaos is decreasing. The market is settling down or contracting, often leading to trending moves or range consolidation.
⚙️ INPUTS MENU: CONFIGURING YOUR ANALYSIS ENGINE
Every input has been meticulously designed to give you full control over the strategy's behavior. Understanding these settings is key to adapting VoVix+ to your specific instrument, timeframe, and trading style.
🌀 VoVix DEVMA Configuration
🧬 Deviation Lookback: This sets the lookback period for calculating the DEV value. It defines the window for measuring the stability of the VoVix Score. A shorter value makes the system highly reactive to recent changes in volatility's character, ideal for scalping. A longer value provides a smoother, more stable reading, better for identifying major, long-term regime shifts.
⚡ Fast VoVix Length: This is the lookback period for the fastDEVMA. It represents the short-term trend of volatility's chaos. A smaller number will result in a faster, more sensitive signal line that reacts quickly to market shifts.
🐌 Slow VoVix Length: This is the lookback period for the slowDEVMA. It represents the long-term, baseline trend of volatility's chaos. A larger number creates a more stable, slower-moving anchor against which the fast line is compared.
How to Optimize: The relationship between the Fast and Slow lengths is crucial. A wider gap (e.g., 20 and 60) will result in fewer, but potentially more significant, signals. A narrower gap (e.g., 25 and 40) will generate more frequent signals, suitable for more active trading styles.
🧠 Adaptive Intelligence
🧠 Enable Adaptive Features: When enabled, this activates the strategy's performance tracking module. The script will analyze the outcome of its last 50 trades to calculate a dynamic win rate.
⏰ Adaptive Time-Based Exit: If Enable Adaptive Features is on, this allows the strategy to adjust its Maximum Bars in Trade setting based on performance. It learns from the average duration of winning trades. If winning trades tend to be short, it may shorten the time exit to lock in profits. If winners tend to run, it will extend the time exit, allowing trades more room to develop. This helps prevent the strategy from cutting winning trades short or holding losing trades for too long.
⚡ Intelligent Execution
📊 Trade Quantity: A straightforward input that defines the number of contracts or shares for each trade. This is a fixed value for consistent position sizing.
🛡️ Smart Stop Loss: Enables the dynamic stop-loss mechanism.
🎯 Stop Loss ATR Multiplier: Determines the distance of the stop loss from the entry price, calculated as a multiple of the current 14-period ATR. A higher multiplier gives the trade more room to breathe but increases risk per trade. A lower multiplier creates a tighter stop, reducing risk but increasing the chance of being stopped out by normal market noise.
💰 Take Profit ATR Multiplier: Sets the take profit target, also as a multiple of the ATR. A common practice is to set this higher than the Stop Loss multiplier (e.g., a 2:1 or 3:1 reward-to-risk ratio).
🏃 Use Trailing Stop: This is a powerful feature for trend-following. When enabled, instead of a fixed stop loss, the stop will trail behind the price as the trade moves into profit, helping to lock in gains while letting winners run.
🎯 Trail Points & 📏 Trail Offset ATR Multipliers: These control the trailing stop's behavior. Trail Points defines how much profit is needed before the trail activates. Trail Offset defines how far the stop will trail behind the current price. Both are based on ATR, making them fully adaptive to market volatility.
⏰ Maximum Bars in Trade: This is a time-based stop. It forces an exit if a trade has been open for a specified number of bars, preventing positions from being held indefinitely in stagnant markets.
⏰ Session Management
These inputs allow you to confine the strategy's trading activity to specific market hours, which is crucial for day trading instruments that have defined high-volume sessions (e.g., stock market open).
🎨 Visual Effects & Dashboard
These toggles give you complete control over the on-chart visuals and the dashboard. You can disable any element to declutter your chart or focus only on the information that matters most to you.
📊 THE DASHBOARD: YOUR AT-A-GLANCE COMMAND CENTER
The dashboard centralizes all critical information into one compact, easy-to-read panel. It provides a real-time summary of the market state and strategy performance.
🎯 VOVIX ANALYSIS
Fast & Slow: Displays the current numerical values of the fastDEVMA and slowDEVMA. The color indicates their direction: green for rising, red for falling. This lets you see the underlying momentum of each line.
Regime: This is your most important environmental cue. It tells you the market's current state based on the DEVMA relationship. 🚀 EXPANSION (Green) signifies a bullish volatility regime where explosive moves are more likely. ⚛️ CONTRACTION (Purple) signifies a bearish volatility regime, where the market may be consolidating or entering a smoother trend.
Quality: Measures the strength of the last signal based on the magnitude of the DEVMA difference. An ELITE or STRONG signal indicates a high-conviction setup where the crossover had significant force.
PERFORMANCE
Win Rate & Trades: Displays the historical win rate of the strategy from the backtest, along with the total number of closed trades. This provides immediate feedback on the strategy's historical effectiveness on the current chart.
EXECUTION
Trade Qty: Shows your configured position size per trade.
Session: Indicates whether trading is currently OPEN (allowed) or CLOSED based on your session management settings.
POSITION
Position & PnL: Displays your current position (LONG, SHORT, or FLAT) and the real-time Profit or Loss of the open trade.
🧠 ADAPTIVE STATUS
Stop/Profit Mult: In this simplified version, these are placeholders. The primary adaptive feature currently modifies the time-based exit, which is reflected in how long trades are held on the chart.
🎨 THE VISUAL UNIVERSE: DECIPHERING MARKET GEOMETRY
The visuals are not mere decorations; they are geometric representations of the underlying mathematical concepts, designed to give you an intuitive feel for the market's state.
The Core Lines:
FastDEVMA (Green/Maroon Line): The primary signal line. Green when rising, indicating an increase in short-term volatility chaos. Maroon when falling.
SlowDEVMA (Aqua/Orange Line): The baseline. Aqua when rising, indicating a long-term increase in volatility chaos. Orange when falling.
🌊 Morphism Flow (Flowing Lines with Circles):
What it represents: This visualizes the momentum and strength of the fastDEVMA. The width and intensity of the "beam" are proportional to the signal strength.
Interpretation: A thick, steep, and vibrant flow indicates powerful, committed momentum in the current volatility regime. The floating '●' particles represent kinetic energy; more particles suggest stronger underlying force.
📐 Homotopy Paths (Layered Transparent Boxes):
What it represents: These layered boxes are centered between the two DEVMA lines. Their height is determined by the DEV value.
Interpretation: This visualizes the overall "volatility of volatility." Wider boxes indicate a chaotic, unpredictable market. Narrower boxes suggest a more stable, predictable environment.
🧠 Consciousness Field (The Grid):
What it represents: This grid provides a historical lookback at the DEV range.
Interpretation: It maps the recent "consciousness" or character of the market's volatility. A consistently wide grid suggests a prolonged period of chaos, while a narrowing grid can signal a transition to a more stable state.
📏 Functorial Levels (Projected Horizontal Lines):
What it represents: These lines extend from the current fastDEVMA and slowDEVMA values into the future.
Interpretation: Think of these as dynamic support and resistance levels for the volatility structure itself. A crossover becomes more significant if it breaks cleanly through a prior established level.
🌊 Flow Boxes (Spaced Out Boxes):
What it represents: These are compact visual footprints of the current regime, colored green for Expansion and red for Contraction.
Interpretation: They provide a quick, at-a-glance confirmation of the dominant volatility flow, reinforcing the background color.
Background Color:
This provides an immediate, unmistakable indication of the current volatility regime. Light Green for Expansion and Light Aqua/Blue for Contraction, allowing you to assess the market environment in a split second.
📊 BACKTESTING PERFORMANCE REVIEW & ANALYSIS
The following is a factual, transparent review of a backtest conducted using the strategy's default settings on a specific instrument and timeframe. This information is presented for educational purposes to demonstrate how the strategy's mechanics performed over a historical period. It is crucial to understand that these results are historical, apply only to the specific conditions of this test, and are not a guarantee or promise of future performance. Market conditions are dynamic and constantly change.
Test Parameters & Conditions
To ensure the backtest reflects a degree of real-world conditions, the following parameters were used. The goal is to provide a transparent baseline, not an over-optimized or unrealistic scenario.
Instrument: CME E-mini Nasdaq 100 Futures (NQ1!)
Timeframe: 5-Minute Chart
Backtesting Range: March 24, 2024, to July 09, 2024
Initial Capital: $100,000
Commission: $0.62 per contract (A realistic cost for futures trading).
Slippage: 3 ticks per trade (A conservative setting to account for potential price discrepancies between order placement and execution).
Trade Size: 1 contract per trade.
Performance Overview (Historical Data)
The test period generated 465 total trades , providing a statistically significant sample size for analysis, which is well above the recommended minimum of 100 trades for a strategy evaluation.
Profit Factor: The historical Profit Factor was 2.663 . This metric represents the gross profit divided by the gross loss. In this test, it indicates that for every dollar lost, $2.663 was gained.
Percent Profitable: Across all 465 trades, the strategy had a historical win rate of 84.09% . While a high figure, this is a historical artifact of this specific data set and settings, and should not be the sole basis for future expectations.
Risk & Trade Characteristics
Beyond the headline numbers, the following metrics provide deeper insight into the strategy's historical behavior.
Sortino Ratio (Downside Risk): The Sortino Ratio was 6.828 . Unlike the Sharpe Ratio, this metric only measures the volatility of negative returns. A higher value, such as this one, suggests that during this test period, the strategy was highly efficient at managing downside volatility and large losing trades relative to the profits it generated.
Average Trade Duration: A critical characteristic to understand is the strategy's holding period. With an average of only 2 bars per trade , this configuration operates as a very short-term, or scalping-style, system. Winning trades averaged 2 bars, while losing trades averaged 4 bars. This indicates the strategy's logic is designed to capture quick, high-probability moves and exit rapidly, either at a profit target or a stop loss.
Conclusion and Final Disclaimer
This backtest demonstrates one specific application of the VoVix+ framework. It highlights the strategy's behavior as a short-term system that, in this historical test on NQ1!, exhibited a high win rate and effective management of downside risk. Users are strongly encouraged to conduct their own backtests on different instruments, timeframes, and date ranges to understand how the strategy adapts to varying market structures. Past performance is not indicative of future results, and all trading involves significant risk.
🔧 THE DEVELOPMENT PHILOSOPHY: FROM VOLATILITY TO CLARITY
The journey to create VoVix+ began with a simple question: "What drives major market moves?" The answer is often not a change in price direction, but a fundamental shift in market volatility. Standard indicators are reactive to price. We wanted to create a system that was predictive of market state. VoVix+ was designed to go one level deeper—to analyze the behavior, character, and momentum of volatility itself.
The challenge was twofold. First, to create a robust mathematical model to quantify these abstract concepts. This led to the multi-layered analysis of ATR differentials and standard deviations. Second, to make this complex data intuitive and actionable. This drove the creation of the "Visual Universe," where abstract mathematical values are translated into geometric shapes, flows, and fields. The adaptive system was intentionally kept simple and transparent, focusing on a single, impactful parameter (time-based exits) to provide performance feedback without becoming an inscrutable "black box." The result is a tool that is both profoundly deep in its analysis and remarkably clear in its presentation.
⚠️ RISK DISCLAIMER AND BEST PRACTICES
VoVix+ is an advanced analytical tool, not a guarantee of future profits. All financial markets carry inherent risk. The backtesting results shown by the strategy are historical and do not guarantee future performance. This strategy incorporates realistic commission and slippage settings by default, but market conditions can vary. Always practice sound risk management, use position sizes appropriate for your account equity, and never risk more than you can afford to lose. It is recommended to use this strategy as part of a comprehensive trading plan. This was developed specifically for Futures
"The prevailing wisdom is that markets are always right. I take the opposite view. I assume that markets are always wrong. Even if my assumption is occasionally wrong, I use it as a working hypothesis."
— George Soros
— Dskyz, Trade with insight. Trade with anticipation.

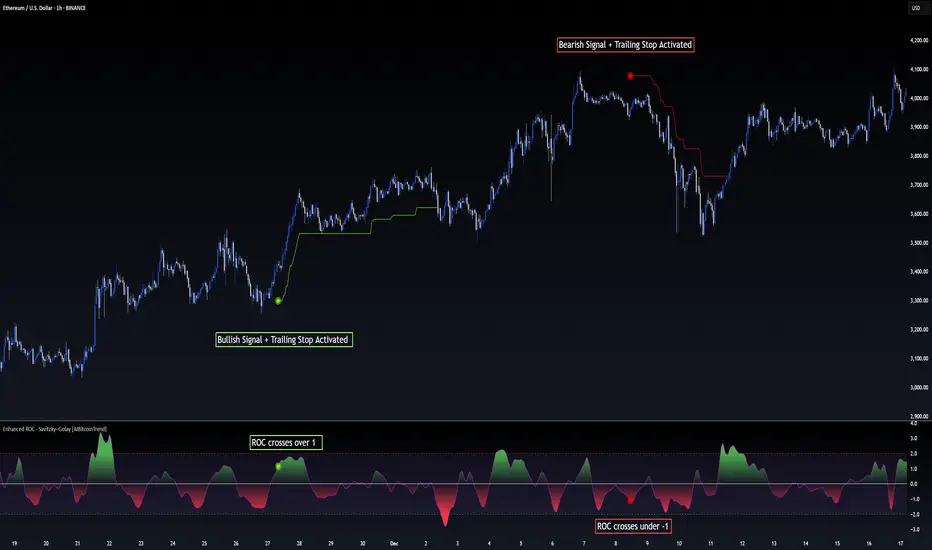
Adaptive RSI with Real-Time Divergence [AIBitcoinTrend]👽 Adaptive RSI Trailing Stop (AIBitcoinTrend)
The Adaptive RSI Trailing Stop is an indicator that integrates Gaussian-weighted RSI calculations with real-time divergence detection and a dynamic ATR-based trailing stop. This advanced approach allows traders to monitor momentum shifts, identify divergences early, and manage risk with adaptive trailing stop levels that adjust to price action.
👽 What Makes the Adaptive RSI with Signals and Trailing Stop Unique?
Unlike traditional RSI indicators, this version applies a Gaussian-weighted smoothing algorithm, making it more responsive to price action while reducing noise. Additionally, the trailing stop feature dynamically adjusts based on volatility and trend conditions, allowing traders to:
Detects real-time divergences (bullish/bearish) with a smart pivot-based system.
Filter noise with Gaussian weighting, ensuring smoother RSI transitions.
Utilize crossover-based trailing stop activation, for systematic trade management.
👽 The Math Behind the Indicator
👾 Gaussian Weighted RSI Calculation
Traditional RSI calculations rely on simple averages of gains and losses. Instead, this indicator weights recent price changes using a Gaussian distribution, prioritizing more relevant data points while maintaining smooth transitions.
Key Features:
Exponential decay ensures recent price changes are weighted more heavily.
Reduces short-term noise while maintaining responsiveness.
👾 Real-Time Divergence Detection
The indicator detects bullish and bearish divergences using pivot points on RSI compared to price action.
👾 Dynamic ATR-Based Trailing Stop
Bullish Trailing Stop: Activates when RSI crosses above 20 and dynamically adjusts based on low - ATR multiplier.
Bearish Trailing Stop: Activates when RSI crosses below 80 and adjusts based on high + ATR multiplier
This allows traders to:
Lock in profits systematically by adjusting stop-losses dynamically.
Stay in trades longer while maintaining adaptive risk management.
👽 How It Adapts to Market Movements
✔️ Gaussian Filtering ensures smooth RSI transitions while preventing excessive lag.
✔️ Real-Time Divergence Alerts provide early trade signals based on price-RSI discrepancies.
✔️ ATR Trailing Stop dynamically expands or contracts based on market volatility.
✔️ Crossover-Based Activation enables the stop-loss system only when RSI confirms a momentum shift.
👽 How Traders Can Use This Indicator
👾 Divergence Trading
Traders can use real-time divergence detection to anticipate reversals before they happen.
Bullish Divergence Setup:
Look for RSI making a higher low, while price makes a lower low.
Enter long when RSI confirms upward momentum.
Bearish Divergence Setup:
Look for RSI making a lower high, while price makes a higher high.
Enter short when RSI confirms downward momentum.
👾 Trailing Stop Signals
Bullish Signal and Trailing Stop Activation:
When RSI crosses above 20, a trailing stop is placed using low - ATR multiplier.
If price crosses below the stop, it exits the trade and removes the stop.
Bearish Signal and Trailing Stop Activation:
When RSI crosses below 80, a trailing stop is placed using high + ATR multiplier.
If price crosses above the stop, it exits the trade and removes the stop.
This makes trend-following strategies more efficient, while ensuring proper risk management.
👽 Why It’s Useful for Traders
✔️ Dynamic and Adaptive: Adjusts to changing market conditions automatically.
✔️ Noise Reduction: Gaussian-weighted RSI reduces short-term price distortions.
✔️ Comprehensive Strategy Tool: Combines momentum detection, divergence analysis, and automated risk management into a single indicator.
✔️ Works Across Markets & Timeframes: Suitable for stocks, forex, crypto, and futures trading.
👽 Indicator Settings
RSI Length: Defines the lookback period for RSI smoothing.
Gaussian Sigma: Controls how much weight is given to recent data points.
Enable Signal Line: Option to display an RSI-based moving average.
Divergence Lookback: Configures how far back pivot points are detected.
Crossover/crossunder values for signals: Set the crossover/crossunder values that triggers signals.
ATR Multiplier: Adjusts trailing stop sensitivity to market volatility.
Disclaimer: This indicator is designed for educational purposes and does not constitute financial advice. Please consult a qualified financial advisor before making investment decisions.

Gaps Trend [ChartPrime]The Gaps Trend - ChartPrime indicator is designed to detect Fair Value Gaps (FVGs) in the market and apply a trailing stop mechanism based on those gaps. It identifies both bullish and bearish gaps and provides traders with a way to manage trades dynamically as gaps appear. The indicator visually highlights gaps and uses the detected momentum to assess trend direction, helping traders identify price imbalances caused by strong buy or sell pressure.
⯁ KEY FEATURES & HOW TO USE
⯌ Fair Value Gap (FVG) Detection :
The indicator automatically detects both bullish and bearish FVGs, identifying gaps between candle highs and lows. Bullish gaps are shown in green, and bearish gaps in purple. These gaps indicate price imbalances driven by strong momentum, such as when there is significant buying or selling pressure.
Use : Traders can use FVG detection to identify periods of high price momentum, offering insight into potential continuation or exhaustion of trends.
⯌ Trailing Stop Feature Based on FVGs :
A core feature of this indicator is the trailing stop mechanism, which adjusts dynamically based on the identified FVGs. When a bullish gap is detected, the trailing stop is placed below the price to capture upward momentum, while bearish gaps result in a trailing stop placed above the price. This feature helps traders stay in trends while protecting profits as the price moves.
Use : The trailing stop follows the momentum of the price, ensuring that traders can stay in profitable trades during strong trends and exit when the momentum shifts.
bullish set up
bearish set up
⯌ Trend Direction Indication :
The indicator colors the chart according to the current trend direction based on the position of the price relative to the trailing stop. Green indicates an uptrend (bullish gap), while purple shows a downtrend (bearish gap). This provides traders with a quick visual assessment of trend direction based on the presence of gaps.
Use : Traders can monitor the chart's color to stay aligned with the market’s trend, staying long during green phases and short during purple ones.
⯌ Gap Size Filtering :
Each detected gap is assigned a numerical ranking based on its size, with larger gaps having higher rankings. The gap size filter allows traders to only display gaps that meet a minimum size threshold, focusing on the most impactful gaps in terms of price movement.
Use : Traders can use the filter to focus on gaps of a certain size, filtering out smaller, less significant gaps. The numerical ranking helps identify the largest and most influential gaps for decision-making.
⯌ FVG Level Visualization :
The indicator can display dashed lines marking the levels of previously filled FVGs. These levels represent areas where price once experienced a gap and later filled it. Monitoring these levels can provide traders with key reference points for potential reactions in price.
Use : Traders can use these gap levels to track where price has filled gaps and potentially use these levels as zones for entry, exit, or assessing market behavior.
⯁ USER INPUTS
Filter Gaps : Adjust the size threshold to filter gaps by their size ranking.
Show Gap Levels : Toggle the display of dashed lines at filled FVG levels.
Enable Trailing Stop : Activate or deactivate the trailing stop feature based on FVGs.
Trailing Stop Length : Set the number of bars used to calculate the trailing stop.
Bullish/Bearish Colors : Customize the colors representing bullish and bearish gaps.
⯁ CONCLUSION
The Gaps Trend indicator combines Fair Value Gap detection with a dynamic trailing stop feature to help traders manage trades during periods of high price momentum. By detecting gaps caused by strong buy or sell pressure and applying adaptive stops, the indicator provides a powerful tool for riding trends and managing risk. The additional ability to filter gaps by size and visualize previously filled gaps enhances its utility for both trend-following and risk management strategies.

ottlibLibrary "ottlib"
█ OVERVIEW
This library contains functions for the calculation of the OTT (Optimized Trend Tracker) and its variants, originally created by Anıl Özekşi (Anil_Ozeksi). Special thanks to him for the concept and to Kıvanç Özbilgiç (KivancOzbilgic) and dg_factor (dg_factor) for adapting them to Pine Script.
█ WHAT IS "OTT"
The OTT (Optimized Trend Tracker) is a highly customizable and very effective trend-following indicator that relies on moving averages and a trailing stop at its core. Moving averages help reduce noise by smoothing out sudden price movements in the markets, while trailing stops assist in detecting trend reversals with precision. Initially developed as a noise-free trailing stop, the current variants of OTT range from rapid trend reversal detection to long-term trend confirmation, thanks to its extensive customizability.
It's well-known variants are:
OTT (Optimized Trend Tracker).
TOTT (Twin OTT).
OTT Channels.
RISOTTO (RSI OTT).
SOTT (Stochastic OTT).
HOTT & LOTT (Highest & Lowest OTT)
ROTT (Relative OTT)
FT (Original name is Fırsatçı Trend in Turkish which translates to Opportunist Trend)
█ LIBRARY FEATURES
This library has been prepared in accordance with the style, coding, and annotation standards of Pine Script version 5. As a result, explanations and examples will appear when users hover over functions or enter function parameters in the editor.
█ USAGE
Usage of this library is very simple. Just import it to your script with the code below and use its functions.
import ismailcarlik/ottlib/1 as ottlib
█ FUNCTIONS
• f_vidya(source, length, cmoLength)
Short Definition: Chande's Variable Index Dynamic Average (VIDYA).
Details: This function computes Chande's Variable Index Dynamic Average (VIDYA), which serves as the original moving average for OTT. The 'length' parameter determines the number of bars used to calculate the average of the given source. Lower values result in less smoothing of prices, while higher values lead to greater smoothing. While primarily used internally in this library, it has been made available for users who wish to utilize it as a moving average or use in custom OTT implementations.
Parameters:
source (float) : (series float) Series of values to process.
length (simple int) : (simple int) Number of bars to lookback.
cmoLength (simple int) : (simple int) Number of bars to lookback for calculating CMO. Default value is `9`.
Returns: (float) Calculated average of `source` for `length` bars back.
Example:
vidyaValue = ottlib.f_vidya(source = close, length = 20)
plot(vidyaValue, color = color.blue)
• f_mostTrail(source, multiplier)
Short Definition: Calculates trailing stop value.
Details: This function calculates the trailing stop value for a given source and the percentage. The 'multiplier' parameter defines the percentage of the trailing stop. Lower values are beneficial for catching short-term reversals, while higher values aid in identifying long-term trends. Although only used once internally in this library, it has been made available for users who wish to utilize it as a traditional trailing stop or use in custom OTT implementations.
Parameters:
source (float) : (series int/float) Series of values to process.
multiplier (simple float) : (simple float) Percent of trailing stop.
Returns: (float) Calculated value of trailing stop.
Example:
emaValue = ta.ema(source = close, length = 14)
mostValue = ottlib.f_mostTrail(source = emaValue, multiplier = 2.0)
plot(mostValue, color = emaValue >= mostValue ? color.green : color.red)
• f_ottTrail(source, multiplier)
Short Definition: Calculates OTT-specific trailing stop value.
Details: This function calculates the trailing stop value for a given source in the manner used in OTT. Unlike a traditional trailing stop, this function modifies the traditional trailing stop value from two bars prior by adjusting it further with half the specified percentage. The 'multiplier' parameter defines the percentage of the trailing stop. Lower values are beneficial for catching short-term reversals, while higher values aid in identifying long-term trends. Although primarily used internally in this library, it has been made available for users who wish to utilize it as a trailing stop or use in custom OTT implementations.
Parameters:
source (float) : (series int/float) Series of values to process.
multiplier (simple float) : (simple float) Percent of trailing stop.
Returns: (float) Calculated value of OTT-specific trailing stop.
Example:
vidyaValue = ottlib.f_vidya(source = close, length = 20)
ottValue = ottlib.f_ottTrail(source = vidyaValue, multiplier = 1.5)
plot(ottValue, color = vidyaValue >= ottValue ? color.green : color.red)
• ott(source, length, multiplier)
Short Definition: Calculates OTT (Optimized Trend Tracker).
Details: The OTT consists of two lines. The first, known as the "Support Line", is the VIDYA of the given source. The second, called the "OTT Line", is the trailing stop based on the Support Line. The market is considered to be in an uptrend when the Support Line is above the OTT Line, and in a downtrend when it is below.
Parameters:
source (float) : (series float) Series of values to process. Default value is `close`.
length (simple int) : (simple int) Number of bars to lookback. Default value is `2`.
multiplier (simple float) : (simple float) Percent of trailing stop. Default value is `1.4`.
Returns: ( [ float, float ]) Tuple of `supportLine` and `ottLine`.
Example:
= ottlib.ott(source = close, length = 2, multiplier = 1.4)
longCondition = ta.crossover(supportLine, ottLine)
shortCondition = ta.crossunder(supportLine, ottLine)
• tott(source, length, multiplier, bandsMultiplier)
Short Definition: Calculates TOTT (Twin OTT).
Details: TOTT consists of three lines: the "Support Line," which is the VIDYA of the given source; the "Upper Line," a trailing stop of the Support Line adjusted with an added multiplier; and the "Lower Line," another trailing stop of the Support Line, adjusted with a reduced multiplier. The market is considered in an uptrend if the Support Line is above the Upper Line and in a downtrend if it is below the Lower Line.
Parameters:
source (float) : (series float) Series of values to process. Default value is `close`.
length (simple int) : (simple int) Number of bars to lookback. Default value is `40`.
multiplier (simple float) : (simple float) Percent of trailing stop. Default value is `0.6`.
bandsMultiplier (simple float) : Multiplier for bands. Default value is `0.0006`.
Returns: ( [ float, float, float ]) Tuple of `supportLine`, `upperLine` and `lowerLine`.
Example:
= ottlib.tott(source = close, length = 40, multiplier = 0.6, bandsMultiplier = 0.0006)
longCondition = ta.crossover(supportLine, upperLine)
shortCondition = ta.crossunder(supportLine, lowerLine)
• ott_channel(source, length, multiplier, ulMultiplier, llMultiplier)
Short Definition: Calculates OTT Channels.
Details: OTT Channels comprise nine lines. The central line, known as the "Mid Line," is the OTT of the given source's VIDYA. The remaining lines are positioned above and below the Mid Line, shifted by specified multipliers.
Parameters:
source (float) : (series float) Series of values to process. Default value is `close`
length (simple int) : (simple int) Number of bars to lookback. Default value is `2`
multiplier (simple float) : (simple float) Percent of trailing stop. Default value is `1.4`
ulMultiplier (simple float) : (simple float) Multiplier for upper line. Default value is `0.01`
llMultiplier (simple float) : (simple float) Multiplier for lower line. Default value is `0.01`
Returns: ( [ float, float, float, float, float, float, float, float, float ]) Tuple of `ul4`, `ul3`, `ul2`, `ul1`, `midLine`, `ll1`, `ll2`, `ll3`, `ll4`.
Example:
= ottlib.ott_channel(source = close, length = 2, multiplier = 1.4, ulMultiplier = 0.01, llMultiplier = 0.01)
• risotto(source, length, rsiLength, multiplier)
Short Definition: Calculates RISOTTO (RSI OTT).
Details: RISOTTO comprised of two lines: the "Support Line," which is the VIDYA of the given source's RSI value, calculated based on the length parameter, and the "RISOTTO Line," a trailing stop of the Support Line. The market is considered in an uptrend when the Support Line is above the RISOTTO Line, and in a downtrend if it is below.
Parameters:
source (float) : (series float) Series of values to process. Default value is `close`.
length (simple int) : (simple int) Number of bars to lookback. Default value is `50`.
rsiLength (simple int) : (simple int) Number of bars used for RSI calculation. Default value is `100`.
multiplier (simple float) : (simple float) Percent of trailing stop. Default value is `0.2`.
Returns: ( [ float, float ]) Tuple of `supportLine` and `risottoLine`.
Example:
= ottlib.risotto(source = close, length = 50, rsiLength = 100, multiplier = 0.2)
longCondition = ta.crossover(supportLine, risottoLine)
shortCondition = ta.crossunder(supportLine, risottoLine)
• sott(source, kLength, dLength, multiplier)
Short Definition: Calculates SOTT (Stochastic OTT).
Details: SOTT is comprised of two lines: the "Support Line," which is the VIDYA of the given source's Stochastic value, based on the %K and %D lengths, and the "SOTT Line," serving as the trailing stop of the Support Line. The market is considered in an uptrend when the Support Line is above the SOTT Line, and in a downtrend when it is below.
Parameters:
source (float) : (series float) Series of values to process. Default value is `close`.
kLength (simple int) : (simple int) Stochastic %K length. Default value is `500`.
dLength (simple int) : (simple int) Stochastic %D length. Default value is `200`.
multiplier (simple float) : (simple float) Percent of trailing stop. Default value is `0.5`.
Returns: ( [ float, float ]) Tuple of `supportLine` and `sottLine`.
Example:
= ottlib.sott(source = close, kLength = 500, dLength = 200, multiplier = 0.5)
longCondition = ta.crossover(supportLine, sottLine)
shortCondition = ta.crossunder(supportLine, sottLine)
• hottlott(length, multiplier)
Short Definition: Calculates HOTT & LOTT (Highest & Lowest OTT).
Details: HOTT & LOTT are composed of two lines: the "HOTT Line", which is the OTT of the highest price's VIDYA, and the "LOTT Line", the OTT of the lowest price's VIDYA. A high price surpassing the HOTT Line can be considered a long signal, while a low price dropping below the LOTT Line may indicate a short signal.
Parameters:
length (simple int) : (simple int) Number of bars to lookback. Default value is `20`.
multiplier (simple float) : (simple float) Percent of trailing stop. Default value is `0.6`.
Returns: ( [ float, float ]) Tuple of `hottLine` and `lottLine`.
Example:
= ottlib.hottlott(length = 20, multiplier = 0.6)
longCondition = ta.crossover(high, hottLine)
shortCondition = ta.crossunder(low, lottLine)
• rott(source, length, multiplier)
Short Definition: Calculates ROTT (Relative OTT).
Details: ROTT comprises two lines: the "Support Line", which is the VIDYA of the given source, and the "ROTT Line", the OTT of the Support Line's VIDYA. The market is considered in an uptrend if the Support Line is above the ROTT Line, and in a downtrend if it is below. ROTT is similar to OTT, but the key difference is that the ROTT Line is derived from the VIDYA of two bars of Support Line, not directly from it.
Parameters:
source (float) : (series float) Series of values to process. Default value is `close`.
length (simple int) : (simple int) Number of bars to lookback. Default value is `200`.
multiplier (simple float) : (simple float) Percent of trailing stop. Default value is `0.1`.
Returns: ( [ float, float ]) Tuple of `supportLine` and `rottLine`.
Example:
= ottlib.rott(source = close, length = 200, multiplier = 0.1)
isUpTrend = supportLine > rottLine
isDownTrend = supportLine < rottLine
• ft(source, length, majorMultiplier, minorMultiplier)
Short Definition: Calculates Fırsatçı Trend (Opportunist Trend).
Details: FT is comprised of two lines: the "Support Line", which is the VIDYA of the given source, and the "FT Line", a trailing stop of the Support Line calculated using both minor and major trend values. The market is considered in an uptrend when the Support Line is above the FT Line, and in a downtrend when it is below.
Parameters:
source (float) : (series float) Series of values to process. Default value is `close`.
length (simple int) : (simple int) Number of bars to lookback. Default value is `30`.
majorMultiplier (simple float) : (simple float) Percent of major trend. Default value is `3.6`.
minorMultiplier (simple float) : (simple float) Percent of minor trend. Default value is `1.8`.
Returns: ( [ float, float ]) Tuple of `supportLine` and `ftLine`.
Example:
= ottlib.ft(source = close, length = 30, majorMultiplier = 3.6, minorMultiplier = 1.8)
longCondition = ta.crossover(supportLine, ftLine)
shortCondition = ta.crossunder(supportLine, ftLine)
█ CUSTOM OTT CREATION
Users can create custom OTT implementations using f_ottTrail function in this library. The example code which uses EMA of 7 period as moving average and calculates OTT based of it is below.
Source Code:
//@version=5
indicator("Custom OTT", shorttitle = "COTT", overlay = true)
import ismailcarlik/ottlib/1 as ottlib
src = input.source(close, title = "Source")
length = input.int(7, title = "Length", minval = 1)
multiplier = input.float(2.0, title = "Multiplier", minval = 0.1)
support = ta.ema(source = src, length = length)
ott = ottlib.f_ottTrail(source = support, multiplier = multiplier)
pSupport = plot(support, title = "Moving Average Line (Support)", color = color.blue)
pOtt = plot(ott, title = "Custom OTT Line", color = color.orange)
fillColor = support >= ott ? color.new(color.green, 60) : color.new(color.red, 60)
fill(pSupport, pOtt, color = fillColor, title = "Direction")
Result:
█ DISCLAIMER
Trading is risky and most of the day traders lose money eventually. This library and its functions are only for educational purposes and should not be construed as financial advice. Past performances does not guarantee future results.
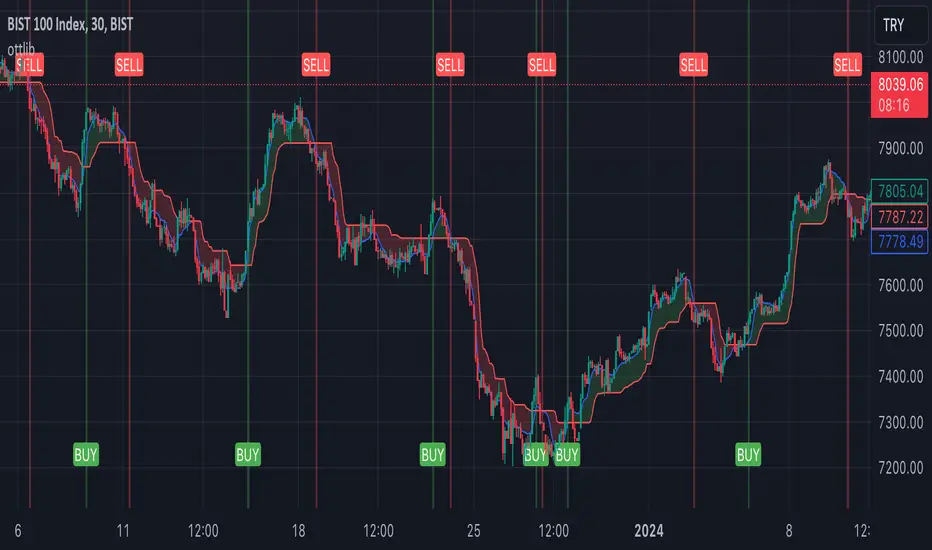
3LS | 3 Line Strike Strategy [Kintsugi Trading]What is the 3LS | 3 Line Strike Strategy?
Incorporating the 3 Line Strike candlestick pattern into our strategy was inspired by Arty at The Moving Average and the amazing traders at TheTrdFloor .
The Three Line Strike is a trend continuation candlestick pattern consisting of four candles. Depending on their heights and collocation, a bullish or a bearish trend continuation can be predicted.
In a symphony of trend analysis, price action, and volume we can find and place high-probability trades with the 3LS Strategy.
How to use it!
----- First, start by choosing a Stop-Loss Strategy, Stop PIP Size, and Risk/Reward Ratio -----
- Stop-Loss Strategy
Fixed PIP Size – This uses the top/bottom of the indicator candle and places a TP based on the chosen Risk:Reward ratio.
ATR Trail (No set Target Profit, only uses ATR Stop)
ATR Trail-Stop (Has set Target Profit, however, stop is based on ATR inputs)
**If you choose an ATR Stop-Loss Strategy - input the desired ATR period and Multiple you would like the stop to be calculated at**
**ATR Stop-Loss Strategies have a unique alert setup for Auto-Trading. See Auto-Trading Section**
- Risk/Reward Ratio = If you have a .5 risk/reward, it means you are risking $100 to make $50.
- Additional Stop PIP Size = Number of PIPs over the default stop location of the top or bottom of the indicator candle.
----- Next, we set the Session Filter -----
Set the Timezone and Trade Session you desire. If no specific session is desired, simply set the Trade Session to 00:00 - 00:00.
----- Next, we set the Moving Average Cloud Fill -----
Enter the Fast and Slow Moving Average Length used to calculate trend direction:
MA Period Fast
MA Period Slow
These inputs will determine whether the strategy looks for Long or Short positions.
----- Next, we set the VSA – Volume Spread Analysis Settings -----
Check the box to show the indicator at the bottom of the chart if desired.
This is just a different visual output of the VSA | Volume Spread Analysis indicator available for free under the community indicators tab. You can add that indicator to your chart and see the same output in candle format.
In combination with the Moving Average Cloud, the Volume Spread Analysis will help us determine when to take a trade and in what direction.
The strategy is essentially looking for small reversals going against the overall trend and placing a trade once that reversal ends and the price moves back in the direction of the overall trend.
The 3LS Strategy utilizes confirmation between trend, volume, and price action to place high probability trades.
The VSA is completely customizable by:
Moving Average Length
MA-1 Multiplier
MA-2 Multiplier
MA-3 Multiplier
Check out the VSA | Volume Spread Analysis indicator in the community scripts section under the indicators tab to use this awesome resource on other strategies.
----- Next, we have the option to view the automated KT Bull/Bear Signals -----
Check the boxes to show the buy-sell signal on the chart if desired.
----- Next, we set the risk we want to use if Auto Trading the strategy -----
I always suggest using no more than 1-3% of your total account balance per trade. Remember, if you have multiple strategies triggering per day with each using 1%, the total percent at risk will be much larger.
For Example – if you have 10 strategies each risking 1% your total risk is 10% of your account, not 1%! Be mindful to only use 1-3% of your total account balance across all strategies, not just each individual one.
----- Finally, we backtest our ideas -----
After using the 'Strategy Tester' tab on TradingView to thoroughly backtest your predictions you are ready to take it to the next level - Automated Trading!
This was my whole reason for creating the script. If you work a full-time job, live in a time zone that is hard to trade, or just don't have the patience, this will be a game-changer for you as it was for me.
Auto-Trading
When it comes to auto-trading this strategy I have included two options in the script that utilize the alert messages generated by TradingView.
*Note: Please trade on a demo account until you feel comfortable enough to use real money, and then please stick to 1%-2% of your total account value in risk per trade.*
AutoView
PineConnector
**ATR Auto-Trading Alert Setup**
How to create alerts on 3 Line Strike Strategy
For Trailing Stops:
1) Adjust autoview/pineconnector settings
2) Click "add alert"
3) Select "Condition" = Strategy Name
4) Select "Order Fills Only" from the drop-down
3) Remove template message text from "message" box and place the exact text. '{{strategy.order.alert_message}}'
4) Click "create"
For Fixed Pip Stop:
1) Adjust autoview/pineconnector settings
2) Click "add alert"
3) Select "Condition" = Strategy Name
4) Select "alert() function calls only"
5) I like to title my Alert Name the same thing I named it as an Indicator Template to keep track
Good luck with your trading!

Move Up StopsThis script creates a stop loss level and then moves it up in 5% increments as prices increase.
Basically, it checks to see if the lowest low of the last 7 days is above a certain level. If yes, it sets the stop at that level. It then checks for the next highest level and keeps going until the price is not above a level. Those variables are then set to the level below them.
Trailing stops are notorious for skewing backtest results. This script avoids that problem. Also, some exchanges do not offer trailing stops, so this script gives you a signal to let you know its time to manually move your stops up.
I will be using this for swing trades involving both crypto and stocks.

CryptoFlux Dynamo [JOAT]CryptoFlux Dynamo: Velocity Scalping Strategy
WHAT THIS STRATEGY IS
CryptoFlux Dynamo is an open-source Pine Script v6 strategy designed for momentum-based scalping on cryptocurrency perpetual futures. It combines multiple technical analysis methods into a unified system that adapts its behavior based on current market volatility conditions.
This script is published open-source so you can read, understand, and modify the complete logic. The description below explains everything the strategy does so that traders who cannot read Pine Script can fully understand how it works before using it.
HOW THIS STRATEGY IS ORIGINAL AND WHY THE INDICATORS ARE COMBINED
This strategy uses well-known indicators (MACD, EMA, RSI, MFI, Bollinger Bands, Keltner Channels, ATR). The originality is not in the individual indicators themselves, but in the specific way they are integrated into a regime-adaptive system. Here is the detailed justification for why these components are combined and how they work together:
The Problem Being Solved:
Standard indicator-based strategies use fixed thresholds. For example, a typical MACD strategy might enter when the histogram crosses above zero. However, in cryptocurrency markets, volatility changes dramatically throughout the day and week. A MACD crossover during a low-volatility consolidation period has very different implications than the same crossover during a high-volatility trending period. Using the same entry thresholds and stop distances in both conditions leads to either:
Too many false signals during consolidation (if thresholds are loose)
Missing valid opportunities during expansion (if thresholds are tight)
Stops that are too tight during volatility spikes (causing premature exits)
Stops that are too wide during compression (giving back profits)
The Solution Approach:
This strategy first classifies the current volatility regime using normalized ATR (ATR as a percentage of price), then dynamically adjusts ALL other parameters based on that classification. This creates a context-aware system rather than a static threshold comparison.
How Each Component Contributes to the System:
ATR-Based Regime Classification (The Foundation)
The strategy calculates ATR over 21 periods, smooths it with a 13-period EMA to reduce noise from wicks, then divides by price to get a normalized percentage. This ATR% is classified into three regimes:
- Compression (ATR% < 0.8%): Market is consolidating, breakouts are more likely but false signals are common
- Expansion (ATR% 0.8% - 1.6%): Normal trending conditions
- Velocity (ATR% > 1.6%): High volatility, larger moves but also larger adverse excursions
This regime classification then controls stop distances, profit targets, trailing stop offsets, and signal strength requirements. The regime acts as a "meta-parameter" that tunes the entire system.
EMA Ribbon (8/21/34) - Trend Structure Detection
The three EMAs establish trend direction and structure. When EMA 8 > EMA 21 > EMA 34, the trend structure is bullish. The slope of the middle EMA (21) is calculated over 8 bars and converted to degrees using arctangent. This slope measurement quantifies trend strength, not just direction.
Why these specific periods? The 8/21/34 sequence follows Fibonacci-like spacing and provides good separation on 5-minute cryptocurrency charts. The fast EMA (8) responds to immediate price action, the mid EMA (21) represents the short-term trend, and the slow EMA (34) acts as a trend filter.
The EMA ribbon works with the regime classification: during compression regimes, the strategy requires stronger ribbon alignment before entry because false breakouts are more common.
MACD (8/21/5) - Momentum Measurement
The MACD uses faster parameters (8/21/5) than the standard (12/26/9) because cryptocurrency markets move faster than traditional markets. The histogram is smoothed with a 5-period EMA to reduce noise.
The key innovation is the adaptive histogram baseline. Instead of using a fixed threshold, the strategy calculates a rolling baseline from the smoothed absolute histogram value, then multiplies by a sensitivity factor (1.15). This means the threshold for "significant momentum" automatically adjusts based on recent momentum levels.
The MACD works with the regime classification: during velocity regimes, the histogram baseline is effectively higher because recent momentum has been stronger, preventing entries on relatively weak momentum.
RSI (21 period) and MFI (21 period) - Independent Momentum Confirmation
RSI measures momentum using price changes only. MFI (Money Flow Index) measures momentum using price AND volume. By requiring both to confirm, the strategy filters out price moves that lack volume support.
The 21-period length is longer than typical (14) to reduce noise on 5-minute charts. The trigger threshold (55 for longs, 45 for shorts) is slightly offset from 50 to require momentum in the trade direction, not just neutral readings.
These indicators work together: a signal requires RSI > 55 AND MFI > 55 for longs. This dual confirmation reduces false signals from price manipulation or low-volume moves.
Bollinger Bands (1.5 mult) and Keltner Channels (1.8 mult) - Squeeze Detection
When Bollinger Bands contract inside Keltner Channels, volatility is compressing and a breakout is likely. This is the "squeeze" condition. When the bands expand back outside the channels, the squeeze "releases."
The strategy uses a 1.5 multiplier for Bollinger Bands (tighter than standard 2.0) and 1.8 for Keltner Channels. These values were chosen to identify meaningful squeezes on 5-minute cryptocurrency charts without triggering too frequently.
The squeeze detection works with the regime classification: squeeze releases during compression regimes receive additional signal strength points because breakouts from consolidation are more significant.
Volume Impulse Detection - Institutional Participation Filter
The strategy calculates a volume baseline (34-period SMA) and standard deviation. A "volume impulse" is detected when current volume exceeds the baseline by 1.15x OR when the volume z-score exceeds 0.5.
This filter ensures entries occur when there is meaningful market participation, not during low-volume periods where price moves are less reliable.
Volume impulse is required for all entries and adds points to the composite signal strength score.
Cycle Oscillator - Trend Alignment Filter
The strategy calculates a 55-period EMA as a cycle basis, then measures price deviation from this basis as a percentage. When price is more than 0.15% above the cycle basis, the cycle is bullish. When more than 0.15% below, the cycle is bearish.
This filter prevents counter-trend entries. Long signals require bullish cycle alignment; short signals require bearish cycle alignment.
BTC Dominance Filter (Optional) - Market Regime Filter
The strategy can optionally use BTC.D (Bitcoin Dominance) as a market regime filter. When BTC dominance is rising (slope > 0.12), the market is in "risk-off" mode and long entries on altcoins are filtered. When dominance is falling (slope < -0.12), short entries are filtered.
This filter is optional because the BTC.D data feed may lag during low-liquidity periods.
How The Components Work Together (The Mashup Justification):
The strategy uses a composite scoring system where each signal pathway contributes points:
Trend Break pathway (30 points): Requires EMA ribbon alignment + positive slope + price breaks above recent structure high
Momentum Surge pathway (30 points): Requires MACD histogram > adaptive baseline + MACD line > signal + RSI > 55 + MFI > 55 + volume impulse
Squeeze Release pathway (25 points): Requires BB inside KC (squeeze) then release + momentum bias + histogram confirmation
Micro Pullback pathway (15 points): Requires shallow retracement to fast EMA within established trend + histogram confirmation + volume impulse
Additional modifiers:
+5 points if volume impulse is present, -5 if absent
+5 points in velocity regime, -2 in compression regime
+5 points if cycle is aligned, -5 if counter-trend
A trade only executes when the composite score reaches the minimum threshold (default 55) AND all filters agree (session, cycle bias, BTC dominance if enabled).
This scoring system is the core innovation: instead of requiring ALL conditions to be true (which would generate very few signals) or ANY condition to be true (which would generate too many false signals), the strategy requires ENOUGH conditions to be true, with different conditions contributing different weights based on their reliability.
HOW THE STRATEGY CALCULATES ENTRIES AND EXITS
Entry Logic:
1. Calculate current volatility regime from ATR%
2. Calculate all indicator values (MACD, EMA, RSI, MFI, squeeze, volume)
3. Evaluate each signal pathway and sum points
4. Check all filters (session, cycle, dominance, kill switch)
5. If composite score >= 55 AND all filters pass, generate entry signal
6. Calculate position size based on risk per trade and regime-adjusted stop distance
7. Execute entry with regime name as comment
Position Sizing Formula:
RiskCapital = Equity * (0.65 / 100)
StopDistance = ATR * StopMultiplier(regime)
RawQuantity = RiskCapital / StopDistance
MaxQuantity = Equity * (12 / 100) / Price
Quantity = min(RawQuantity, MaxQuantity)
Quantity = round(Quantity / 0.001) * 0.001
This ensures each trade risks approximately 0.65% of equity regardless of volatility, while capping total exposure at 12% of equity.
Stop Loss Calculation:
Stop distance is ATR multiplied by a regime-specific multiplier:
Compression regime: 1.05x ATR (tighter stops because moves are smaller)
Expansion regime: 1.55x ATR (standard stops)
Velocity regime: 2.1x ATR (wider stops to avoid premature exits during volatility)
Take Profit Calculation:
Target distance is ATR multiplied by regime-specific multiplier and base risk/reward:
Compression regime: 1.6x ATR * 1.8 base R:R * 0.9 regime bonus = approximately 2.6x ATR
Expansion regime: 2.05x ATR * 1.8 base R:R * 1.0 regime bonus = approximately 3.7x ATR
Velocity regime: 2.8x ATR * 1.8 base R:R * 1.15 regime bonus = approximately 5.8x ATR
Trailing Stop Logic:
When adaptive trailing is enabled, the strategy calculates a trailing offset based on ATR and regime:
Compression regime: 1.1x base offset (looser trailing to avoid noise)
Expansion regime: 1.0x base offset (standard)
Velocity regime: 0.8x base offset (tighter trailing to lock in profits during fast moves)
The trailing stop only activates when it would be tighter than the initial stop.
Momentum Fail-Safe Exits:
The strategy closes positions early if momentum reverses:
Long positions close if MACD histogram turns negative OR EMA ribbon structure breaks (fast EMA crosses below mid EMA)
Short positions close if MACD histogram turns positive OR EMA ribbon structure breaks
This prevents holding through momentum reversals even if stop loss hasn't been hit.
Kill Switch:
If maximum drawdown exceeds 6.5%, the strategy disables new entries until manually reset. This prevents continued trading during adverse conditions.
HOW TO USE THIS STRATEGY
Step 1: Apply to Chart
Use a 5-minute chart of a high-liquidity cryptocurrency perpetual (BTC/USDT, ETH/USDT recommended)
Ensure at least 200 bars of history are loaded for indicator stabilization
Use standard candlestick charts only (not Heikin Ashi, Renko, or other non-standard types)
Step 2: Understand the Visual Elements
EMA Ribbon: Three lines (8/21/34 periods) showing trend structure. Bullish when stacked upward, bearish when stacked downward.
Background Color: Shows current volatility regime
- Indigo/dark blue = Compression (low volatility)
- Purple = Expansion (normal volatility)
- Magenta/pink = Velocity (high volatility)
Bar Colors: Reflect signal strength divergence. Brighter colors indicate stronger directional bias.
Triangle Markers: Entry signals. Up triangles below bars = long entry. Down triangles above bars = short entry.
Dashboard (top-right): Real-time display of regime, ATR%, signal strengths, position status, stops, targets, and risk metrics.
Step 3: Interpret the Dashboard
Regime: Current volatility classification (Compression/Expansion/Velocity)
ATR%: Normalized volatility as percentage of price
Long/Short Strength: Current composite signal scores (0-100)
Cycle Osc: Price deviation from 55-period EMA as percentage
Dominance: BTC.D slope and filter status
Position: Current position direction or "Flat"
Stop/Target: Current stop loss and take profit levels
Kill Switch: Status of drawdown protection
Volume Z: Current volume z-score
Impulse: Whether volume impulse condition is met
Step 4: Adjust Parameters for Your Needs
For more conservative trading: Increase "Minimum Composite Signal Strength" to 65 or higher
For more aggressive trading: Decrease to 50 (but expect more false signals)
For higher timeframes (15m+): Increase "Structure Break Window" to 12-15, increase "RSI Momentum Trigger" to 58
For lower liquidity pairs: Increase "Volume Impulse Multiplier" to 1.3, increase slippage in strategy properties
To disable short selling: Uncheck "Enable Short Structure"
To disable BTC dominance filter: Uncheck "BTC Dominance Confirmation"
STRATEGY PROPERTIES (BACKTEST SETTINGS)
These are the exact settings used in the strategy's Properties dialog box. You must use these same settings when evaluating the backtest results shown in the publication:
Initial Capital: $100,000
Justification: This amount is higher than typical retail accounts. I chose this value to demonstrate percentage-based returns that scale proportionally. The strategy uses percentage-based position sizing (0.65% risk per trade), so a $10,000 account would see the same percentage returns with 10x smaller position sizes. The absolute dollar amounts in the backtest should be interpreted as percentages of capital.
Commission: 0.04% (commission_value = 0.04)
Justification: This reflects typical perpetual futures exchange fees. Major exchanges charge between 0.02% (maker) and 0.075% (taker). The 0.04% value is a reasonable middle estimate. If your exchange charges different fees, adjust this value accordingly. Higher fees will reduce net profitability.
Slippage: 1 tick
Justification: This is conservative for liquid pairs like BTC/USDT on major exchanges during normal conditions. For less liquid altcoins or during high volatility, actual slippage may be higher. If you trade less liquid pairs, increase this value to 2-3 ticks for more realistic results.
Pyramiding: 1
Justification: No position stacking. The strategy holds only one position at a time. This simplifies risk management and prevents overexposure.
calc_on_every_tick: true
Justification: The strategy evaluates on every price update, not just bar close. This is necessary for scalping timeframes where waiting for bar close would miss opportunities. Note that this setting means backtest results may differ slightly from bar-close-only evaluation.
calc_on_order_fills: true
Justification: The strategy recalculates immediately after order fills for faster response to position changes.
RISK PER TRADE JUSTIFICATION
The default risk per trade is 0.65% of equity. This is well within the TradingView guideline that "risking more than 5-10% on a trade is not typically considered viable."
With the 12% maximum exposure cap, even if the strategy takes multiple consecutive losses, the total risk remains manageable. The kill switch at 6.5% drawdown provides additional protection by halting new entries during adverse conditions.
The position sizing formula ensures that stop distance (which varies by regime) is accounted for, so actual risk per trade remains approximately 0.65% regardless of volatility conditions.
SAMPLE SIZE CONSIDERATIONS
For statistically meaningful backtest results, you should select a dataset that generates at least 100 trades. On 5-minute BTC/USDT charts, this typically requires:
2-3 months of data during normal market conditions
1-2 months during high-volatility periods
3-4 months during low-volatility consolidation periods
The strategy's selectivity (requiring 55+ composite score plus all filters) means it generates fewer signals than less filtered approaches. If your backtest shows fewer than 100 trades, extend the date range or reduce the minimum signal strength threshold.
Fewer than 100 trades produces statistically unreliable results. Win rate, profit factor, and other metrics can vary significantly with small sample sizes.
STRATEGY DESIGN COMPROMISES AND LIMITATIONS
Every strategy involves trade-offs. Here are the compromises made in this design and the limitations you should understand:
Selectivity vs. Opportunity Trade-off
The 55-point minimum threshold filters many potential trades. This reduces false signals but also misses valid setups that don't meet all criteria. Lowering the threshold increases trade frequency but decreases win rate. There is no "correct" threshold; it depends on your preference for fewer higher-quality signals vs. more signals with lower individual quality.
Regime Classification Lag
The ATR-based regime detection uses historical data (21 periods + 13-period smoothing). It cannot predict sudden volatility spikes. During flash crashes or black swan events, the strategy may be classified in the wrong regime for several bars before the classification updates. This is an inherent limitation of any lagging indicator.
Indicator Parameter Sensitivity
The default parameters (MACD 8/21/5, EMA 8/21/34, RSI 21, etc.) are tuned for BTC/ETH perpetuals on 5-minute charts during 2024 market conditions. Different assets, timeframes, or market regimes may require different parameters. There is no guarantee that parameters optimized on historical data will perform similarly in the future.
BTC Dominance Filter Limitations
The CRYPTOCAP:BTC.D data feed may lag during low-liquidity periods or weekends. The dominance slope calculation uses a 5-bar SMA, adding additional delay. If you notice the filter behaving unexpectedly, consider disabling it.
Backtest vs. Live Execution Differences
TradingView backtesting does not replicate actual broker execution. Key differences:
Backtests assume perfect fills at calculated prices; real execution involves order book depth, latency, and partial fills
The calc_on_every_tick setting improves backtest realism but still cannot capture sub-bar price action or order book dynamics
Commission and slippage settings are estimates; actual costs vary by exchange, time of day, and market conditions
Funding rates on perpetual futures are not modeled in backtests and can significantly impact profitability over time
Exchange-specific limitations (position limits, liquidation mechanics, order types) are not modeled
Market Condition Dependencies
This strategy is designed for trending and breakout conditions. During extended sideways consolidation with no clear direction, the strategy may generate few signals or experience whipsaws. No strategy performs well in all market conditions.
Cryptocurrency-Specific Risks
Cryptocurrency markets operate 24/7 without session boundaries. This means:
No natural "overnight" risk reduction
Volatility can spike at any time
Liquidity varies significantly by time of day
Exchange outages or issues can occur at any time
WHAT THIS STRATEGY DOES NOT DO
To be straightforward about limitations:
This strategy does not guarantee profits. Past backtest performance does not indicate future results.
This strategy does not predict the future. It reacts to current conditions based on historical patterns.
This strategy does not account for funding rates, which can significantly impact perpetual futures profitability.
This strategy does not model exchange-specific execution issues (partial fills, requotes, outages).
This strategy does not adapt to fundamental news events or black swan scenarios.
This strategy is not optimized for all market conditions. It may underperform during extended consolidation.
IMPORTANT RISK WARNINGS
Past performance does not guarantee future results. The backtest results shown reflect specific historical market conditions and parameter settings. Markets change constantly, and strategies that performed well historically may underperform or lose money in the future. A single backtest run does not constitute proof of future profitability.
Trading involves substantial risk of loss. Cryptocurrency derivatives are highly volatile instruments. You can lose your entire investment. Only trade with capital you can afford to lose completely.
This is not financial advice. This strategy is provided for educational and informational purposes only. It does not constitute investment advice, trading recommendations, or any form of financial guidance. The author is not a licensed financial advisor.
You are responsible for your own decisions. Before using this strategy with real capital:
Thoroughly understand the code and logic by reading the open-source implementation
Forward test with paper trading or very small positions for an extended period
Verify that commission, slippage, and execution assumptions match your actual trading environment
Understand that live results will differ from backtest results
Consider consulting with a qualified financial advisor
No guarantees or warranties. This strategy is provided "as is" without any guarantees of profitability, accuracy, or suitability for any purpose. The author is not responsible for any losses incurred from using this strategy.
OPEN-SOURCE CODE STRUCTURE
The strategy code is organized into these sections for readability:
Configuration Architecture: Input parameters organized into logical groups (Core Controls, Optimization Constants, Regime Intelligence, Signal Pathways, Risk Architecture, Visualization)
Helper Functions: calcQty() for position sizing, clamp01() and normalize() for value normalization, calcMFI() for Money Flow Index calculation
Core Indicator Engine: EMA ribbon, ATR and regime classification, MACD with adaptive baseline, RSI, MFI, volume analytics, cycle oscillator, BTC dominance filter, squeeze detection
Signal Pathway Logic: Trend break, momentum surge, squeeze release, micro pullback pathways with composite scoring
Entry/Exit Orchestration: Signal filtering, position sizing, entry execution, stop/target calculation, trailing stop logic, momentum fail-safe exits
Visualization Layer: EMA plots, regime background, bar coloring, signal labels, dashboard table
You can read and modify any part of the code. Understanding the logic before deployment is strongly recommended.
- Made with passion by officialjackofalltrades

Smart Money Swing Strategy [All-in-One]# Pro Swing Trader 📈
A comprehensive swing trading indicator for TradingView that combines multiple confluence factors to identify high-probability trade setups with built-in risk management.
## 🎯 Overview
This indicator is designed for swing traders who want to catch momentum pullbacks with precision entries. It filters trades using multiple timeframe analysis, RSI zones, volume confirmation, and EMA trends to deliver only the highest-confidence setups.
### Key Features
✅ **Multi-Timeframe Confluence** - Confirms trades with higher timeframe analysis (Daily, 4H, etc.)
✅ **Smart Entry Signals** - Detects pullback-to-EMA reclaim patterns
✅ **Automatic Risk Management** - Calculates stops, targets, and R-multiples
✅ **Dynamic Stop Loss** - ATR trailing stop + break-even automation
✅ **Real-Time HUD Dashboard** - Live confluence scoring and trade metrics
✅ **Comprehensive Alerts** - Entry, TP1, TP2, and stop-loss notifications
✅ **Visual Trade Levels** - Clear on-chart stop-loss and take-profit lines
---
## 📊 How It Works
### Signal Logic
The indicator identifies two types of signals:
**Base Signals** (Small triangles):
- Price pulls back between Fast EMA and Slow EMA
- RSI is in the swing zone (40-60 by default)
- Price reclaims the Fast EMA with momentum
- Optional: Volume spike confirmation
**High-Confidence Signals** (Large triangles):
- All base signal criteria met
- Higher timeframe confirms the trend direction
- HTF RSI and slope alignment
- These are your primary trade signals
### Entry Conditions
#### Long Entry (🟢 HC L)
1. Fast EMA > Slow EMA (uptrend)
2. Previous candle closed between the EMAs (pullback)
3. Current candle crosses above and closes above Fast EMA (reclaim)
4. RSI between 40-60 (swing zone)
5. **HTF Confirmation**: Daily/4H price above EMA50, RSI > 50, positive slope
6. Optional: Volume > 1.5x 20-bar average
#### Short Entry (🔻 HC S)
1. Fast EMA < Slow EMA (downtrend)
2. Previous candle closed between the EMAs (pullback)
3. Current candle crosses below and closes below Fast EMA (reclaim)
4. RSI between 40-60 (swing zone)
5. **HTF Confirmation**: Daily/4H price below EMA50, RSI < 50, negative slope
6. Optional: Volume > 1.5x 20-bar average
---
## 🎛️ Settings & Parameters
### Trend Parameters
- **Fast EMA**: Default 20 - Quick trend detection
- **Slow EMA**: Default 50 - Major trend filter
- **Swing Lookback**: Default 10 - Bars to find swing high/low for stops
### RSI Settings
- **RSI Length**: Default 14
- **RSI Min**: Default 40 - Lower bound of swing zone
- **RSI Max**: Default 60 - Upper bound of swing zone
### Risk Management
- **Final TP Risk-Reward (R)**: Default 2.0 - Main profit target multiplier
- **TP1 R Multiple**: Default 1.0 - Partial profit target
- **Use Break-even Stop**: Move stop to entry after 1R profit
- **ATR Trailing Stop**: Dynamic stop based on ATR(14) x 2.0
### Filters
- **Require Volume Spike**: Optional volume confirmation filter
- **Use Higher TF Confirmation**: Enable multi-timeframe analysis
- **Higher TF**: Default "D" (Daily) - Can use 240 (4H), W (Weekly), etc.
---
## 📈 Dashboard (HUD)
The top-center dashboard shows real-time confluence status:
| Column | Meaning |
|--------|---------|
| **Trend** | Current trend direction (UP/DOWN/Flat) |
| **HTF** | Higher timeframe alignment (Bull/Bear/Flat) |
| **RSI Zone** | Is RSI in swing zone? (YES/NO) |
| **Volume** | Volume spike detected? (YES/NO) |
| **Signal** | Active signal type (HC LONG/HC SHORT/None) |
| **R Risk** | Current profit in R-multiples |
| **Stop** | Current stop-loss level |
| **TP1** | Partial take-profit status |
| **TP2** | Final take-profit status |
| **Conf %** | Overall confluence score (0-100%) |
### Confidence Score Breakdown
- **20%** - Trend present (up or down)
- **30%** - HTF confirmation aligned (or 15% if HTF off)
- **20%** - RSI in swing zone
- **10%** - Volume spike
- **20%** - High-confidence signal triggered
**Scoring**:
- 🟢 70%+ = High probability setup
- 🟡 40-69% = Moderate setup
- 🔴 <40% = Low probability
---
## 🔔 Alert Setup
The indicator includes 8 alert conditions:
### Entry Alerts
- **HC LONG ENTRY** - High-confidence long signal triggered
- **HC SHORT ENTRY** - High-confidence short signal triggered
### Profit Target Alerts
- **LONG TP1 Reached** - Hit partial profit (1R by default)
- **LONG Final TP Reached** - Hit final target (2R by default)
- **SHORT TP1 Reached** - Hit partial profit
- **SHORT Final TP Reached** - Hit final target
### Stop Loss Alerts
- **LONG Stop/BE/Trail Level Hit** - Long position stopped out
- **SHORT Stop/BE/Trail Level Hit** - Short position stopped out
### How to Set Up Alerts
1. Click "Add Alert" on TradingView
2. Choose this indicator from the dropdown
3. Select desired alert condition
4. Set alert to trigger "Once Per Bar Close"
5. Customize notification method (popup/email/webhook)
---
## 📋 Trading Workflow
### 1. Wait for High-Confidence Signal
Look for the large **HC L** or **HC S** triangle on chart close.
### 2. Verify Confluence
Check the HUD dashboard:
- Confidence score should be 70%+
- HTF status should show alignment
- RSI Zone should be "YES"
### 3. Entry
Enter the trade at market or on next candle open.
### 4. Set Stop Loss
Use the **initial stop** shown in the HUD (red line on chart):
- **Longs**: Below the swing low (10-bar lookback)
- **Shorts**: Above the swing high (10-bar lookback)
### 5. Set Take Profits
- **TP1**: 1R (50% position close) - Yellow line
- **TP2**: 2R (remaining 50% close) - Green line
### 6. Manage the Trade
- Monitor the **R Risk** column to track profit
- Stop moves to break-even automatically after 1R (if enabled)
- ATR trailing stop engages dynamically (red line adjusts)
- Exit if price hits dynamic stop level
---
## 🎨 Visual Guide
### On-Chart Elements
**Triangles**:
- Small lime/red triangles = Base signals (lower confidence)
- Large lime/red triangles = High-confidence signals (trade these!)
**Lines**:
- 🟢 Green line = Fast EMA (20)
- 🟠 Orange line = Slow EMA (50)
- 🔴 Red line = Dynamic stop-loss level
- 🟡 Yellow line = TP1 level
- 🟢 Green line = TP2 (final target)
**HUD Colors**:
- 🟢 Green = Bullish/Active/Good
- 🔴 Red = Bearish/Inactive/Warning
- 🟡 Yellow = Neutral/Caution
- 🔵 Blue = Informational
- ⚫ Gray = Disabled/Off
---
## 💡 Strategy Tips
### Best Practices
1. **Only trade High-Confidence signals** - Ignore base signals unless very experienced
2. **Respect the HTF** - Don't fight the higher timeframe trend
3. **Use proper position sizing** - Risk 1-2% of account per trade
4. **Partial profits work** - Take 50% off at TP1, let rest run to TP2
5. **Let winners run** - Trailing stop helps capture extended moves
6. **Be patient** - Quality over quantity; wait for 70%+ confluence
### Optimal Timeframes
- **Primary Chart**: 1H, 4H, Daily (swing trading)
- **HTF Setting**: One level higher than your chart
- If trading 1H → Set HTF to 4H or D
- If trading 4H → Set HTF to D or W
- If trading Daily → Set HTF to W
### Market Conditions
**Best Performance**:
- Trending markets with healthy pullbacks
- Clear support/resistance zones
- Moderate volatility
**Avoid Trading**:
- Extremely choppy/sideways markets
- Major news events (unless experienced)
- Low confidence scores (<40%)
---
## ⚙️ Advanced Customization
### Aggressive Setup (More Signals)
```
Fast EMA: 12
Slow EMA: 26
RSI Min: 35
RSI Max: 65
Use HTF Confirmation: OFF
Require Volume Spike: OFF
```
### Conservative Setup (Fewer, Higher Quality)
```
Fast EMA: 20
Slow EMA: 50
RSI Min: 45
RSI Max: 55
Use HTF Confirmation: ON
Require Volume Spike: ON
Final TP R: 3.0
```
### Scalping Adaptation (Not Recommended)
```
Fast EMA: 9
Slow EMA: 21
Swing Lookback: 5
TP1 R: 0.5
Final TP R: 1.0
```
---
## ⚠️ Risk Disclaimer
**IMPORTANT**: This indicator is for educational and informational purposes only.
- Past performance does not guarantee future results
- No indicator is 100% accurate
- Always use proper risk management
- Never risk more than you can afford to lose
- Consider using a demo account first
- Seek professional financial advice if needed
Trading involves substantial risk of loss and is not suitable for all investors.
---
## 🔧 Troubleshooting
### "No signals appearing"
- Check if HTF confirmation is enabled but market isn't aligned
- Verify RSI zone isn't too restrictive
- Ensure volume spike isn't filtering out all setups
- Try adjusting EMA lengths for your asset
### "Too many false signals"
- Enable HTF confirmation
- Tighten RSI zone (e.g., 45-55)
- Enable volume spike requirement
- Only trade 70%+ confidence setups
### "Stops too tight/wide"
- Adjust Swing Lookback length
- Modify ATR multiplier for trailing stop
- Consider the asset's volatility
### "Alerts not working"
- Ensure alert is set to "Once Per Bar Close"
- Check indicator is added to the chart
- Verify TradingView notification settings
---
## 📚 Version History
**v1.0 (Current)**
- Initial release
- Multi-timeframe confluence system
- Dynamic risk management
- Real-time HUD dashboard
- Comprehensive alert system
- ATR trailing stops
- Break-even automation
---
## 🤝 Support & Feedback
If you find this indicator helpful:
- ⭐ Star the script on TradingView
- 💬 Share your results and feedback
- 🐛 Report bugs or suggest improvements
- 📖 Share with other traders
---
## 📖 Additional Resources
### Recommended Reading
- "The New Trading for a Living" by Dr. Alexander Elder
- "Swing Trading Using Multiple Timeframes" - Educational articles
- Risk management and position sizing guides
### Learn More About
- Multiple timeframe analysis
- EMA crossover strategies
- RSI divergence and zones
- ATR-based stops
- R-multiple profit management
---
## 📝 License
This indicator is provided as-is for personal trading use.
**Usage Rights**:
- ✅ Use for personal trading
- ✅ Modify for personal use
- ❌ Resell or redistribute
- ❌ Claim as original work
---
## 🎓 Quick Start Checklist
- Add indicator to TradingView chart
- Set your preferred timeframe (1H/4H/Daily)
- Configure HTF setting (one level higher)
- Review default parameters
- Set up entry alerts (HC LONG/SHORT)
- Set up TP and SL alerts
- Test on historical data
- Paper trade first
- Start with small position sizes
- Track your results
---
**Happy Trading! 📊💰**
*Remember: Discipline, patience, and risk management are the keys to long-term success.*

VV Moving Average Convergence Divergence # VMACDv3 - Volume-Weighted MACD with A/D Divergence Detection
## Overview
**VMACDv3** (Volume-Weighted Moving Average Convergence Divergence Version 3) is a momentum indicator that applies volume-weighting to traditional MACD calculations on price, while using the Accumulation/Distribution (A/D) line for divergence detection. This hybrid approach combines volume-weighted price momentum with volume distribution analysis for comprehensive market insight.
## Key Features
- **Volume-Weighted Price MACD**: Traditional MACD calculation on price but weighted by volume for earlier signals
- **A/D Divergence Detection**: Identifies when A/D trend diverges from MACD momentum
- **Volume Strength Filtering**: Distinguishes high-volume confirmations from low-volume noise
- **Color-Coded Histogram**: 4-color system showing momentum direction and volume strength
- **Real-Time Alerts**: Background colors and alert conditions for bullish/bearish divergences
## Difference from ACCDv3
| Aspect | VMACDv3 | ACCDv3 |
|--------|---------|---------|
| **MACD Input** | **Price (Close)** | **A/D Line** |
| **Volume Weighting** | Applied to price | Applied to A/D line |
| **Primary Signal** | Volume-weighted price momentum | Volume distribution momentum |
| **Use Case** | Price momentum with volume confirmation | Volume flow and accumulation/distribution |
| **Sensitivity** | More responsive to price changes | More responsive to volume patterns |
| **Best For** | Trend following, breakouts | Volume analysis, smart money tracking |
**Key Insight**: VMACDv3 shows *where price is going* with volume weight, while ACCDv3 shows *where volume is accumulating/distributing*.
## Components
### 1. Volume-Weighted MACD on Price
Unlike standard MACD that uses simple price EMAs, VMACDv3 weights each price by its corresponding volume:
```
Fast Line = EMA(Price × Volume, 12) / EMA(Volume, 12)
Slow Line = EMA(Price × Volume, 26) / EMA(Volume, 26)
MACD = Fast Line - Slow Line
```
**Benefits of Volume Weighting**:
- High-volume price movements have greater impact
- Filters out low-volume noise and false moves
- Provides earlier trend change signals
- Better reflects institutional activity
### 2. Accumulation/Distribution (A/D) Line
Used for divergence detection, measuring buying/selling pressure:
```
A/D = Σ ((2 × Close - Low - High) / (High - Low)) × Volume
```
- **Rising A/D**: Accumulation (buying pressure)
- **Falling A/D**: Distribution (selling pressure)
- **Doji Handling**: When High = Low, contribution is zero
### 3. Signal Lines
- **MACD Line** (Blue, #2962FF): The fast-slow difference showing momentum
- **Signal Line** (Orange, #FF6D00): EMA or SMA smoothing of MACD
- **Zero Line**: Reference for bullish (above) vs bearish (below) bias
### 4. Histogram Color System
The histogram uses 4 distinct colors based on **direction** and **volume strength**:
| Condition | Color | Meaning |
|-----------|-------|---------|
| Rising + High Volume | **Dark Green** (#1B5E20) | Strong bullish momentum with volume confirmation |
| Rising + Low Volume | **Light Teal** (#26A69A) | Bullish momentum but weak volume (less reliable) |
| Falling + High Volume | **Dark Red** (#B71C1C) | Strong bearish momentum with volume confirmation |
| Falling + Low Volume | **Light Pink** (#FFCDD2) | Bearish momentum but weak volume (less reliable) |
Additional shading:
- **Light Cyan** (#B2DFDB): Positive but not rising (momentum stalling)
- **Bright Red** (#FF5252): Negative and accelerating down
### 5. Divergence Detection
VMACDv3 compares A/D trend against volume-weighted price MACD:
#### Bullish Divergence (Green Background)
- **Condition**: A/D is trending up BUT MACD is negative and trending down
- **Interpretation**: Volume is accumulating while price momentum appears weak
- **Signal**: Smart money accumulation, potential bullish reversal
- **Action**: Look for long entries, especially at support levels
#### Bearish Divergence (Red Background)
- **Condition**: A/D is trending down BUT MACD is positive and trending up
- **Interpretation**: Volume is distributing while price momentum appears strong
- **Signal**: Smart money distribution, potential bearish reversal
- **Action**: Consider exits, avoid new longs, watch for breakdown
## Parameters
| Parameter | Default | Range | Description |
|-----------|---------|-------|-------------|
| **Source** | Close | OHLC/HLC3/etc | Price source for MACD calculation |
| **Fast Length** | 12 | 1-50 | Period for fast EMA (shorter = more sensitive) |
| **Slow Length** | 26 | 1-100 | Period for slow EMA (longer = smoother) |
| **Signal Smoothing** | 9 | 1-50 | Period for signal line (MACD smoothing) |
| **Signal Line MA Type** | EMA | SMA/EMA | Moving average type for signal calculation |
| **Volume MA Length** | 20 | 5-100 | Period for volume average (strength filter) |
## Usage Guide
### Reading the Indicator
1. **MACD Lines (Blue & Orange)**
- **Blue Line (MACD)**: Volume-weighted price momentum
- **Orange Line (Signal)**: Smoothed trend of MACD
- **Crossovers**: Blue crosses above orange = bullish, below = bearish
- **Distance**: Wider gap = stronger momentum
- **Zero Line Position**: Above = bullish bias, below = bearish bias
2. **Histogram Colors**
- **Dark Green (#1B5E20)**: Strong bullish move with high volume - **most reliable buy signal**
- **Light Teal (#26A69A)**: Bullish but low volume - wait for confirmation
- **Dark Red (#B71C1C)**: Strong bearish move with high volume - **most reliable sell signal**
- **Light Pink (#FFCDD2)**: Bearish but low volume - may be temporary dip
3. **Background Divergence Alerts**
- **Green Background**: A/D accumulating while price weak - potential bottom
- **Red Background**: A/D distributing while price strong - potential top
- Most powerful at key support/resistance levels
### Trading Strategies
#### Strategy 1: Volume-Confirmed Trend Following
1. Wait for MACD to cross above zero line
2. Look for **dark green** histogram bars (high volume confirmation)
3. Enter long on second consecutive dark green bar
4. Hold while histogram remains green
5. Exit when histogram turns light green or red appears
6. Set stop below recent swing low
**Example**:
```
Price: 26,400 → 26,450 (rising)
MACD: -50 → +20 (crosses zero)
Histogram: Light teal → Dark green → Dark green
Volume: 50k → 75k → 90k (increasing)
```
#### Strategy 2: Divergence Reversal Trading
1. Identify divergence background (green = bullish, red = bearish)
2. Confirm with price structure (support/resistance, chart patterns)
3. Wait for MACD to cross signal line in divergence direction
4. Enter on first **dark colored** histogram bar after divergence
5. Set stop beyond divergence area
6. Target previous swing high/low
**Example - Bullish Divergence**:
```
Price: Making lower lows (26,350 → 26,300 → 26,250)
A/D: Rising (accumulation)
MACD: Below zero but starting to curve up
Background: Green shading appears
Entry: MACD crosses signal line + dark green bar
Stop: Below 26,230
Target: 26,450 (previous high)
```
#### Strategy 3: Momentum Scalping
1. Trade only in direction of MACD zero line (above = long, below = short)
2. Enter on dark colored bars only
3. Exit on first light colored bar or opposite color
4. Quick in and out (1-5 minute holds)
5. Tight stops (0.2-0.5% depending on instrument)
#### Strategy 4: Histogram Pattern Trading
**V-Bottom Reversal (Bullish)**:
- Red histogram bars start rising (becoming less negative)
- Forms "V" shape at the bottom
- Transitions to light red → light teal → **dark green**
- Entry: First dark green bar
- Signal: Momentum reversal with volume
**Λ-Top Reversal (Bearish)**:
- Green histogram bars start falling (becoming less positive)
- Forms inverted "V" at the top
- Transitions to light green → light pink → **dark red**
- Entry: First dark red bar
- Signal: Momentum exhaustion with volume
### Multi-Timeframe Analysis
**Recommended Approach**:
1. **Higher Timeframe (15m/1h)**: Identify overall trend direction
2. **Trading Timeframe (5m)**: Time entries using VMACDv3 signals
3. **Lower Timeframe (1m)**: Fine-tune entry prices
**Example Setup**:
```
15-minute: MACD above zero (bullish bias)
5-minute: Dark green histogram appears after pullback
1-minute: Enter on break of recent high with volume
```
### Volume Strength Interpretation
The volume filter compares current volume to 20-period average:
- **Volume > Average**: Dark colors (green/red) - high confidence signals
- **Volume < Average**: Light colors (teal/pink) - lower confidence signals
**Trading Rules**:
- ✓ **Aggressive**: Take all dark colored signals
- ✓ **Conservative**: Only take dark colors that follow 2+ light colors of same type
- ✗ **Avoid**: Trading light colored signals during high volatility
- ✗ **Avoid**: Ignoring volume context during news events
## Technical Details
### Volume-Weighted Calculation
```pine
// Volume-weighted fast EMA
fast_ma = ta.ema(src * volume, fast_length) / ta.ema(volume, fast_length)
// Volume-weighted slow EMA
slow_ma = ta.ema(src * volume, slow_length) / ta.ema(volume, slow_length)
// MACD is the difference
macd = fast_ma - slow_ma
// Signal line smoothing
signal = ta.ema(macd, signal_length) // or ta.sma() if SMA selected
// Histogram
hist = macd - signal
```
### Divergence Detection Logic
```pine
// A/D trending up if above its 5-period SMA
ad_trend = ad > ta.sma(ad, 5)
// MACD trending up if above zero
macd_trend = macd > 0
// Divergence when trends oppose each other
divergence = ad_trend != macd_trend
// Specific conditions for alerts
bullish_divergence = ad_trend and not macd_trend and macd < 0
bearish_divergence = not ad_trend and macd_trend and macd > 0
```
### Histogram Coloring Logic
```pine
hist_color = (hist >= 0
? (hist < hist
? (vol_strength ? #1B5E20 : #26A69A) // Rising: dark/light green
: #B2DFDB) // Positive but falling: cyan
: (hist < hist
? (vol_strength ? #B71C1C : #FFCDD2) // Rising (less negative): dark/light red
: #FF5252)) // Falling more: bright red
```
## Alerts
Built-in alert conditions for divergence detection:
### Bullish Divergence Alert
- **Trigger**: A/D trending up, MACD negative and trending down
- **Message**: "Bullish Divergence: A/D trending up but MACD trending down"
- **Use Case**: Potential reversal or continuation after pullback
- **Action**: Look for long entry setups
### Bearish Divergence Alert
- **Trigger**: A/D trending down, MACD positive and trending up
- **Message**: "Bearish Divergence: A/D trending down but MACD trending up"
- **Use Case**: Potential top or trend reversal
- **Action**: Consider exits or short entries
### Setting Up Alerts
1. Click "Create Alert" in TradingView
2. Condition: Select "VMACDv3"
3. Choose alert type: "Bullish Divergence" or "Bearish Divergence"
4. Configure: Email, SMS, webhook, or popup
5. Set frequency: "Once Per Bar Close" recommended
## Comparison Tables
### VMACDv3 vs Standard MACD
| Feature | Standard MACD | VMACDv3 |
|---------|---------------|---------|
| **Price Weighting** | Equal weight all bars | Volume-weighted |
| **Sensitivity** | Fixed | Adaptive to volume |
| **False Signals** | More during low volume | Fewer (volume filter) |
| **Divergence** | Price vs MACD | A/D vs MACD |
| **Volume Analysis** | None | Built-in |
| **Color System** | 2 colors | 4+ colors |
| **Best For** | Simple trend following | Volume-confirmed trading |
### VMACDv3 vs ACCDv3
| Aspect | VMACDv3 | ACCDv3 |
|--------|---------|--------|
| **Focus** | Price momentum | Volume distribution |
| **Reactivity** | Faster to price moves | Faster to volume shifts |
| **Best Markets** | Trending, breakouts | Accumulation/distribution phases |
| **Signal Type** | Where price + volume going | Where smart money positioning |
| **Divergence Meaning** | Volume vs price disagreement | A/D vs momentum disagreement |
| **Use Together?** | ✓ Yes, complementary | ✓ Yes, different perspectives |
## Example Trading Scenarios
### Scenario 1: Strong Bullish Breakout
```
Time: 9:30 AM (market open)
Price: Breaks above 26,400 resistance
MACD: Crosses above zero line
Histogram: Dark green bars (#1B5E20)
Volume: 2x average (150k vs 75k avg)
A/D: Rising (no divergence)
Action: Enter long at 26,405
Stop: 26,380 (below breakout)
Target 1: 26,450 (risk:reward 1:2)
Target 2: 26,500 (risk:reward 1:4)
Result: High probability setup with volume confirmation
```
### Scenario 2: False Breakout (Avoided)
```
Time: 2:30 PM (slow period)
Price: Breaks above 26,400 resistance
MACD: Slightly positive
Histogram: Light teal bars (#26A69A)
Volume: 0.5x average (40k vs 75k avg)
A/D: Flat/declining
Action: Avoid trade
Reason: Low volume, no conviction, potential false breakout
Outcome: Price reverses back below 26,400 within 10 minutes
Saved: Avoided losing trade due to volume filter
```
### Scenario 3: Bullish Divergence Bottom
```
Time: 11:00 AM
Price: Making lower lows (26,350 → 26,300 → 26,280)
MACD: Below zero but curving upward
Histogram: Red bars getting shorter (V-bottom forming)
Background: Green shading (divergence alert)
A/D: Rising despite price falling
Volume: Increasing on down bars
Setup:
1. Divergence appears at 26,280 (green background)
2. Wait for MACD to cross signal line
3. First dark green bar appears at 26,290
4. Enter long: 26,295 (next bar open)
5. Stop: 26,265 (below divergence low)
6. Target: 26,350 (previous swing high)
Result: +55 points (30 point risk, 1.8:1 reward)
Key: Divergence + volume confirmation = high probability reversal
```
### Scenario 4: Bearish Divergence Top
```
Time: 1:45 PM
Price: Making higher highs (26,500 → 26,520 → 26,540)
MACD: Positive but flattening
Histogram: Green bars getting shorter (Λ-top forming)
Background: Red shading (bearish divergence)
A/D: Declining despite rising price
Volume: Decreasing on up bars
Setup:
1. Bearish divergence at 26,540 (red background)
2. MACD crosses below signal line
3. First dark red bar appears at 26,535
4. Enter short: 26,530
5. Stop: 26,555 (above divergence high)
6. Target: 26,475 (support level)
Result: +55 points (25 point risk, 2.2:1 reward)
Key: Distribution while price rising = smart money exiting
```
### Scenario 5: V-Bottom Reversal
```
Downtrend in progress
MACD: Deep below zero (-150)
Histogram: Series of dark red bars
Pattern Development:
Bar 1: Dark red, hist = -80, falling
Bar 2: Dark red, hist = -95, falling
Bar 3: Dark red, hist = -100, falling (extreme)
Bar 4: Light pink, hist = -98, rising!
Bar 5: Light pink, hist = -90, rising
Bar 6: Light teal, hist = -75, rising (crosses to positive momentum)
Bar 7: Dark green, hist = -55, rising + volume
Action: Enter long on Bar 7
Reason: V-bottom confirmed with volume
Stop: Below Bar 3 low
Target: Zero line on histogram (mean reversion)
```
## Best Practices
### Entry Rules
✓ **Wait for dark colors**: High-volume confirmation is key
✓ **Confirm divergences**: Use with price support/resistance
✓ **Trade with zero line**: Long above, short below for best odds
✓ **Multiple timeframes**: Align 1m, 5m, 15m signals
✓ **Watch for patterns**: V-bottoms and Λ-tops are reliable
### Exit Rules
✓ **Partial profits**: Take 50% at first target
✓ **Trail stops**: Use histogram color changes
✓ **Respect signals**: Exit on opposite dark color
✓ **Time stops**: Close positions before major news
✓ **End of day**: Square up before close
### Avoid
✗ **Don't chase light colors**: Low volume = low confidence
✗ **Don't ignore divergence**: Early warning system
✗ **Don't overtrade**: Wait for clear setups
✗ **Don't fight the trend**: Zero line dictates bias
✗ **Don't skip stops**: Always use risk management
## Risk Management
### Position Sizing
- **Dark green/red signals**: 1-2% account risk
- **Light signals**: 0.5% account risk or skip
- **Divergence plays**: 1% account risk (higher uncertainty)
- **Multiple confirmations**: Up to 2% account risk
### Stop Loss Placement
- **Trend trades**: Below/above recent swing (20-30 points typical)
- **Breakout trades**: Below/above breakout level (15-25 points)
- **Divergence trades**: Beyond divergence extreme (25-40 points)
- **Scalp trades**: Tight stops at 10-15 points
### Profit Targets
- **Minimum**: 1.5:1 reward to risk ratio
- **Scalps**: 15-25 points (quick in/out)
- **Swing**: 50-100 points (hold through pullbacks)
- **Runners**: Trail with histogram color changes
## Timeframe Recommendations
| Timeframe | Trading Style | Typical Hold | Advantages | Challenges |
|-----------|---------------|--------------|------------|------------|
| **1-minute** | Scalping | 1-5 minutes | Fast profits, many setups | Noisy, high false signals |
| **5-minute** | Intraday | 15-60 minutes | Balance of speed/clarity | Still requires quick decisions |
| **15-minute** | Swing | 1-4 hours | Clearer trends, less noise | Fewer opportunities |
| **1-hour** | Position | 4-24 hours | Strong signals, less monitoring | Wider stops required |
**Recommendation**: Start with 5-minute for best balance of signal quality and opportunity frequency.
## Combining with Other Indicators
### VMACDv3 + ACCDv3
- **Use**: Confirm volume flow with price momentum
- **Signal**: Both showing dark green = highest conviction long
- **Divergence**: VMACDv3 bullish + ACCDv3 bearish = examine price action
### VMACDv3 + RSI
- **Use**: Overbought/oversold with momentum confirmation
- **Signal**: RSI < 30 + dark green VMACD = strong reversal
- **Caution**: RSI > 70 + light green VMACD = potential false breakout
### VMACDv3 + Elder Impulse
- **Use**: Bar coloring + histogram confirmation
- **Signal**: Green Elder bars + dark green VMACD = aligned momentum
- **Exit**: Blue Elder bars + light colors = momentum stalling
## Limitations
- **Requires volume data**: Will not work on instruments without volume feed
- **Lagging indicator**: MACD inherently follows price (2-3 bar delay)
- **Consolidation noise**: Generates false signals in tight ranges
- **Gap handling**: Large gaps can distort volume-weighted values
- **Not standalone**: Should combine with price action and support/resistance
## Troubleshooting
**Problem**: Too many light colored signals
**Solution**: Increase Volume MA Length to 30-40 for stricter filtering
**Problem**: Missing entries due to waiting for dark colors
**Solution**: Lower Volume MA Length to 10-15 for more signals (accept lower quality)
**Problem**: Divergences not appearing
**Solution**: Verify volume data available; check if A/D line is calculating
**Problem**: Histogram colors not changing
**Solution**: Ensure real-time data feed; refresh indicator
## Version History
- **v3**: Removed traditional MACD, using volume-weighted MACD on price with A/D divergence
- **v2**: Added A/D divergence detection, volume strength filtering, enhanced histogram colors
- **v1**: Basic volume-weighted MACD on price
## Related Indicators
**Companion Tools**:
- **ACCDv3**: Volume-weighted MACD on A/D line (distribution focus)
- **RSIv2**: RSI with A/D divergence detection
- **DMI**: Directional Movement Index with A/D divergence
- **Elder Impulse**: Bar coloring system using volume-weighted MACD
**Use Together**: VMACDv3 (momentum) + ACCDv3 (distribution) + Elder Impulse (bar colors) = complete volume-based trading system
---
*This indicator is for educational purposes. Past performance does not guarantee future results. Always practice proper risk management and never risk more than you can afford to lose.*

Dark Vector ScalpingThe Dark Vector Scalping indicator is a high-frequency trend-following system designed specifically to capture rapid momentum shifts in the market. It combines a staircase-style breakout logic with volatility-adjusted trailing stops to define market direction.
While the underlying math is robust enough for various asset classes, this specific configuration is optimized for scalping operations on 1-minute and 5-minute timeframes. It aims to filter out the "noise" common in lower timeframes while reacting quickly to genuine breakouts.
Core Components
1. The Apex Engine (Staircase Logic) Unlike traditional moving averages that curve with price, this engine uses a "hard" breakout logic. It looks back at a specific number of bars (Sensitivity) to find the highest highs and lowest lows.
Bullish Flip: Occurs when the price closes below the calculated low of the previous trend.
Bearish Flip: Occurs when the price closes above the calculated high of the previous trend.
Trailing Stop: Once a trend is established, a trailing stop line is drawn. This line only moves in the direction of the trend (up for bullish, down for bearish) and never retraces, acting as a ratchet to lock in paper profits.
2. Volatility Normalization To prevent getting stopped out by random market noise (scam wicks), the indicator calculates the Average True Range (ATR). It multiplies this volatility metric by a user-defined deviation factor to determine exactly how far the stop line should be from the current price action.
3. The Hull Moving Average (HMA) Filter The script includes an optional 50-period Hull Moving Average. The HMA is known for being extremely fast and smooth, reducing lag compared to standard moving averages.
Visual Reference: You can plot the line to see the overall macro trend.
Hard Filter: You can enable a "Safety Filter" in the settings. If enabled, the system will only generate Buy signals if the price is above the HMA, and Sell signals if the price is below the HMA.
4. The Dashboard A data panel is located on the chart (customizable position) to provide instant numerical data without needing to calculate levels manually. It displays the current trend state, the exact price of the trailing stop, and the status of the HMA filter.
Settings & Configuration
Sensitivity (Lookback)
Default: 5
This is the primary setting for the Apex Engine. A setting of 5 is the "sweet spot" for 1-minute and 5-minute charts. It allows the system to react very quickly to sudden volume spikes. Increasing this number (e.g., to 10) will make the signals slower and more conservative.
Stop Deviation
Default: 3.0
This controls the "breathing room" for the trade. A value of 3.0 allows for standard volatility on minute charts without triggering a premature exit. Lowering this to 2.0 will result in tighter stops but more false signals.
HMA Filter
Use HMA as Filter? (Default: OFF):
When OFF, the system signals purely on price action breakouts (fastest).
When ON, the system waits for the price to align with the 50-period HMA before signaling (safest, but may delay entry).
How to Interpret Visuals
Candle Colors
Teal/Green: The market is in a Bullish regime.
Red/Pink: The market is in a Bearish regime.
The Line
The solid stepped line represents the hard invalidation point. If price closes beyond this line, the trend is considered over.
Diamond Signals
Light Green Diamond (Below Bar): Confirmed Buy Signal. A new bullish trend has started.
Light Red/Pink Diamond (Above Bar): Confirmed Sell Signal. A new bearish trend has started.
Trading Strategy Guide
The Scalp Entry
Ensure you are on a 1-minute or 5-minute timeframe.
Wait for a signal Diamond to close. Do not enter while the bar is still forming, as the signal may repaint (disappear) if the price retraces before the close.
Long Entry: Enter when a Green Diamond appears and the candle turns Teal.
Short Entry: Enter when a Red Diamond appears and the candle turns Red.
Risk Management
Stop Loss: Your invalidation level is the "Apex Stop" line. You can place your hard stop loss slightly beyond this line.
Take Profit: Because this is a trend-following system, it is often best to hold until the candle color changes, or to take profit at fixed Risk:Reward ratios (e.g., 1:1.5 or 1:2).
The HMA Nuance If you find the market is "choppy" (moving sideways), enable the "Use HMA as Filter" option in the settings. This will force the system to ignore signals that are counter-trend to the longer-term momentum.
Disclaimer
The information provided by the "Dark Vector Scalping" indicator and this accompanying guide is for educational and informational purposes only. It does not constitute financial, investment, or trading advice. Trading cryptocurrencies, stocks, and forex involves a high level of risk and may not be suitable for all investors. You could lose some or all of your initial investment.

Enhanced MA Crossover Pro📝 Strategy Summary: Enhanced MA Crossover Pro
This strategy is an advanced, highly configurable moving average (MA) crossover system designed for algorithmic trading. It uses the crossover of two customizable MAs (a "Fast" MA 1 and a "Slow" MA 2) as its core entry signal, but aggressively integrates multiple technical filters, time controls, and dynamic position management to create a robust and comprehensive trading system.
💡 Core Logic
Entry Signal: A bullish crossover (MA1 > MA2) generates a Long signal, and a bearish crossover (MA1 < MA2) generates a Short signal. Users can opt to use MA crossovers from a Higher Timeframe (HTF) for the entry signal.
Confirmation/Filters: The basic MA cross signal is filtered by several optional indicators (see Filters section below) to ensure trades align with a broader trend or momentum context.
Position Management: Trades are managed with a sophisticated system of Stop Loss, Take Profit, Trailing Stops, and Breakeven stops that can be fixed, ATR-based, or dynamically adjusted.
Risk Management: Daily limits are enforced for maximum profit/loss and maximum trades per day.
⚙️ Key Features and Customization
1. Moving Averages
Primary MAs (MA1 & MA2): Highly configurable lengths (default 8 & 20) and types: EMA, WMA, SMA, or SMMA/RMA.
Higher Timeframe (HTF) MAs: Optional MAs calculated on a user-defined resolution (e.g., "60" for 1-hour) for use as an entry signal or as a trend confirmation filter.
2. Multi-Filter System
The entry signal can be filtered by the following optional conditions:
SMA Filter: Price must be above a 200-period SMA for long trades, and below it for short trades.
VWAP Filter: Price must be above VWAP for long trades, and below it for short trades.
RSI Filter: Long trades are blocked if RSI is overbought (default 70); short trades are blocked if RSI is oversold (default 30).
MACD Filter: Requires the MACD Line to be above the Signal Line for long trades (and vice versa for short trades).
HTF Confirmation: Requires the HTF MA1 to be above HTF MA2 for long entries (and vice versa).
3. Dynamic Stop and Target Management (S/L & T/P)
The strategy provides extensive control over exits:
Stop Loss Methods:
Fixed: Fixed tick amount.
ATR: Based on a multiple of the Average True Range (ATR).
Capped ATR: ATR stop limited by a maximum fixed tick amount.
Exit on Close Cross MA: Position is closed if the price crosses back over the chosen MA (MA1 or MA2).
Breakeven Stop: A stop can be moved to the entry price once a trigger distance (fixed ticks or Adaptive Breakeven based on ATR%) is reached.
Trailing Stop: Can be fixed or ATR-based, with an optional feature to auto-tighten the trailing multiplier after the breakeven condition is met.
Profit Target: Can be a fixed tick amount or a dynamic target based on an ATR multiplier.
4. Time and Session Control
Trading Session: Trades are only taken between defined Start/End Hours and Minutes (e.g., 9:30 to 16:00).
Forced Close: All open positions are closed near the end of the session (e.g., 15:45).
Trading Days: Allows specific days of the week to be enabled or disabled for trading.
5. Risk and Position Limits
Daily Profit/Loss Limits: The strategy tracks daily realized and unrealized PnL in ticks and will close all positions and block new entries if the user-defined maximum profit or maximum loss is hit.
Max Trades Per Day: Limits the number of executed trades in a single day.
🎨 Outputs and Alerts
Plots: Plots the MA1, MA2, SMA, VWAP, and HTF MAs (if enabled) on the chart.
Shapes: Plots visual markers (BUY/SELL labels) on the bar where the MA crossover occurs.
Trailing Stop: Plots the dynamic trailing stop level when a position is open.
Alerts: Generates JSON-formatted alerts for entry ({"action":"buy", "price":...}) and exit ({"action":"exit", "position":"long", "price":...}).

FlowStateTrader FlowState Trader - Advanced Time-Filtered Strategy
## Overview
FlowState Trader is a sophisticated algorithmic trading strategy that combines precision entry signals with intelligent time-based filtering and adaptive risk management. Built for traders seeking to achieve their optimal performance state, FlowState identifies high-probability trading opportunities within user-defined time windows while employing dynamic trailing stops and partial position management.
## Core Strategy Philosophy
FlowState Trader operates on the principle that peak trading performance occurs when three elements align: **Focus** (precise entry signals), **Flow** (optimal time windows), and **State** (intelligent position management). This strategy excels at finding reversal opportunities at key support and resistance levels while filtering out suboptimal trading periods to keep traders in their optimal flow state.
## Key Features
### 🎯 Focus Entry System
**Support/Resistance Zone Trading**:
- Dynamic identification of key price levels using configurable lookback periods
- Entry signals triggered when price interacts with these critical zones
- Volume confirmation ensures genuine breakout/reversal momentum
- Trend filter alignment prevents counter-trend disasters
**Entry Conditions**:
- **Long Signals**: Price closes above support buffer, touches support level, with above-average volume
- **Short Signals**: Price closes below resistance buffer, touches resistance level, with above-average volume
- Optional trend filter using EMA or SMA for directional bias confirmation
### ⏰ FlowState Time Filtering System
**Comprehensive Time Controls**:
- **12-Hour Format Trading Windows**: User-friendly AM/PM time selection
- **Multi-Timezone Support**: UTC, EST, PST, CST with automatic conversion
- **Day-of-Week Filtering**: Trade only weekdays, weekends, or both
- **Lunch Hour Avoidance**: Automatically skips low-volume lunch periods (12-1 PM)
- **Visual Time Indicators**: Background coloring shows active/inactive trading periods
**Smart Time Features**:
- Handles overnight trading sessions seamlessly
- Prevents trades during historically poor performance periods
- Customizable trading hours for different market sessions
- Real-time trading window status in dashboard
### 🛡️ Adaptive Risk Management
**Multi-Level Take Profit System**:
- **TP1**: First profit target with optional partial position closure
- **TP2**: Final profit target for remaining position
- **Flexible Scaling**: Choose number of contracts to close at each level
**Dynamic Trailing Stop Technology**:
- **Three Operating Modes**:
- **Conservative**: Earlier activation, tighter trailing (protect profits)
- **Balanced**: Optimal risk/reward balance (recommended)
- **Aggressive**: Later activation, wider trailing (let winners run)
- **ATR-Based Calculations**: Adapts to current market volatility
- **Automatic Activation**: Engages when position reaches profitability threshold
### 📊 Intelligent Position Sizing
**Contract-Based Management**:
- Configurable entry quantity (1-1000 contracts)
- Partial close quantities for profit-taking
- Clear position tracking and P&L monitoring
- Real-time position status updates
### 🎨 Professional Visualization
**Enhanced Chart Elements**:
- **Entry Zone Highlighting**: Clear visual identification of trading opportunities
- **Dynamic Risk/Reward Lines**: Real-time TP and SL levels with price labels
- **Trailing Stop Visualization**: Live tracking of adaptive stop levels
- **Support/Resistance Lines**: Key level identification
- **Time Window Background**: Visual confirmation of active trading periods
**Dual Dashboard System**:
- **Strategy Dashboard**: Real-time position info, settings status, and current levels
- **Performance Scorecard**: Live P&L tracking, win rates, and trade statistics
- **Customizable Sizing**: Small, Medium, or Large display options
### ⚙️ Comprehensive Customization
**Core Strategy Settings**:
- **Lookback Period**: Support/resistance calculation period (5-100 bars)
- **ATR Configuration**: Period and multipliers for stops/targets
- **Reward-to-Risk Ratios**: Customizable profit target calculations
- **Trend Filter Options**: EMA/SMA selection with adjustable periods
**Time Filter Controls**:
- **Trading Hours**: Start/end times in 12-hour format
- **Timezone Selection**: Four major timezone options
- **Day Restrictions**: Weekend-only, weekday-only, or unrestricted
- **Session Management**: Lunch hour avoidance and custom periods
**Risk Management Options**:
- **Trailing Stop Modes**: Conservative/Balanced/Aggressive presets
- **Partial Close Settings**: Enable/disable with custom quantities
- **Alert System**: Comprehensive notifications for all trade events
### 📈 Performance Tracking
**Real-Time Metrics**:
- Net profit/loss calculation
- Win rate percentage
- Profit factor analysis
- Maximum drawdown tracking
- Total trade count and breakdown
- Current position P&L
**Trade Analytics**:
- Winner/loser ratio tracking
- Real-time performance scorecard
- Strategy effectiveness monitoring
- Risk-adjusted return metrics
### 🔔 Alert System
**Comprehensive Notifications**:
- Entry signal alerts with price and quantity
- Take profit level hits (TP1 and TP2)
- Stop loss activations
- Trailing stop engagements
- Position closure notifications
## Strategy Logic Deep Dive
### Entry Signal Generation
The strategy identifies high-probability reversal points by combining multiple confirmation factors:
1. **Price Action**: Looks for price interaction with key support/resistance levels
2. **Volume Confirmation**: Ensures sufficient market interest and liquidity
3. **Trend Alignment**: Optional filter prevents counter-trend positions
4. **Time Validation**: Only trades during user-defined optimal periods
5. **Zone Analysis**: Entry occurs within calculated buffer zones around key levels
### Risk Management Philosophy
FlowState Trader employs a three-tier risk management approach:
1. **Initial Protection**: ATR-based stop losses set at strategy entry
2. **Profit Preservation**: Trailing stops activate once position becomes profitable
3. **Scaled Exit**: Partial profit-taking allows for both security and potential
### Time-Based Edge
The time filtering system recognizes that not all trading hours are equal:
- Avoids low-volume, high-spread periods
- Focuses on optimal liquidity windows
- Prevents trading during news events (lunch hours)
- Allows customization for different market sessions
## Best Practices and Optimization
### Recommended Settings
**For Scalping (1-5 minute charts)**:
- Lookback Period: 10-20
- ATR Period: 14
- Trailing Stop: Conservative mode
- Time Filter: Major session hours only
**For Day Trading (15-60 minute charts)**:
- Lookback Period: 20-30
- ATR Period: 14-21
- Trailing Stop: Balanced mode
- Time Filter: Extended trading hours
**For Swing Trading (4H+ charts)**:
- Lookback Period: 30-50
- ATR Period: 21+
- Trailing Stop: Aggressive mode
- Time Filter: Disabled or very broad
### Market Compatibility
- **Forex**: Excellent for major pairs during active sessions
- **Stocks**: Ideal for liquid stocks during market hours
- **Futures**: Perfect for index and commodity futures
- **Crypto**: Effective on major cryptocurrencies (24/7 capability)
### Risk Considerations
- **Market Conditions**: Performance varies with volatility regimes
- **Timeframe Selection**: Lower timeframes require tighter risk management
- **Position Sizing**: Never risk more than 1-2% of account per trade
- **Backtesting**: Always test on historical data before live implementation
## Educational Value
FlowState serves as an excellent learning tool for:
- Understanding support/resistance trading
- Learning proper time-based filtering
- Mastering trailing stop techniques
- Developing systematic trading approaches
- Risk management best practices
## Disclaimer
This strategy is for educational and informational purposes only. Past performance does not guarantee future results. Trading involves substantial risk of loss and is not suitable for all investors. Users should thoroughly backtest the strategy and understand all risks before live trading. Always use proper position sizing and never risk more than you can afford to lose.
---
*FlowState Trader represents the evolution of systematic trading - combining classical technical analysis with modern risk management and intelligent time filtering to help traders achieve their optimal performance state through systematic, disciplined execution.*

HMA Crossover + ATR + Curvature (Long & Short)📏 Hull Moving Averages (Trend Filters)
- fastHMA = ta.hma(close, fastLength)
- slowHMA = ta.hma(close, slowLength)
These two HMAs act as dynamic trend indicators:
- A bullish crossover of fast over slow HMA signals a potential long setup.
- A bearish crossunder triggers short interest.
⚡️ Curvature (Acceleration Filter)
- curv = ta.change(ta.change(fastHMA))
This calculates the second-order change (akin to the second derivative) of the fast HMA — effectively the acceleration of the trend. It serves as a filter:
- For long entries: curv > curvThresh (positive acceleration)
- For short entries: curv < -curvThresh (negative acceleration)
It helps eliminate weak or stagnating moves by requiring momentum behind the crossover.
📈 Volatility-Based Risk Management (ATR)
- atr = ta.atr(atrLength)
- stopLoss = atr * atrMult
- trailStop = atr * trailMult
These define your:
- Initial stop loss: scaled to recent volatility using ATR and atrMult.
- Trailing stop: also ATR-scaled, to lock in gains dynamically as price moves favorably.
💰 Position Sizing via Risk Percent
- capital = strategy.equity
- riskCapital = capital * (riskPercent / 100)
- qty = riskCapital / stopLoss
This dynamically calculates the position size (qty) such that if the stop loss is hit, the loss does not exceed the predefined percentage of account equity. It’s a volatility-adjusted position sizing method, keeping your risk consistent regardless of market conditions.
📌 Execution Logic
- Long Entry: on bullish HMA crossover with rising curvature.
- Short Entry: on bearish crossover with falling curvature.
- Exits: use ATR-based trailing stops.
- Position is closed when trend conditions reverse (e.g., bearish crossover exits the long).
This framework gives you:
- Trend-following logic (via HMAs)
- Momentum confirmation (via curvature)
- Volatility-aware execution and exits (via ATR)
- Risk-controlled dynamic sizing
Want to get surgical and test what happens if we use curvature on the difference between HMAs instead? That might give some cool insights into trend strength transitions.

Long/Short/Exit/Risk management Strategy # LongShortExit Strategy Documentation
## Overview
The LongShortExit strategy is a versatile trading system for TradingView that provides complete control over entry, exit, and risk management parameters. It features a sophisticated framework for managing long and short positions with customizable profit targets, stop-loss mechanisms, partial profit-taking, and trailing stops. The strategy can be enhanced with continuous position signals for visual feedback on the current trading state.
## Key Features
### General Settings
- **Trading Direction**: Choose to trade long positions only, short positions only, or both.
- **Max Trades Per Day**: Limit the number of trades per day to prevent overtrading.
- **Bars Between Trades**: Enforce a minimum number of bars between consecutive trades.
### Session Management
- **Session Control**: Restrict trading to specific times of the day.
- **Time Zone**: Specify the time zone for session calculations.
- **Expiration**: Optionally set a date when the strategy should stop executing.
### Contract Settings
- **Contract Type**: Select from common futures contracts (MNQ, MES, NQ, ES) or custom values.
- **Point Value**: Define the dollar value per point movement.
- **Tick Size**: Set the minimum price movement for accurate calculations.
### Visual Signals
- **Continuous Position Signals**: Implement 0 to 1 visual signals to track position states.
- **Signal Plotting**: Customize color and appearance of position signals.
- **Clear Visual Feedback**: Instantly see when entry conditions are triggered.
### Risk Management
#### Stop Loss and Take Profit
- **Risk Type**: Choose between percentage-based, ATR-based, or points-based risk management.
- **Percentage Mode**: Set SL/TP as a percentage of entry price.
- **ATR Mode**: Set SL/TP as a multiple of the Average True Range.
- **Points Mode**: Set SL/TP as a fixed number of points from entry.
#### Advanced Exit Features
- **Break-Even**: Automatically move stop-loss to break-even after reaching specified profit threshold.
- **Trailing Stop**: Implement a trailing stop-loss that follows price movement at a defined distance.
- **Partial Profit Taking**: Take partial profits at predetermined price levels:
- Set first partial exit point and percentage of position to close
- Set second partial exit point and percentage of position to close
- **Time-Based Exit**: Automatically exit a position after a specified number of bars.
#### Win/Loss Streak Management
- **Streak Cutoff**: Automatically pause trading after a series of consecutive wins or losses.
- **Daily Reset**: Option to reset streak counters at the start of each day.
### Entry Conditions
- **Source and Value**: Define the exact price source and value that triggers entries.
- **Equals Condition**: Entry signals occur when the source exactly matches the specified value.
### Performance Analytics
- **Real-Time Stats**: Track important performance metrics like win rate, P&L, and largest wins/losses.
- **Visual Feedback**: On-chart markers for entries, exits, and important events.
### External Integration
- **Webhook Support**: Compatible with TradingView's webhook alerts for automated trading.
- **Cross-Platform**: Connect to external trading systems and notification platforms.
- **Custom Order Execution**: Implement advanced order flows through external services.
## How to Use
### Setup Instructions
1. Add the script to your TradingView chart.
2. Configure the general settings based on your trading preferences.
3. Set session trading hours if you only want to trade specific times.
4. Select your contract specifications or customize for your instrument.
5. Configure risk parameters:
- Choose your preferred risk management approach
- Set appropriate stop-loss and take-profit levels
- Enable advanced features like break-even, trailing stops, or partial profit taking as needed
6. Define entry conditions:
- Select the price source (such as close, open, high, or an indicator)
- Set the specific value that should trigger entries
### Entry Condition Examples
- **Example 1**: To enter when price closes exactly at a whole number:
- Long Source: close
- Long Value: 4200 (for instance, to enter when price closes exactly at 4200)
- **Example 2**: To enter when an indicator reaches a specific value:
- Long Source: ta.rsi(close, 14)
- Long Value: 30 (triggers when RSI equals exactly 30)
### Best Practices
1. **Always backtest thoroughly** before using in live trading.
2. **Start with conservative risk settings**:
- Small position sizes
- Reasonable stop-loss distances
- Limited trades per day
3. **Monitor and adjust**:
- Use the performance table to track results
- Adjust parameters based on how the strategy performs
4. **Consider market volatility**:
- Use ATR-based stops during volatile periods
- Use fixed points during stable markets
## Continuous Position Signals Implementation
The LongShortExit strategy can be enhanced with continuous position signals to provide visual feedback about the current position state. These signals can help you track when the strategy is in a long or short position.
### Adding Continuous Position Signals
Add the following code to implement continuous position signals (0 to 1):
```pine
// Continuous position signals (0 to 1)
var float longSignal = 0.0
var float shortSignal = 0.0
// Update position signals based on your indicator's conditions
longSignal := longCondition ? 1.0 : 0.0
shortSignal := shortCondition ? 1.0 : 0.0
// Plot continuous signals
plot(longSignal, title="Long Signal", color=#00FF00, linewidth=2, transp=0, style=plot.style_line)
plot(shortSignal, title="Short Signal", color=#FF0000, linewidth=2, transp=0, style=plot.style_line)
```
### Benefits of Continuous Position Signals
- Provides clear visual feedback of current position state (long/short)
- Signal values stay consistent (0 or 1) until condition changes
- Can be used for additional calculations or alert conditions
- Makes it easier to track when entry conditions are triggered
### Using with Custom Indicators
You can adapt the continuous position signals to work with any custom indicator by replacing the condition with your indicator's logic:
```pine
// Example with moving average crossover
longSignal := fastMA > slowMA ? 1.0 : 0.0
shortSignal := fastMA < slowMA ? 1.0 : 0.0
```
## Webhook Integration
The LongShortExit strategy is fully compatible with TradingView's webhook alerts, allowing you to connect your strategy to external trading platforms, brokers, or custom applications for automated trading execution.
### Setting Up Webhooks
1. Create an alert on your chart with the LongShortExit strategy
2. Enable the "Webhook URL" option in the alert dialog
3. Enter your webhook endpoint URL (from your broker or custom trading system)
4. Customize the alert message with relevant information using TradingView variables
### Webhook Message Format Example
```json
{
"strategy": "LongShortExit",
"action": "{{strategy.order.action}}",
"price": "{{strategy.order.price}}",
"quantity": "{{strategy.position_size}}",
"time": "{{time}}",
"ticker": "{{ticker}}",
"position_size": "{{strategy.position_size}}",
"position_value": "{{strategy.position_value}}",
"order_id": "{{strategy.order.id}}",
"order_comment": "{{strategy.order.comment}}"
}
```
### TradingView Alert Condition Examples
For effective webhook automation, set up these alert conditions:
#### Entry Alert
```
{{strategy.position_size}} != {{strategy.position_size}}
```
#### Exit Alert
```
{{strategy.position_size}} < {{strategy.position_size}} or {{strategy.position_size}} > {{strategy.position_size}}
```
#### Partial Take Profit Alert
```
strategy.order.comment contains "Partial TP"
```
### Benefits of Webhook Integration
- **Automated Trading**: Execute trades automatically through supported brokers
- **Cross-Platform**: Connect to custom trading bots and applications
- **Real-Time Notifications**: Receive trade signals on external platforms
- **Data Collection**: Log trade data for further analysis
- **Custom Order Management**: Implement advanced order types not available in TradingView
### Compatible External Applications
- Trading bots and algorithmic trading software
- Custom order execution systems
- Discord, Telegram, or Slack notification systems
- Trade journaling applications
- Risk management platforms
### Implementation Recommendations
- Test webhook delivery using a free service like webhook.site before connecting to your actual trading system
- Include authentication tokens or API keys in your webhook URL or payload when required by your external service
- Consider implementing confirmation mechanisms to verify trade execution
- Log all webhook activities for troubleshooting and performance tracking
## Strategy Customization Tips
### For Scalping
- Set smaller profit targets (1-3 points)
- Use tighter stop-losses
- Enable break-even feature after small profit
- Set higher max trades per day
### For Day Trading
- Use moderate profit targets
- Implement partial profit taking
- Enable trailing stops
- Set reasonable session trading hours
### For Swing Trading
- Use longer-term charts
- Set wider stops (ATR-based often works well)
- Use higher profit targets
- Disable daily streak reset
## Common Troubleshooting
### Low Win Rate
- Consider widening stop-losses
- Verify that entry conditions aren't triggering too frequently
- Check if the equals condition is too restrictive; consider small tolerances
### Missing Obvious Trades
- The equals condition is extremely precise. Price must exactly match the specified value.
- Consider using floating-point precision for more reliable triggers
### Frequent Stop-Outs
- Try ATR-based stops instead of fixed points
- Increase the stop-loss distance
- Enable break-even feature to protect profits
## Important Notes
- The exact equals condition is strict and may result in fewer trade signals compared to other conditions.
- For instruments with decimal prices, exact equality might be rare. Consider the precision of your value.
- Break-even and trailing stop calculations are based on points, not percentage.
- Partial take-profit levels are defined in points distance from entry.
- The continuous position signals (0 to 1) provide valuable visual feedback but don't affect the strategy's trading logic directly.
- When implementing continuous signals, ensure they're aligned with the actual entry conditions used by the strategy.
---
*This strategy is for educational and informational purposes only. Always test thoroughly before using with real funds.*

Awesome Oscillator (AO) with Signals [AIBitcoinTrend]👽 Multi-Scale Awesome Oscillator (AO) with Signals (AIBitcoinTrend)
The Multi-Scale Awesome Oscillator transforms the traditional Awesome Oscillator (AO) by integrating multi-scale wavelet filtering, enhancing its ability to detect momentum shifts while maintaining responsiveness across different market conditions.
Unlike conventional AO calculations, this advanced version refines trend structures using high-frequency, medium-frequency, and low-frequency wavelet components, providing traders with superior clarity and adaptability.
Additionally, it features real-time divergence detection and an ATR-based dynamic trailing stop, making it a powerful tool for momentum analysis, reversals, and breakout strategies.
👽 What Makes the Multi-Scale AO – Wavelet-Enhanced Momentum Unique?
Unlike traditional AO indicators, this enhanced version leverages wavelet-based decomposition and volatility-adjusted normalization, ensuring improved signal consistency across various timeframes and assets.
✅ Wavelet Smoothing – Multi-Scale Extraction – Captures short-term fluctuations while preserving broader trend structures.
✅ Frequency-Based Detail Weights – Separates high, medium, and low-frequency components to reduce noise and improve trend clarity.
✅ Real-Time Divergence Detection – Identifies bullish and bearish divergences for early trend reversals.
✅ Crossovers & ATR-Based Trailing Stops – Implements intelligent trade management with adaptive stop-loss levels.
👽 The Math Behind the Indicator
👾 Wavelet-Based AO Smoothing
The indicator applies multi-scale wavelet decomposition to extract high-frequency, medium-frequency, and low-frequency trend components, ensuring an optimal balance between reactivity and smoothness.
sma1 = ta.sma(signal, waveletPeriod1)
sma2 = ta.sma(signal, waveletPeriod2)
sma3 = ta.sma(signal, waveletPeriod3)
detail1 = signal - sma1 // High-frequency detail
detail2 = sma1 - sma2 // Intermediate detail
detail3 = sma2 - sma3 // Low-frequency detail
advancedAO = weightDetail1 * detail1 + weightDetail2 * detail2 + weightDetail3 * detail3
Why It Works:
Short-Term Smoothing: Captures rapid fluctuations while minimizing noise.
Medium-Term Smoothing: Balances short-term and long-term trends.
Long-Term Smoothing: Enhances trend stability and reduces false signals.
👾 Z-Score Normalization
To ensure consistency across different markets, the Awesome Oscillator is normalized using a Z-score transformation, making overbought and oversold levels stable across all assets.
normFactor = ta.stdev(advancedAO, normPeriod)
normalizedAO = advancedAO / nz(normFactor, 1)
Why It Works:
Standardizes AO values for comparison across assets.
Enhances signal reliability, preventing misleading spikes.
👽 How Traders Can Use This Indicator
👾 Divergence Trading Strategy
Bullish Divergence
Price makes a lower low, while AO forms a higher low.
A buy signal is confirmed when AO starts rising.
Bearish Divergence
Price makes a higher high, while AO forms a lower high.
A sell signal is confirmed when AO starts declining.
👾 Buy & Sell Signals with Trailing Stop
Bullish Setup:
✅AO crosses above the bullish trigger level → Buy Signal.
✅Trailing stop placed at Low - (ATR × Multiplier).
✅Exit if price crosses below the stop.
Bearish Setup:
✅AO crosses below the bearish trigger level → Sell Signal.
✅Trailing stop placed at High + (ATR × Multiplier).
✅Exit if price crosses above the stop.
👽 Why It’s Useful for Traders
Wavelet-Enhanced Filtering – Retains essential trend details while eliminating excessive noise.
Multi-Scale Momentum Analysis – Separates different trend frequencies for enhanced clarity.
Real-Time Divergence Alerts – Identifies early reversal signals for better entries and exits.
ATR-Based Risk Management – Ensures stops dynamically adapt to market conditions.
Works Across Markets & Timeframes – Suitable for stocks, forex, crypto, and futures trading.
👽 Indicator Settings
AO Short Period – Defines the short-term moving average for AO calculation.
AO Long Period – Defines the long-term moving average for AO smoothing.
Wavelet Smoothing – Adjusts multi-scale decomposition for different market conditions.
Divergence Detection – Enables or disables real-time divergence analysis. Normalization Period – Sets the lookback period for standard deviation-based AO normalization.
Cross Signals Sensitivity – Controls crossover signal strength for buy/sell signals.
ATR Trailing Stop Multiplier – Adjusts the sensitivity of the trailing stop.
Disclaimer: This indicator is designed for educational purposes and does not constitute financial advice. Please consult a qualified financial advisor before making investment decisions.
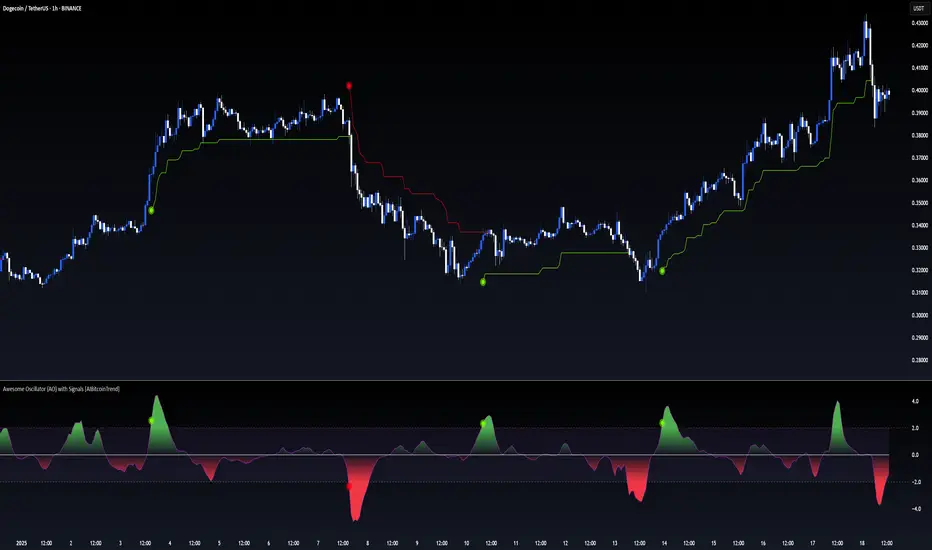
Enhanced ROC - Savitzky–Golay [AIBitcoinTrend]👽 Adaptive ROC - Savitzky–Golay (AIBitcoinTrend)
The Adaptive ROC - Savitzky–Golay redefines traditional Rate of Change (ROC) analysis by integrating Savitzky–Golay smoothing with volatility-adaptive normalization, allowing it to dynamically adjust across different market conditions. Unlike the standard ROC, which reacts rigidly to price changes, this advanced version refines trend signals while maintaining responsiveness to volatility.
Additionally, this indicator features real-time divergence detection and an ATR-based trailing stop system, equipping traders with a powerful toolset for momentum analysis, reversals, and trend-following strategies.
👽 What Makes the Adaptive ROC - Savitzky–Golay Unique?
Unlike conventional ROC indicators, this enhanced version leverages volatility-adjusted scaling and Z-score normalization to improve signal consistency across different timeframes and assets.
✅ Savitzky–Golay Smoothing – Reduces noise while preserving trend structure for clearer signals.
✅ Volatility-Adaptive Normalization – Ensures that overbought and oversold thresholds remain consistent across different markets.
✅ Real-Time Divergence Detection – Identifies early bullish and bearish divergence signals for potential reversals.
✅ Crossovers & ATR-Based Trailing Stops – Implements intelligent trade management with dynamic stop levels.
👽 The Math Behind the Indicator
👾 Savitzky–Golay Smoothing
The indicator applies a Savitzky–Golay filter to the raw ROC data, creating a smoother curve while preserving key inflection points. This technique prevents excessive lag while maintaining the integrity of price movements.
sg_roc = (roc_raw + 3*roc_raw + 5*roc_raw + 7*roc_raw + 5*roc_raw + 3*roc_raw + roc_raw ) / 25
👾 Volatility-Adaptive Scaling
By dynamically adjusting the smoothed ROC using standard deviation, the indicator ensures that momentum readings remain relative to the market’s current volatility.
volatility = ta.stdev(close, rocLength)
dynamicFactor = 1 / (1 + volatility / 100)
advanced_sg_roc = sg_roc * dynamicFactor
👾 Z-Score Normalization
To maintain a stable Overbought/Oversold structure across different markets, the ROC is normalized using a Z-score transformation, ensuring its values remain statistically relevant.
rocMean = ta.wma(advanced_sg_roc, lenZ)
rocStdev = ta.stdev(advanced_sg_roc, lenZ)
zRoc = (advanced_sg_roc - rocMean) / rocStdev
👽 How Traders Can Use This Indicator
👾 Divergence Trading Strategy
Bullish Divergence Setup:
Price makes a lower low, while the ROC forms a higher low.
A buy signal is confirmed when the ROC starts rising.
Bearish Divergence Setup:
Price makes a higher high, while the ROC forms a lower high.
A sell signal is confirmed when the ROC starts declining.
👾 Buy & Sell Signals with Trailing Stop
Bullish Setup:
✅ ROC crosses above the bullish trigger level → Buy Signal.
✅ A bullish trailing stop is placed at Low - (ATR × Multiplier).
✅ Exit if price crosses below the stop.
Bearish Setup:
✅ ROC crosses below the bearish trigger level → Sell Signal.
✅ A bearish trailing stop is placed at High + (ATR × Multiplier).
✅ Exit if price crosses above the stop.
👽 Why It’s Useful for Traders
Savitzky–Golay Filtering – Retains essential trend details while eliminating excessive noise.
Volatility-Adjusted Normalization – Makes overbought/oversold levels universally reliable across markets.
Real-Time Divergence Alerts – Identifies early reversal signals for optimal entries and exits.
ATR-Based Risk Management – Ensures stops dynamically adapt to market conditions.
Works Across Markets & Timeframes - Suitable for stocks, forex, crypto, and futures trading.
👽 Indicator Settings
ROC Period – Defines the number of bars used for ROC calculation.
Smoothing Strength – Adjusts the degree of Savitzky–Golay filtering.
Volatility Scaling – Enables or disables the adaptive volatility factor.
Enable Divergence Analysis – Turns on real-time divergence detection.
Lookback Period – Specifies the pivot detection period for divergences.
Enable Crosses Signals – Activates trade signals based on ROC crossovers.
ATR Multiplier – Controls the sensitivity of the trailing stop.
Disclaimer: This indicator is designed for educational purposes and does not constitute financial advice. Please consult a qualified financial advisor before making investment decisions.