PpSignal Multi-Day VWAPThank to @mortdiggiddy
original script:
Chart the multi-day Volume Weighted Average Price ( VWAP ). Normally, the VWAP is tracked for the current day, from the first bar of the day (regular or extended session). The VWAP shows the current value of:
-> sum(hlc3 * volume , barsForDay) / sum( volume , barsForDay),
-> where 'barsForDay' is the total number bars that have elapsed during the day for the chart interval.
The multi-day version tracks the VWAP for N days back, by averaging the previous N - 1 day bars VWAP and the current VWAP for the current bar (chart interval).
This is very different that simply using a volume weighted moving average , since the closing VWAP values are used for the historical day bars. The results are interesting for intraday trades... especially for values of 1, 2, 3, 4, 5 ....to 21 days.
Search in scripts for "VWAP"

Navigator Triple VolumeNavigator Triple Volume (VWAP + Fixed VP + Flexible VP)
**Navigator Triple Volume** combines three of the most practical volume-based tools into one clean overlay:
1. **VWAP (anchored) with optional deviation bands**
2. **Fixed Volume Profile** (auto-building by anchor timeframe, with optional developing/current profile)
3. **Flexible Volume Profile** (manual start/end window for custom range analysis)
The goal is simple: give you **institutional-grade context**—where price is “fair,” where volume is accepted, and where the real inventory is sitting—without stacking multiple indicators.
1) Anchored VWAP + Bands
This script plots an **anchored VWAP** and optional **±1 and ±2 standard deviation bands** to help you gauge:
* “Fair value” (VWAP)
* Stretch/extension zones (deviation bands)
* Mean reversion vs. trend strength around VWAP
Anchor period options include **Daily, Week, Month, Quarter, Year**, and event-based anchors like **Earnings, Dividends, and Splits** (where supported).
2) Fixed Volume Profile
The Fixed VP automatically builds a **completed profile each time the anchor timeframe rolls over** (ex: Daily). It can also display the **current/developing profile** for the active anchor period.
Includes:
* **PoC (Point of Control)**
* **Value Area (VAH/VAL)** based on a configurable % (default 68%)
* Adjustable **rows (resolution)**, **profile width**, and **bar thickness**
3) Flexible Volume Profile
Flexible VP lets you define a **custom range** using a manual **Start Calculation** and **End Calculation** time selection. This is ideal for:
* Single swing legs
* News/event reactions
* Range breaks
* “From low to high” campaign profiling
Includes:
* PoC + Value Area levels
* Adjustable profile resolution and styling
How traders use it
* Use **VWAP** as the “fair value” magnet and trend filter
* Use **Fixed VP** to identify session/period acceptance and key reference levels
* Use **Flexible VP** to profile *your chosen range* and locate the true battleground: PoC, VAH, and VAL
When all three agree, it’s a high-confidence area for decision-making. When they disagree, it often signals transition or rotation.
Notes
* This indicator draws profiles using TradingView line objects and includes controls to manage performance and display preferences.
* Built for chart clarity: one script, three volume lenses.

DR/IDR, fractals, break + EMA Clouds + VWAPThis indicator is a powerful, multi-layered trading tool that combines three distinct forms of market analysis—volume, trend, and opening volatility—onto a single chart.
1. Opening Range Breakout (ORB) System
This is the foundation of the indicator, designed to capture the initial volatility and set key price boundaries for the trading day.
Time Focus: The indicator's primary analysis is centered on a specific, user-defined time period (default is 9:30 AM to 10:30 AM New York Time). Nothing related to the ORB drawing will appear on the chart before this session starts.
Wick High/Low (The Trigger): These lines track the absolute highest and lowest prices reached during the time window. They define the full extent of the initial range and are used to determine when a genuine breakout occurs.
Body High/Low (The Range & Targets): These lines track the highest and lowest open/close prices of the candles within the session. This area forms the central, shaded zone, representing the core consolidation area.
Range Shading: The background between the Body High and Body Low is shaded, but this visual feature only appears during the active forming time window (e.g., 9:30 AM to 10:30 AM) to maintain chart clarity.
Fractals: While the range is forming, the indicator detects 5-bar Williams Fractal patterns that occur inside the range. These small triangles (▲ or ▼) highlight minor reversal points established by the early trading action.
Breakout Signal: After the user-defined time window closes, the indicator waits. If a subsequent candle's price moves above the Wick High or below the Wick Low, a "BREAK" label is displayed on that candle. It is programmed to label only the first decisive break in each direction per day.
Extension Targets: When a breakout occurs, target lines are automatically projected above the Body High (for a bullish break) or below the Body Low (for a bearish break). The distance between these targets is calculated based on a user-defined fraction (e.g., 0.5 steps) of the total height of the Body Range.
Line Cutoff: For tidiness, you can set a "Stop Time" (e.g., 4:00 PM) after which the ORB lines will automatically disappear.
2. EMA Clouds (Trend and Momentum)
Four distinct Exponential Moving Average (EMA) clouds are plotted to provide a dynamic, multi-speed view of the market's trend and momentum.
Structure: Each "Cloud" is the shaded area between two EMAs (one shorter length and one longer length). The indicator includes four customizable pairs (defaulting to common settings like 8/9, 8/14, 34/50, and 14/21).
Trend Coloring: The clouds are color-coded:
Bullish (Greenish): The shorter EMA is trading above the longer EMA, signaling upward momentum.
Bearish (Reddish): The shorter EMA is trading below the longer EMA, signaling downward momentum.
Application: These clouds are used to confirm the overall market direction or identify potential zones of support and resistance.
3. Volume-Weighted Average Price (VWAP)
The VWAP is a crucial anchor for measuring the market's efficiency throughout the trading day.
Function: It calculates the average price of the asset, giving more weight to prices where higher volume was traded.
Context: It helps traders quickly determine if the current price is trading at a premium (above VWAP) or a discount (below VWAP) relative to the day's volume.
Reset: The VWAP line automatically resets at the beginning of each trading day.
Customization: The VWAP line can be toggled on or off, and its color and width are fully adjustable.

FAIRPRICE_VWAP_RDFAIRPRICE_VWAP_RD
This script plots an **anchored VWAP (Volume Weighted Average Price)** that resets
based on the user-selected anchor period. It acts as a dynamic “fair value” line
that reflects where the market has actually transacted during the chosen period.
FEATURES
- Multiple anchor options: Session, Week, Month, Quarter, Year, Decade, Century,
Earnings, Dividends, or Splits.
- Intelligent handling of the “Session” anchor so it works correctly on both 1m
(resets each new day) and 1D (continuous, non-resetting VWAP).
- Manual VWAP calculation using cumulative(price * volume) and cumulative(volume),
ensuring the line is stable and works on all timeframes.
- Optional hiding of VWAP on daily or higher charts.
- Offset input for horizontal shifting if desired.
- VWAP provides a true “fair price” reference for trend, mean-reversion,
and institutional-level analysis.
PURPOSE
This indicator solves the common problem of VWAP behaving incorrectly on higher
timeframes, on synthetic data, or with unusual anchors. By implementing VWAP
manually and allowing flexible reset conditions, it functions reliably as
an institutional-style fair value benchmark across any timeframe.

Multi EMA and SMA with VWAP Indicator📊 Custom Multi-MA & VWAP Indicator
A comprehensive and fully customizable moving average indicator that combines 6 Exponential Moving Averages (EMAs), 3 Simple Moving Averages (SMAs), and VWAP in one clean, easy-to-use tool.
✨ Features:
6 Configurable EMAs:
• Default periods: 9, 21, 50, 100, 150, 200
• Fully adjustable lengths
• Individual color customization
• Show/hide toggles for each EMA
3 Configurable SMAs:
• Default periods: 20, 50, 100
• Fully adjustable lengths
• Individual color customization
• Show/hide toggles for each SMA
• Thicker lines for easy distinction from EMAs
VWAP (Volume Weighted Average Price):
• Toggle on/off
• Customizable color and line width
• Essential for intraday trading and institutional levels
🎯 Use Cases:
• Trend identification and confirmation
• Support and resistance levels
• Entry and exit signals
• Multi-timeframe analysis
• Day trading and swing trading strategies
• Institutional price levels (VWAP)
⚙️ Fully Customizable:
Every aspect of this indicator is configurable through the settings panel:
• Adjust any MA period to fit your trading strategy
• Choose your preferred colors for better chart visualization
• Enable/disable specific MAs to reduce chart clutter
• Customize VWAP line thickness
📈 Perfect For:
• Traders who use multiple moving averages in their strategy
• Those seeking an all-in-one MA solution
• Clean chart organization with one indicator instead of multiple
• Both beginners and experienced traders
💡 Tips:
• Use shorter EMAs (9, 21) for quick trend changes
• Longer EMAs (100, 150, 200) act as strong support/resistance
• VWAP is particularly useful for intraday trading
• Customize colors to match your chart theme
Version: Pine Script v6
Overlay: Yes (plots directly on price chart)

FPT - Key Levels with VWAP🔶 FPT – Key Levels with VWAP
This indicator combines multi-session VWAP, higher-timeframe key levels, market structure (HH/HL/LH/LL), and liquidity zones into one clean intraday tool.
Designed for scalping, day-trading, and session-based strategies such as Asia → London → New York flows.
🔵 Features
1. Multi-Session VWAP
Asia VWAP
London VWAP
New York VWAP
Daily reset
Optional deviations & clean mode
2. Key Levels (HTF SR Zones)
Automatically detects:
Previous Day High / Low
4H / 1H Key Levels
Session High / Low
Midpoints
Equal Highs & Equal Lows (liquidity lines)
3. Market Structure Engine
Swing points (HH, HL, LH, LL)
Break of Structure (BOS)
Market Structure Shift (MSS)
Optional minimal mode showing only breaks
4. Liquidity Tools
Buyside & sellside liquidity zones
Range high / low liquidity
Optional void / imbalance zones
5. Clean Visualization Mode
Removes unnecessary text
Shows only the essential levels
Perfect for chart posting or backtesting
🟩 Use Cases
Intraday key level mapping
VWAP deviation → mean reversion setups
Liquidity sweep → BOS/MSS setups
Session volatility filtering
Scalping and fast execution planning
⚠️ Disclaimer
This script does not provide financial advice.
It is for educational and analytical purposes only.
All trading decisions are solely your responsibility.

DeltaATR + VWAP DIF + MA'sI attempted to create an indicator using a different approach to analyzing potential trend reversals, and although it is still a work in progress, it is already fully functional. The indicator combines the price relative to VWAP with ATR normalization, providing a way to measure deviations in terms of market volatility.
How the indicator works:
Delta Calculation:
The core of the indicator calculates the difference between the current price and the VWAP (Volume Weighted Average Price), then normalizes this difference by the ATR (Average True Range). This provides a volatility-adjusted measure of how far the price has moved relative to its typical range.
Histogram Visualization:
The deltaATR is displayed as a histogram, where positive values indicate the price is above VWAP and negative values indicate it is below. The histogram is color-coded for easy interpretation: typically red for above VWAP and green for below, with configurable transparency.
Dual Moving Averages:
Two moving averages (fast and slow) are applied to the deltaATR. This creates a crossover system:
When the fast average crosses above the slow average, it may indicate an upcoming bullish reversal.
When the fast average crosses below the slow average, it may indicate a potential bearish reversal.
Zero Line Reference:
A reference line at zero corresponds to VWAP, helping traders see whether price is generally above or below the average volume-weighted level.
Alert Lines (Optional Panel):
A second panel provides four configurable alert lines, allowing users to set key thresholds to monitor extreme deltaATR values. These lines are thin, dashed, and fully customizable in terms of color and thickness.
Panel for Values and Signals:
The indicator includes a side panel showing:
Current deltaATR
Fast and slow averages
Current trend signal (Bullish, Bearish, or Neutral)
How it can be used:
Identify potential trend reversals by monitoring the crossover between the fast and slow averages of deltaATR.
Use the histogram to observe when the price is deviating significantly from VWAP in terms of ATR.
Set alert lines for specific thresholds to highlight overextended conditions or significant volatility moves.
Combine with other technical indicators for confirmation before entering or exiting trades.
This indicator is particularly useful for traders looking to anticipate reversals in volatile markets, as it adapts the delta measure to the current market conditions using ATR normalization, making it more responsive and robust than raw price deviations alone.

Current Year OHLMV Pro+Current Year OHLV + Anchored VWAP – Professional Edition
OVERVIEW
Real-time display of the current calendar year’s developing Open, High, Low, Close (live), and anchored VWAP with a full-size current-year candle in the right margin.
IMPLEMENTATION & VALUE ADDED
• Live anchored VWAP as a major yearly fair-value line
• Full current-year candle rendered in the right margin
• All levels as exportable plots
• Comprehensive alerts on every level and VWAP interaction
HOW TO USE
Apply to weekly or daily charts. The live VWAP and right-margin candle provide macro-level bias and yearly anchor points.
CREDIT & TRANSPARENCY
Core methodology: public domain (Current Year OHLC + Anchored VWAP).
Independent implementation with original live candle display and features.
DISCLAIMER
For educational and informational purposes only. Not financial advice. Test thoroughly.

Current Month OHLMV Pro+Current Month OHLV + Anchored VWAP – Professional Edition
OVERVIEW
Real-time display of the current calendar month’s developing Open, High, Low, Close (live), and anchored VWAP with a full-size current-month candle in the right margin.
IMPLEMENTATION & VALUE ADDED
• Live anchored VWAP as a powerful monthly fair-value reference
• Full current-month candle in the right margin
• All levels as exportable plots
• Comprehensive alerts on every level and VWAP touch/break
HOW TO USE
Apply to daily or lower timeframes. Use the live VWAP and right-margin candle for monthly trend bias and high-probability reversal zones.
CREDIT & TRANSPARENCY
Core methodology: public domain (Current Month OHLC + Anchored VWAP).
Independent implementation with original presentation and features.
DISCLAIMER
For educational and informational purposes only. Not financial advice. Test thoroughly.

Institutional Sessions Volume Order Flow [SumitQuants]Institutional Sessions Volume Order Flow
🔥 Institutional Sessions Volume Order Flow — The all-in-one Pine v6 toolkit that reveals institutional volume order blocks, session structure, VWAP bands and trend ribbon so you can trade with professional conviction.
🎯 See where smart money is active. Institutional Sessions Volume Order Flow surfaces high-volume order blocks, session boxes, VWAP bands, MA ribbon and Supertrend alerts — a single overlay that turns market noise into tradable structure. ⚡📈
✨ Key Features
📦 Institutional Volume Order Blocks: Detects bullish & bearish order blocks by aggregating volume around local highs/lows and plots filled zones with volume-percent labels.
🕒 Session Boxes & Timeline: Auto session boxes for Asia/ Europe / NewYork / Sydney with merge options, open/close lines, pip/% labels and optional candle coloring.
📉 VWAP with Bands: Multi-anchor VWAP (Session/Week/Month/Quarter/Year/Earnings/Dividends/Splits) plus up to 3 configurable bands (SD or % mode) and fills.
🧭 Moving Average Ribbon: 4-MA ribbon (SMA/EMA/SMMA/WMA/VWMA) for trend structure and dynamic S/R.
⚡ Supertrend Overlay: Optional Supertrend with conditional background fill and built-in trend-change alert hooks.
🔔 Prebuilt Alerts: Supertrend flips, session opens, session new highs/lows — ready for automation or notifications.
⚙️ Deep Customization: Colors, styles, lookback, merge behaviors, band multipliers, anchor periods, session times, label sizes, and more.
🛠 Pine v6 Optimized: Modern, overlay-ready Pine Script v6 implementation suitable for intraday and multi-timeframe use.
🧠 Why Traders Buy It
🔍 Institutional context: Volume-weighted order blocks reveal where large participants acted — crucial for high-probability trade planning.
✅ Stacked confirmation: Ribbon → VWAP → order block filters noise and aligns entries with institutional flow.
🌐 Session clarity: Quickly identify which market session is driving price and volatility.
📣 Actionable alerts: Be notified exactly when setups trigger so you don’t miss transitions.
🧩 Versatile: Great for scalpers, intraday momentum traders, swing traders, prop desks and system developers.
🚀 Quick Start (3 steps)
Add Institutional Sessions Volume Order Flow to your chart (Pine v6).
Enable Order Blocks + VWAP + Supertrend to begin.
Tune session times and band/MA settings for your instrument and timeframe. Use Supertrend + ribbon alignment + zone retest for higher-probability entries. 🎛️
🧾 Technical Notes & Compatibility
📜 Pine Script v6 — compatible with TradingView’s current scripting environment.
📌 Overlay indicator — draws directly on price chart.
🔔 Alerts use alertcondition hooks for TradingView notifications.
👤 Author: Created and maintained by SumitQuants.
⚠️ Risk Disclaimer
This tool provides context and signals — not guarantees. Backtest, paper trade, and use responsible risk management. Past performance is not indicative of future results. 📉
🛒 Call to Action (CTA)
Ready to trade with institutional clarity?
👉 Buy Institutional Sessions Volume Order Flow now — or message for a demo, custom tweaks, or a bundle including backtest/strategy code. Quick support and configuration help included. 💬
Reach out to the website and Buy This Indicator in the Courses Section www.ironmindtrader.com

Moving Aaverage (EMA) & VWAP by Vish
Multi-Timeframe Moving Averages with VWAP
This indicator combines essential moving averages with VWAP to provide comprehensive trend analysis on a single chart. Designed for traders who need quick visual reference of multiple timeframes and volume-weighted price levels.
Features:
• Six customizable moving averages: 8, 13, 21, 50, 100, and 200 periods
• Toggle between Simple Moving Average (SMA) and Exponential Moving Average (EMA) for all lines
• Individual on/off controls for each moving average
• Volume Weighted Average Price (VWAP) with customizable settings
• VWAP anchor options: Session, Week, Month, Quarter, and Year
• Clean, color-coded visualization for easy identification
• Fully customizable through settings panel
Use Cases:
• Identify trend direction across multiple timeframes
• Find dynamic support and resistance levels
• Spot potential entry and exit points
• Analyze price action relative to volume-weighted average
• Confirm trend strength with multiple MA convergence/divergence
Settings:
All parameters are adjustable including MA type (SMA/EMA), individual MA visibility, VWAP source, and VWAP anchor period.
Suitable for all markets and timeframes. Works on stocks, forex, crypto, commodities, and indices.
#moving average #MA #EMA #SMA #VWAP #trend #support #resistance #multi-timeframe

APXTradez - Intraday Overlay (VWAP + EMAs)🔹 APXTradez Intraday Overlay (VWAP + EMAs)
Purpose:
A clean, real-time intraday framework built for options scalpers and day traders.
This overlay combines VWAP, 8/21 EMAs, Bollinger Bands, and Keltner Channels to visualize short-term momentum, trend structure, and volatility compression directly on your chart.
What It Shows
8 EMA (teal) → Fast momentum and micro-trend direction.
21 EMA (orange) → Short-term trend confirmation and pullback zone.
VWAP (aqua) → Institutional average price; key intraday bias level.
Bollinger Bands (lime) → Standard deviation volatility envelope.
Keltner Channels (fuchsia) → ATR-based volatility range.
Compression Highlight (orange) → Shows when BBs are inside KCs, signaling volatility contraction and potential breakout setup.
How to Use
Apply on 1-min to 15-min charts for intraday trading.
Trend bias:
Price above VWAP and 8/21 EMA stack = bullish intraday momentum.
Price below VWAP and 8/21 EMA stack = bearish bias.
- Compression zones (orange highlights):
Indicates low-volatility consolidation → prepare for breakout.
Wait for breakout direction confirmation before entry.
Combine with momentum indicators (like APX TTM Squeeze, APX RSI or MACD) for confirmation.
Best Use Case
Scalping or day-trading options during high-volume sessions where VWAP and EMA structure drive precision entries and exits.

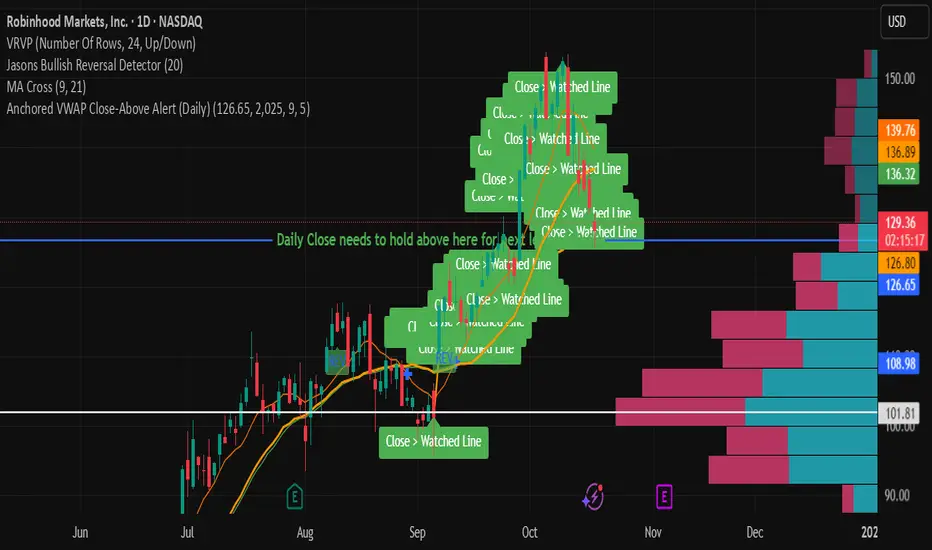
Anchored VWAP Close-Above Alert (Daily)This indicator is a daily anchored VWAP (Volume-Weighted Average Price) tracker that alerts you when price closes above a key pivot line you’ve defined — either dynamically (anchored VWAP from a date like 9/5) or statically (a fixed level like 126.65).
Here’s how each piece works:
1. The anchor date
You give it a date — say September 5, 2025. The script starts calculating VWAP from that day forward. That line represents the average price buyers and sellers have transacted at since that anchor. It’s a kind of “fair-value line” for that period.
2. The logic
Every bar after that date, it adds up (price × volume) and divides by total volume — giving a running VWAP from that starting point. You can instead lock it to a flat number (like 126.65) if you don’t want it recalculating.
3. The alert trigger
Once per day — when the daily candle closes — it checks:
“Did price close above my watched line?”
If yes, it fires an alert (and can draw a label) to tell you that the day’s candle reclaimed that level.
4. The why
That kind of move — a daily close reclaiming a major anchored VWAP — often signals a shift in sentiment or trend strength. Traders watch it to confirm rebounds or invalidations of downside moves.
So in your context:
You anchored to 9/5 (the downside pivot).
You want to know if price closes back above that VWAP (~126.65).
If it does, the alert lights up — confirming the “reclaim” you mentioned in your note.
It’s basically your guard dog for the daily close reclaim.
Slovenský Hybrid (VWAP, Multi MA)Slovenský Hybrid (VWAP, Multi MA) – JS VWAP/MA
Tento indikátor som vytvoril ja, Ján Salma – mentor Akadémie , špeciálne pre slovenský trh. Je navrhnutý tak, aby ho bolo možné používať aj na bezplatnej verzii TradingView a zároveň aby ostal priestor na pridanie ďalších vlastných indikátorov.
👉 Čoskoro pribudne nová verzia, ktorá bude obsahovať ešte viac nástrojov v jednom balíku.
Funkcie a nastavenia:
Indikátor kombinuje viacero kľúčových prvkov technickej analýzy do jedného nástroja:
Multi Moving Averages (MA)
Môžeš zobraziť až 4 rôzne kĺzavé priemery.
Každý MA sa dá zapnúť alebo vypnúť podľa potreby.
Možnosť nastaviť dĺžku periody.
Výber typu: SMA alebo EMA.
Nastavenie zdroja ceny (Close, Open, High, Low, atď.).
Možnosť upraviť farbu a hrúbku čiary pre lepší prehľad.
VWAP (Volume Weighted Average Price)
VWAP sa dá zapnúť alebo vypnúť.
Nastavenie farby a hrúbky čiary.
Výhody indikátora
Jednoduché a prehľadné nastavenia v slovenskom jazyku.
Ideálne pre začiatočníkov aj pokročilých traderov.
Kombinuje viacero indikátorov do jedného, čo šetrí miesto v grafe.
Umožňuje flexibilne prispôsobiť vzhľad podľa vlastného štýlu obchodovania.
________________________________________
✅ Tento nástroj je výbornou pomôckou pre každého, kto sa chce zamerať na čistý graf, prehľadné nastavenia a efektívne využitie TradingView.
Slovak Hybrid (VWAP, Multi MA) – JS VWAP/MA
This indicator was created by Ján Salma – mentor of the Slovak Academy , especially for the Slovak market. It is designed to work even on the free version of TradingView, while keeping space for additional indicators on your chart.
👉 A new version with more tools combined in one indicator is coming soon!
Features and Settings:
Multi Moving Averages (MA)
Up to 4 customizable moving averages.
Each MA can be turned on/off individually.
Choose between EMA or SMA.
Adjustable length, source, line width, and color.
VWAP (Volume Weighted Average Price)
Can be enabled/disabled.
Adjustable line thickness and color.
Benefits:
Simple and intuitive settings in Slovak language.
Great for both beginners and advanced traders.
Combines multiple indicators into one → saves chart space.
Fully customizable look to fit your trading style.
________________________________________
✅ A clean, flexible, and easy-to-use indicator for every trader who wants efficiency and clarity in their charts.

Rolling VWAP 7-30-907, 30, and 90-day VWAP (Volume Weighted Average Price) indicator on TradingView provides traders with multiple perspectives on market sentiment and price efficiency across short, medium, and long-term horizons. The 7-day VWAP is particularly useful for active traders or intraday participants who want to gauge near-term value and liquidity. It highlights short-term imbalances, helping to identify overbought or oversold conditions relative to recent trading activity. Meanwhile, the 30-day VWAP smooths out shorter-term noise, offering a more balanced benchmark that swing traders often use to spot trend alignment or potential reversals within a monthly cycle.
The 90-day VWAP serves as a longer-term institutional benchmark, reflecting deeper capital flows and market consensus over a quarter. It’s particularly valuable for position traders or those tracking whether price is consistently trading above or below this broader measure of value, which can indicate long-term accumulation or distribution phases. Using all three together provides a layered framework: the 7-day VWAP for tactical entries, the 30-day VWAP for swing positioning, and the 90-day VWAP for strategic trend confirmation. This multi-timeframe approach allows traders to align short-term signals with medium and long-term market structure, improving precision and conviction in decision-making.
Prof Satoshi

Volume Profile + VWAP + Long Wick StrategyVolume Profile + VWAP + Long Wick Strategy
This indicator combines Volume Profile (VP), VWAP (Volume Weighted Average Price) with deviation bands, and a long wick candle strategy to identify potential support/resistance zones and trading signals. It detects "power wicks" (long shadows with high volume near key levels like POC, VAH/VAL, or VWAP) as reversal setups, generating buy/sell alerts after confirmation wicks appear near these zones.
Key Features:
Volume Profile: Displays VP histogram over a lookback period, highlighting POC (Point of Control), VAH/VAL (Value Area High/Low) with customizable rows and thresholds.
VWAP & Bands: Plots VWAP with 1-3 std dev bands; filters signals based on trend and proximity to bands.
Long Wick Detection: Identifies strong ("power") and signal wicks based on wick/body ratios, ATR size, and volume multipliers. Supports Market Maker (MM) volume bonuses for liquidity zones.
Trading Signals: Generates BUY/SELL arrows when price retests wick levels with confirmation, limited by max signals per zone and min wait bars. Filtered by MTF (multi-timeframe) alignment (e.g., higher TF EMA trend and candle direction) and VWAP trend.
Sessions: Shows POC/VAH/VAL for Asian, London, and NY sessions with optional active-only display.
MTF Analysis: Scores bullish/bearish alignment across two higher timeframes for signal filtering.
Visuals: Liquidity sweep boxes, resistance/support lines, info table (levels, signals remaining, VWAP status), and MTF status box.
Customizable: Adjust wick ratios, volume thresholds, VP rows, MTF periods, and display options.
Ideal for intraday/scalping on forex/crypto/stocks. Use on lower TFs with MTF filters for confluence. Not financial advice—backtest thoroughly!

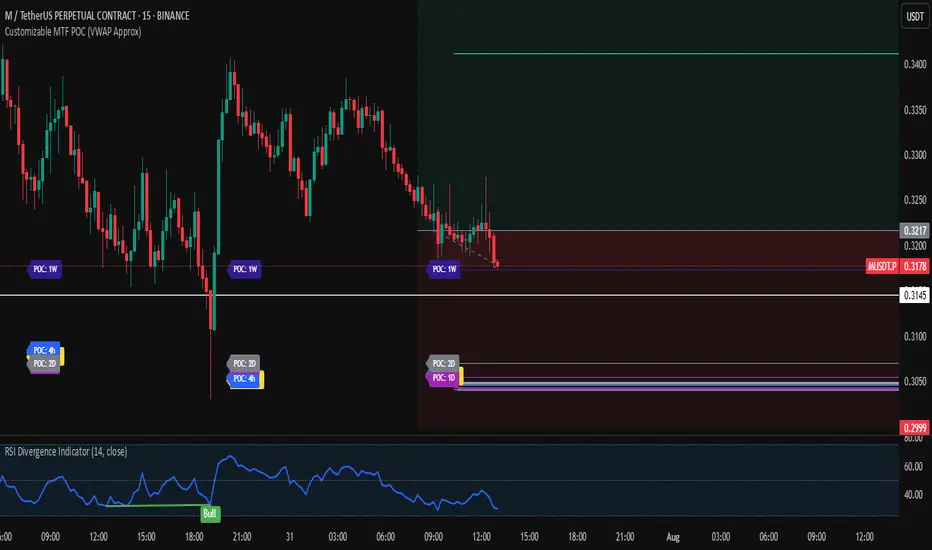
Customizable MTF POC (VWAP Approx)🔍 Multi-Timeframe VWAP POC Zones
This script displays volume-weighted average price (VWAP) levels from multiple timeframes on a single chart. Each VWAP level acts as a potential dynamic support or resistance zone, depending on the price action.
✅ Customizable timeframes included:
1m, 5m, 15m, 1h, 2h, 4h, 1D, 2D, 1W, 1M
📌 Key Features:
– VWAP lines per timeframe with adjustable visibility
– Color-coded for clarity
– Useful for identifying high-confluence support/resistance zones
📈 Usage Tip:
Combine this indicator with price action or liquidity zones for more accurate entries. Confluent VWAP zones across multiple timeframes often signal strong reaction areas.
⚠️ Note: This script uses VWAP as an approximation for Point of Control (POC). It does not rely on true volume profile histograms due to Pine Script limitations. For full volume profile analysis, use TradingView’s built-in “Fixed Range Volume Profile” tool.
day trading check indicatorDay Trading Check Indicator
By Trades per Minute · Creator: Trader Malik
Overview
The Day Trading Check Indicator is an on‐chart status panel that gives you a quick “go/no-go” snapshot of four key metrics—MACD, VWAP, Float, and Bearish Sell-Off—directly in TradingView’s top-right corner. It’s designed for fast decision-making during high-velocity intraday sessions, letting you instantly see whether each metric is “bullish” (green) or “bearish” (red), plus live float data.
What It Shows
Column Description
Metric The name of each metric: MACD, VWAP, Float, Bearish Sell-Off
Status/Value A color-coded status (“GREEN”/“RED” or “YES”/“NO”) or the float value formatted in K/M/B
Metrics & Calculations
MACD (1-Minute)
Calculation: Standard MACD using EMA (12) – EMA (26) with a 9-period signal line, all fetched from the 1-minute timeframe via request.security().
Status:
GREEN if MACD ≥ Signal
RED if MACD < Signal
VWAP (Session-Anchored)
Calculation: Built-in session VWAP (ta.vwap(close)) resets each new trading session.
Status:
GREEN if current price ≥ VWAP
RED if current price < VWAP
Float
Calculation: Retrieves syminfo.shares_outstanding_float (total float), then scales it into thousands (K), millions (M), or billions (B), e.g. “12.3 M.”
Display: Always shown as the absolute float value, white on semi-transparent black.
Bearish Sell-Off
Calculation: Checks the last five 1-minute bars for any “high-volume down” candle (volume above its 20-bar SMA and close < open).
Status:
YES if at least one such bar occurred in the past 5 minutes
NO otherwise
Key Features
Dynamic Table: Automatically shows only the metrics you enable via the Display Options group.
Size Selector: Choose Small, Medium, or Large text for easy visibility.
Clean Styling: Distinct header row with custom background, consistent row shading, centered status text, and a subtle gray border.
Lightweight Overlay: No cluttering plots—just a concise status panel in the corner.
Published by Trader Malik / Trades per Minute
Version: Pine Script v5

EMA 9/21/50 + VWAP + MACD + RSI Pro [v6]Overview:
A powerful multi-indicator tool combining Exponential Moving Averages (EMA 9, 21, 50), Volume-Weighted Average Price (VWAP), Moving Average Convergence Divergence (MACD), and Relative Strength Index (RSI) into a single, easy-to-read system. Designed for traders who want a clean, all-in-one dashboard for trend analysis, momentum confirmation, and overbought/oversold conditions.
Key Features:
1. Triple EMA System (9, 21, 50)
Identifies short-term and medium-term trends.
Bullish Signal: EMA 9 > EMA 21 > EMA 50 (Green Highlight)
Bearish Signal: EMA 9 < EMA 21 < EMA 50 (Red Highlight)
Helps confirm trend direction and potential reversals.
2. VWAP (Volume-Weighted Average Price)
Tracks intraday fair value price based on volume.
Bullish: Price above VWAP (Green)
Bearish: Price below VWAP (Red)
3. MACD (Standard 12, 26, 9 Settings)
Shows momentum shifts.
Bullish: MACD line > Signal line (Green)
Bearish: MACD line < Signal line (Red)
Histogram confirms strength of momentum.
4. RSI (14-Period Default)
Identifies overbought (>70) and oversold (<30) conditions.
Red: Overbought (Potential Reversal)
Green: Oversold (Potential Bounce)
5. Signal Dashboard (Top-Right Table)
Real-time summary of all indicators in one place.
Color-coded for quick interpretation (Green = Bullish, Red = Bearish).
How to Use This Indicator?
✅ Trend Confirmation:
Trade in the direction of EMA alignment (9 > 21 > 50 for uptrends).
Use VWAP as dynamic support/resistance.
✅ Momentum Entries:
Look for MACD crossovers while RSI is not extreme.
Avoid buying when RSI > 70 or selling when RSI < 30 (unless strong trend).
✅ Mean Reversion:
Fade extreme RSI readings (overbought/oversold) when price is at key levels.
Who Is This For?
✔ Swing Traders – EMA + MACD combo for trend-following.
✔ Day Traders – VWAP + EMA for intraday bias.
✔ RSI Traders – Clear overbought/oversold signals.
Settings Customization:
Adjust EMA lengths, RSI periods, and MACD settings as needed.
Toggle VWAP visibility on/off.
Why Use This Script?
📌 All-in-One: No need for multiple indicators cluttering your chart.
📌 Visual Clarity: Color-coded signals for quick decision-making.
📌 Flexible: Works on any timeframe (1M, 5M, 1H, Daily, etc.).
Install now and enhance your trading strategy with a professional-grade multi-indicator system!
Not a financial advice. Use at your own discretion and always apply risk management

NIFTY VWAP DistanceNIFTY Futures VWAP Distance Indicator
Track price deviation from Volume-Weighted Average Price in real-time
📈 Key Features:
Measures absolute (points) and percentage distance from VWAP
Daily session reset aligned with NSE trading hours
Dual-axis visualization with clear zero reference line
Real-time data table display for instant analysis
Typical price calculation: (H+L+C)/3 formula
Built-in safeguards against division errors
🎯 Ideal For:
Intraday traders monitoring mean reversion opportunities
Algorithmic traders needing VWAP deviation metrics
Swing traders identifying overextended price moves
Market profile analysts studying auction theory
📊 How to Use:
Apply to NIFTY Futures chart (1m-1h timeframes recommended)
Blue line = Points above/below VWAP
Red line = Percentage deviation
Positive values = Price > VWAP (bullish territory)
Negative values = Price < VWAP (bearish territory)
💡 Pro Tips:
Combine with volume profile for confirmation
Watch for >1% deviations for potential reversals
Use divergence patterns for early trend change signals
Works best with raw futures data (not continuous contracts)
🔧 Technical Specs:
Pine Script v5+
No repainting
Low latency calculations
Mobile-friendly display
"Know when price strays too far from fair value"

Matrix Series and Vix Fix with VWAP CCI and QQE SignalsMatrix Series and Vix Fix with VWAP CCI and QQE Signals
Short Title: Advanced Matrix
Purpose
This Pine Script combines multiple technical analysis tools to create a comprehensive trading indicator. It incorporates elements like support/resistance zones, overbought/oversold conditions, Williams Vix Fix, QQE (Quantitative Qualitative Estimation) signals, VWAP CCI signals, and a 200-period SMA for trend filtering. The goal is to provide actionable buy and sell signals with enhanced visualization.
Key Features and Components
1. Matrix Series
Smoothing Input: Allows customization of EMA smoothing for the indicator (default: 5).
Support/Resistance Zones: Based on CCI (Commodity Channel Index) values.
Dynamic zones calculated with customizable parameters (SupResPeriod, SupResPercentage, PricePeriod).
Candlestick Visualization: Custom candlestick plots with colors indicating trends.
Dynamic levels for overbought/oversold conditions.
2. Overbought/Oversold Signals
Overbought and oversold levels are adjustable (ob and os).
Plots circles on the chart to highlight extreme conditions.
3. Williams Vix Fix
Identifies potential reversal points by analyzing volatility.
Uses Bollinger Bands and percentile thresholds to detect high-probability entries.
Includes two alert levels (alert1 and alert2) with customizable criteria for signal filtering.
4. QQE Signals
Based on the smoothed RSI and QQE methodology.
Detects trend changes using adaptive ATR bands (FastAtrRsiTL).
Plots long and short signals when specific conditions are met.
5. VWAP CCI Signals
Combines VWAP and CCI for additional trade signals.
Detects crossovers and crossunders of CCI levels (-200 and 200) to generate long and short signals.
6. 200 SMA
A 200-period simple moving average is plotted to act as a trend filter.
The script rules recommend buying only when the price is above the SMA200.
Customizable Inputs
General:
Smoothing, support/resistance periods, overbought/oversold levels.
Williams Vix Fix:
Lookback periods, Bollinger Band settings, percentile thresholds.
QQE:
RSI length, smoothing factor, QQE factor, and threshold values.
VWAP CCI:
Length for calculating deviations.
Visual Elements
Dynamic candlestick colors to indicate trend direction.
Overbought/oversold circles for extreme price levels.
Resistance and support lines.
Labels and shapes for buy/sell signals from Vix Fix, QQE, and VWAP CCI.
Alerts
Alerts are configured for the Matrix Series (e.g., "BUY MATRIX") and other components, ensuring traders are notified when significant conditions are met.
Intended Use
This indicator is designed for traders seeking a multi-faceted tool to analyze market trends, identify potential reversal points, and generate actionable trading signals. It combines traditional indicators with advanced techniques for comprehensive market analysis.

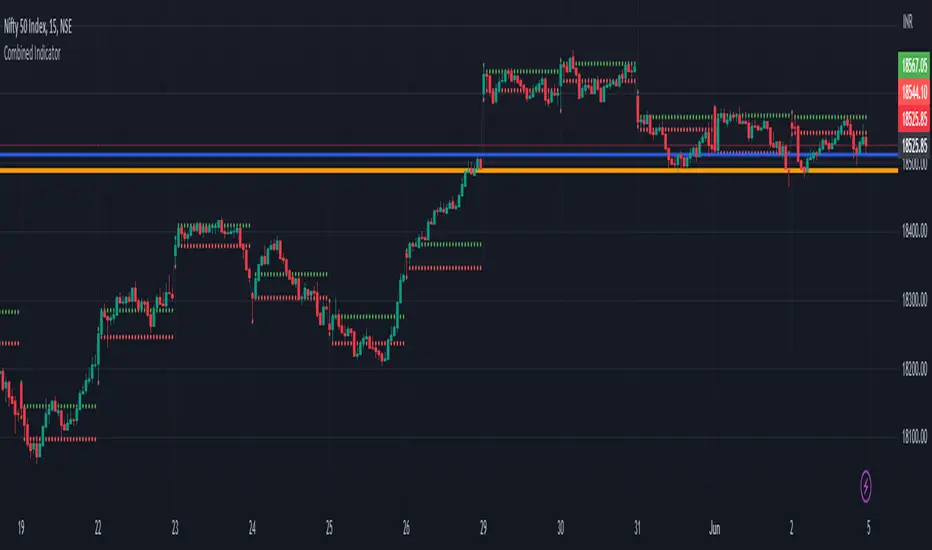
Previous Day Close and Average VWAP value, Current Day 30 min HLThe code provided is a TradingView Pine Script that creates a combined indicator consisting of two separate components:
Indicator 1: Plot Lines with VWAP
This component plots lines on the chart using two different colors and widths.
It uses a custom function f_newLine to create a new line object with a specified color and width.
It uses another custom function f_moveLine to move a line to a specific location on the chart.
The line_close line is moved to a specific date and closing price.
The line_vwap line represents the VWAP (Volume Weighted Average Price) and is plotted using the line.new function.
The VWAP calculation is performed using the typical price (average of high, low, and close) and volume.
The VWAP is plotted on the chart using the plot function.
The previous day's VWAP is also plotted and connected to the current day's VWAP with a line.
Indicator 2: 30 Min high and low breakout
This component identifies a specific time range ("0915-0945") within each trading day.
It uses the ta.valuewhen function to find the highest and lowest prices during that time range.
The highest price is stored in the high_thirtymin variable, and the lowest price is stored in the low_thirtymin variable.
These prices are plotted on the chart as circles, with green representing the high and red representing the low.
The indicator combines these two components to provide visual information about the VWAP and the high/low breakout within a specific time range. The code also includes some additional logic to handle barstate and ensure correct calculations and plotting.
Wick Hunter VWAP & RSIWick Hunter VWAP & RSI Script to be used to produce quality reversal entries based on VWAP with added RSI Filtering.
Wick Connect 2.0 was designed specifically to work with Wick Hunter, the lightning fast cryptocurrency trading robot that can trade for you 24/7.
Simply input your UUID and start trading automatically with Wick Hunter!
The indicator first starts with VWAP entries, with user selectable user selectable inputs to plot percentages above and below current VWAP line.
Percentage Above VWAP = Short Entry
Percentage Below VWAP = Long Entry.
Alerts will fire as soon as price crosses the VWAP Line if using "Once per bar", and may disappear after.
Alerts shown on the chart are confirmed via candle close, and as such, "Once per bar close" should be used if the user wants to only trade confirmed signals.
RSI Filtering has been added with separate RSI Values for both long and shorts which can used to filter entries.
RSI Long Min: Minimum RSI value to fire alerts.
RSI Long Max: Maximum RSI value to fire alerts.
RSI Short Min: Minimum RSI value to fire alerts.
RSI Short Max: Maximum RSI value to fire alerts.
Happy Trading.
