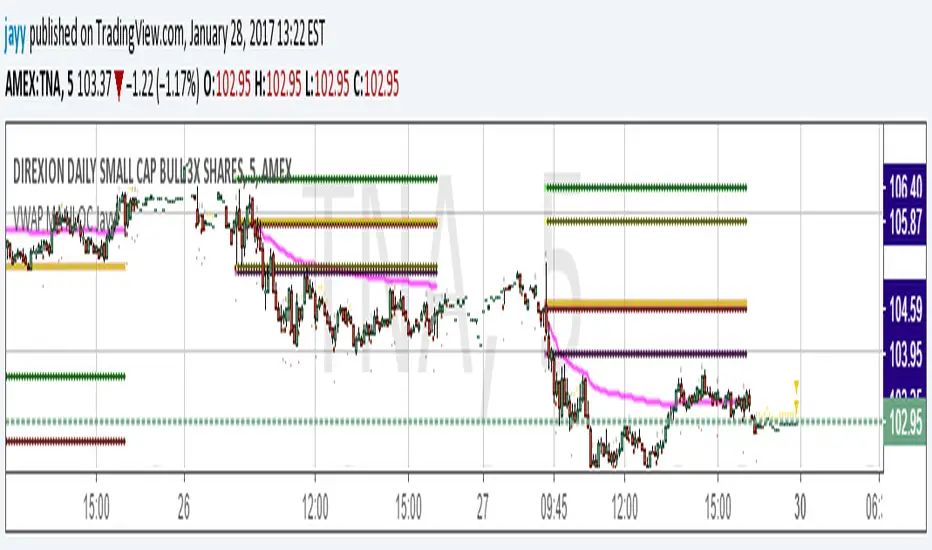
VWAP MA HLOC securities Jayy update fix This version replaces previous versions that stopped functioning as a result of a TradingView script update.
This script complies with the current script syntax.
for intraday securities default is 9:30 am to 4 pm Eastern Other session choices are provided in the format dialogue box.
script plots VWAP, yesterday's high, low, open and close (HLOC), the day befores HLOC - if desired, today's open and todays high and low.
Also signals inside bars (high is less than or equal to the previous
bar's high and the low is greater than or equal to
the previous low) the : true inside bars have a maroon triangle below the bar as well as a ">" above the bar.
If subsequent bars are inside the last bar before the last true inside bar they also are marked with an ">"
Also plots the 20 ema for different time periods (as per Al Brooks), If you trade the 5 min then you will
likely be interested in the 20 ema for 15 mins and 60 mins
the following is a list of the higher timeframe 20 emas
1 minute 5, 15, 60 period 20 ema
5 minute 15, 60 period 20 ema
15 minute 60, 120 , 240 period 20 ema
60 minute 120, 240 period 20 ema
120 minute 240, D period 20 ema
240 minute D period 20 ema
Jayy
Search in scripts for "VWAP"

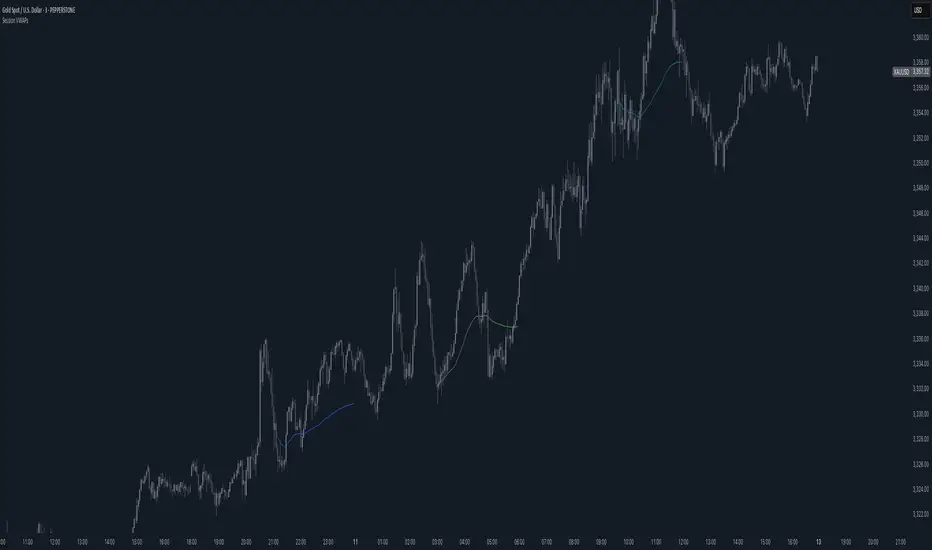
VWAP forex Yesterday Hi/Low switchThis script plots VWAP, yesterday's high, low, open and close (HLOC), the day before's HLOC -
Also plots higher timeframe 20 emas including:
1 minute 5, 15, 60 period 20 ema
5 minute 15, 60 period 20 ema
15 minute 60, 120 , 240 period 20 ema
60 minute 120, 240 period 20 ema
120 minute 240, D period 20 ema
240 minute D period 20 ema
Also signals inside bars (high is less than or equal to the previous
bar's high and the low is greater than or equal to the previous low) the : true inside bars have a maroon triangle below the bar as well as a ">" above the bar.
If subsequent bars are inside the last bar before the last true inside bar they also are marked with an ">"
If you have suggestions let me know.
Jayy

VWAP MA HLOC JAyy
For intraday 9:30 to 4 pm Eastern plots VWAP, yesterday's high, low, open and close (HLOC), the day before HLOC - if desired, today's open and today's high and low.
Also signals inside bars (high is less than or equal to the previous bar's high and the low is greater than or equal to
the previous low) the : true inside bars have a maroon triangle below the bar as well as a ">" above the bar.
If subsequent bars are inside the last bar before the last true inside bar they also are marked with an ">"
Also plots the 20 ema for different periods, If you trade the 5 min then you will likely be interested in the 20 ema for 15 mins and 60 mins

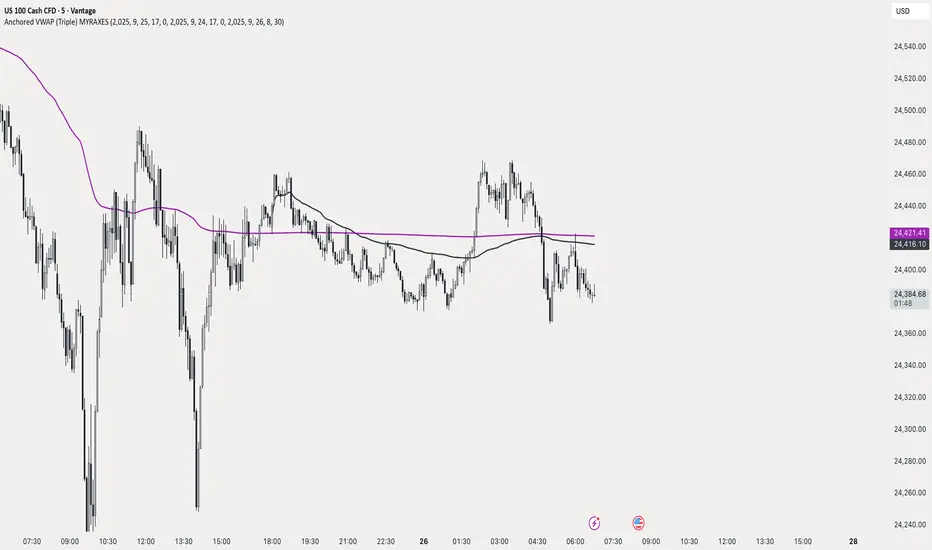
Anchored VWAP (Triple) MYRAXESAnchored VWAP Triple Indicator
The Anchored VWAP Triple indicator is a powerful tool for technical analysis, allowing traders to plot three customizable anchored Volume Weighted Average Price (VWAP) lines on a chart. Unlike traditional VWAP, which resets daily, this indicator lets you anchor each VWAP to a specific date and time, providing a unique perspective on price action relative to key market events.
Features
Three Independent VWAPs: Plot up to three VWAP lines, each anchored to a user-defined date and time.
Customizable Inputs: Set the year, month, day, hour, and minute for each VWAP anchor point. Choose distinct colors for easy identification.
Pure Anchored Design: VWAP lines start only from the anchor point, with no pre-anchor extensions, ensuring a clean and focused analysis.
Debug Mode: Optional display of hour and minute for troubleshooting or educational purposes.
Default Settings: Pre-configured with practical defaults (e.g., September 2025 dates) for immediate use.
How to Use
Add the indicator to your TradingView chart.
Adjust the anchor dates and times for each VWAP (VWAP 1, VWAP 2, VWAP 3) via the input settings.
Select custom colors for each VWAP line to differentiate them on the chart.
Enable Debug Mode if needed to verify time alignment.
Analyze price movements relative to the anchored VWAPs to identify support, resistance, or trend shifts.
Benefits
Ideal for swing traders and long-term analysts who need to anchor VWAP to significant price levels or events.
Enhances decision-making by comparing multiple VWAPs from different anchor points.
Fully compatible with TradingView’s Pine Script v6 for smooth performance.
This indicator is perfect for traders looking to deepen their market analysis with a flexible, multi-VWAP approach. Share your feedback or custom setups in the comments!
Underlying VWAPFor all who swear by and trade using VWAP, this is a modification of the same.
The current settings are set for NSE:BANKNIFTY , however this can easily be changed for NSE:NIFTY
*** How is this indicator different ? ***
This indicator color codes the VWAP on NSE:BANKNIFTY basis the price movement of top 6 NSE:BANKNIFTY constituents with respect to their respective VWAPs.
It uses the weights of individual underlying stocks to calculate a relative strength of NSE:BANKNIFTY 's price movement w.r.t. its VWAP.
A threshold value of 80% is set as to define if the movement is strong or not.
If the up move is strong, it is plotted as Dark Green color on VWAP.
If the down move is strong, it is plotted as Dark Red color on VWAP.
Otherwise, VWAP is white in color.
*** How to Trade using this Indicator? ***
-Buy when the VWAP is dark green. This indicates that majority of the constituents are trading above VWAP by half ATR. A change from RED or WHITE to DARK GREEN color of VWAP is go ahead to initiate a long position.
-Sell when the VWAP is dark Red. This indicates that majority of the constituents are trading below their VWAP by half ATR. A change from Green or WHITE to DARK RED color of VWAP is go ahead to initiate a Short position.
-When VWAP is white, I would recommend not to initiate any positions, at least on options side as it indicates either a range bound price movement or lack of momentum.
- If one is already in a position, Long or short, do not exit if a white VWAP appears. Having said that, other indicator based exit signals or price action based exit signals can be used to exit the position. But using this indicator only, one should exit when VWAP turns RED.

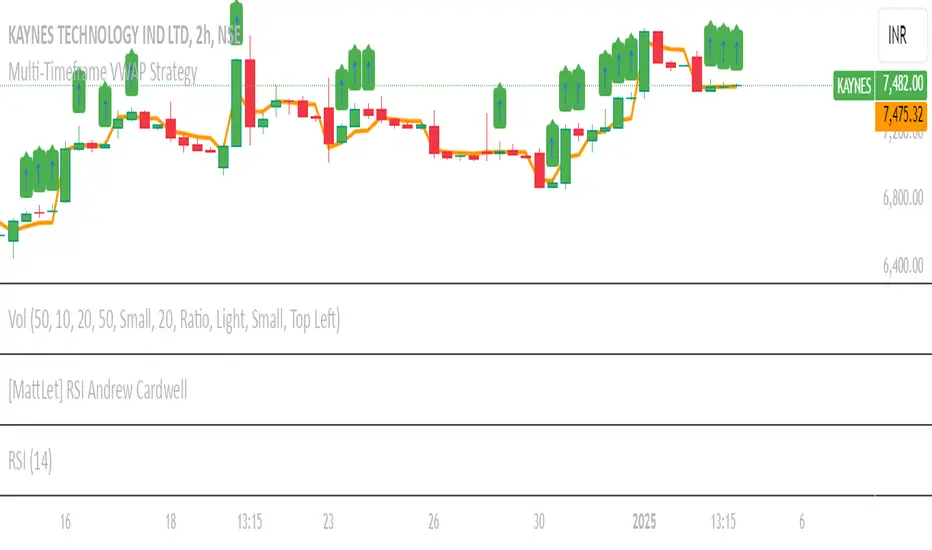
Multi-Timeframe VWAP Strategy [JARUTIR]Multi-Timeframe VWAP with Price Above VWAP Marker
This indicator allows you to view the Volume-Weighted Average Price (VWAP) across multiple timeframes on a single chart. The VWAP is a popular technical analysis tool used by traders to determine the average price of an asset weighted by volume. It helps identify the overall market trend and is especially useful for intraday trading.
Key Features :
Multiple Timeframes: Choose from 1-minute, 5-minute, 15-minute, 30-minute, 1-hour, and 1-day VWAPs. You can enable or disable the VWAP for any timeframe based on your preference.
Customizable: Easily toggle on/off the VWAP for each timeframe via checkboxes in the settings.
Price Above VWAP Marker: A clear green up arrow is displayed above the price bar whenever the price is above the current VWAP, helping you quickly spot potential bullish signals.
Flexible & Easy to Use: Adjust the settings for any timeframe and see the VWAPs on your chart without clutter. Whether you are trading in the short term or analyzing longer-term trends, this tool provides you with the flexibility you need.
How to Use :
VWAP as Trend Indicator: The VWAP is commonly used to identify whether the price is trending above or below the average price for the session. Price above the VWAP generally signals bullish momentum, while price below the VWAP can indicate bearish pressure.
Price Above VWAP Marker: The green up arrow is your signal for when the price is above the VWAP, which can be used as a potential entry point for long trades.
Customize Timeframes: Whether you're focusing on ultra-short-term movements (like 1-min or 5-min) or need a broader view (like 1-hour or 1-day), this indicator lets you tailor the analysis to your preferred time horizon.
Ideal For :
Intraday Traders looking for quick signals on different timeframes.
Swing Traders who want to track the overall market trend with multiple VWAP levels.
Scalpers needing to monitor fast price movements alongside volume-weighted averages
Auto Anchored VWAPs for FuturesAbout the Script
This indicator automatically plots five anchored VWAPs based on predefined starting times, offering traders key reference points across multiple timeframes. These starting points are hardcoded and cannot be customized, ensuring consistency across all time zones. Below are the anchored VWAPs and their respective starting times:
NY Session: Starts daily at 9:30 AM EST
Globex: Starts daily at 6:00 PM EST
Weekly: Resets every Sunday at 6:00 PM EST
Monthly: Anchored to the first session of the month at 6:00 PM EST
Yearly: Anchored to the first session of the year at 6:00 PM EST
How to Use the Script
1) Add the script to your chart.
2) Select the appropriate Daylight Savings Time format.
3) Customize the visual appearance to your preference.
4) Click "OK" to apply the changes.
Once configured, the VWAP levels will automatically adjust based on the predefined timeframes.
How the Script Works
The script calculates and plots anchored VWAPs at the predefined starting times listed above. As each session, week, month, and year progresses, the corresponding VWAP is recalculated and updated on the chart, providing traders with dynamic insights into market trends and volume-weighted price action.

Multi VWAPThe Multi-VWAP Indicator is a versatile tool designed to plot up to three Volume Weighted Average Price (VWAP) lines simultaneously, each anchored to a user-defined period. This indicator provides traders with a comprehensive view of price action across multiple timeframes, making it ideal for analyzing trends, support, and resistance levels.
Key Features:
Multiple Anchoring Options:
Each VWAP can be independently anchored to one of the following periods:
Session: Resets at the start of each trading day.
Week: Resets at the start of each week.
Month: Resets at the start of each month.
Quarter: Resets at the start of each quarter.
Year: Resets at the start of each year.
User Customization:
Choose the anchoring period for each VWAP line via dropdown menus.
Assign distinct colors to each VWAP for better visual differentiation.
Dynamic Price Source:
The VWAP calculation is based on the average price (hlc3) by default but can be modified by the user to use other price inputs.
Clear Visualization:
Displays three separate VWAP lines simultaneously, helping traders identify confluences or divergences in price action across timeframes.
Use Cases:
Intraday Trading: Use session-anchored VWAP to track intraday trends and mean reversion points.
Swing Trading: Combine weekly and monthly VWAPs to identify longer-term support and resistance levels.
Multi-Timeframe Analysis: Visualize how price interacts with VWAPs from different periods to spot key zones of interest.
This indicator is a powerful tool for traders who want to incorporate VWAP into their strategies while maintaining flexibility to adapt to various market conditions.

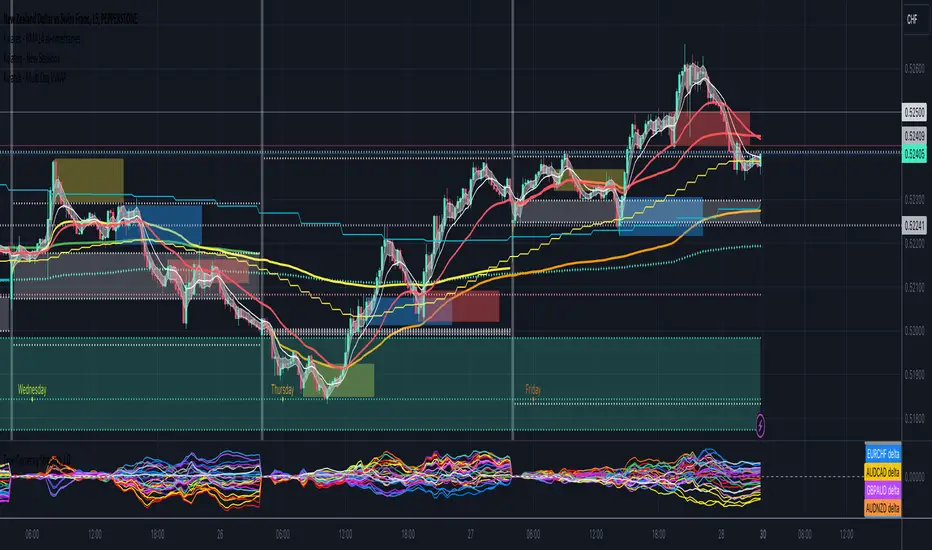
Heatmap VWAP Forex v1This is an indicator for those subscribed to the Crash Course Trading Programme. It shows where the VWAP is in relation to current price action.
It is recommended you open this heat map using the TV trading view desktop and display it on one tab. It is also recommended you keep it on the EURUSD tab.
For all currency pairs it picks up the price action and volume from OANDA so you dont have to scan these charts looking for trades. It is strongly recommended you use OANDA as this has volume within the signal which is necessary to calculate the VWAP.
It covers the following forex pairs and these are in each column designated by the corresponding two letter abbreviation:
CLMN
1. EU – EURUSD
2. EG – EURGBP
3. EC – EURCHF
4. GU – GBPUSD
5. AU – AUDUSD
6. UJ – USDJPY
7. UC – USDCHF
8. AJ – AUDJPY
9. UL – USDCAD – L stands for Loonie
10. NU – NZDUSD
11. GJ – GBPJPY
12. EA – EURAUD
13. AL – AUDCAD – L stands for Loonie
Price action is at the VWAP when the column cell is bellow as indicated by the yellow box on the left hand side of the heatmap.
If the cell is red, it means that price action is below the VWAP.
If the cell is green, it means that the price is above the VWAP.
The higher it is above or below the VWAP it shows the box being higher or lower than the yellow row and is indicated by +/- Standard Deviation on the left hand side.
The aspects we are looking for are:
1. A gradient.
2. A pullback after price action has passed through the vwap.
3. You need a good reversal bar such as a engulfing / pinbar or high/low test bar or traintracks or day/morning star. These are some examples and you are not limited to just these. If you need help with candlesticks please get in touch and we will cover this to ensure you know what types of candlesticks you are looking for.
4. Look for confirmation with Stochastic RSI 3, 3, 9, 21 or Stoch 5,3,3 or what you like in this regard. It is a momentum indicator and overbought and undersold does apply to it. It indicates the energy that price action has, not necessarily zones where you can sell or buy.
5. Divergence. Again, if you do not fully understand this topic get in touch and we can go through this.
Remember, WITHOUT a gradient you have no trade. If there is no trade there today, that is fine, there is no desperate need to trade straight away.
Please add any comments to how useful you find this or if you would like improvements and I will see what I can do.

Anchored VWAP Pro - Multi-Timeframe Analysis ToolProfessional anchored VWAP indicator featuring multiple key anchor points for comprehensive price analysis. Displays volume-weighted average prices from critical market moments including NY market open, daily highs/lows, session start, and previous day reference levels.
Key Features:
NY Open VWAP (9:30 AM ET anchor)
High of Day (HOD) and Low of Day (LOD) VWAPs with dynamic anchoring
Start-of-Day VWAP (18:00 ET session anchor)
Previous Day VWAP for reference and support/resistance analysis
Customizable line colors, widths, and styles (solid/dashed/dotted)
Clean visibility controls for each VWAP line
Optimized for forex and futures markets with proper session timing
Historical line preservation with configurable display periods
Usage:
Ideal for identifying key support/resistance levels, mean reversion opportunities, and institutional price levels. The multiple anchor points provide context for both intraday and swing trading strategies.
Settings:
Full customization of visibility, colors, line weights, and styles through organized input groups. Toggle individual VWAPs on/off based on your trading strategy requirements.
Market Application:
Designed for 24-hour markets including forex, indices, and commodities. Particularly effective on major currency pairs and index futures during active trading sessions.

PM RTH AH VWAPs [vnhilton]FOR STOCKS ONLY.
Simply 3 different VWAPs for the pre-market, regular trading session, and the after hours, using session.is_ variables (not sure if they were recently added. Regardless, it would be nice to have a session.isfirstbar_postmarket variable to avoid having to write the code for calculating VWAP instead of simply using a ta.vwap function). Treats all 3 sections of the day as separate sessions with their own characteristics i.e. differing levels of liquidity and market dynamics. I would argue this is better than just using a VWAP calculated from the pre-market open until after hours close, as it would make using the VWAPs as a benchmark more accurate when taking trades at these different periods of the day.
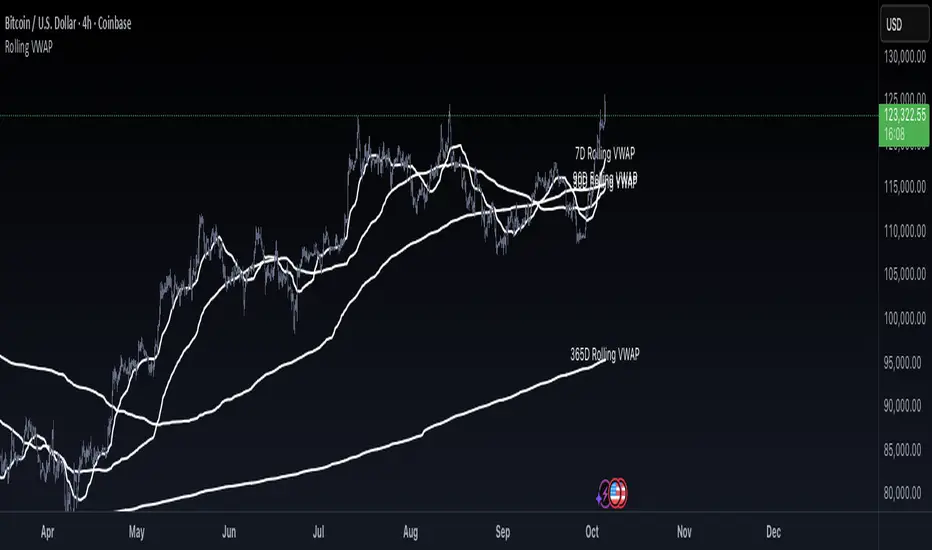
Rolling VWAP by VibieRolling VWAP
🧠 Concept
Rolling VWAP is a continuously updating VWAP that doesn’t reset at fixed anchors like daily or weekly VWAP.
Instead, it applies VWAP calculation to a moving window of recent bars, making it more adaptive and responsive to current market conditions.
⸻
⚙️ How It Works
1. VWAP Formula
• VWAP = Σ(price × volume) ÷ Σ(volume) over a rolling lookback period.
2. Rolling Window
• The indicator calculates VWAP only for the last N bars (e.g., 50).
• As each new bar appears, the oldest drops out, creating a continuously updated VWAP line.
3. Real-Time Adjustment
• Rolling VWAP constantly shifts with new data, tracking short-term fair value as market conditions evolve.
⸻
🧭 How to Use
• Intraday trading → use short rolling windows (20–50 bars) for scalping and mean reversion setups.
• Swing trading → use longer windows (e.g., 10 days) to track medium-term fair value.
• Rolling VWAP acts as dynamic support/resistance and can serve as a trend filter.
⸻
🌟 Why It’s Original and Useful
• Reacts faster to volume changes than anchored VWAP.
• Continuously represents short-term fair price without session resets.
• Excellent for adaptive strategies in volatile markets.
• Particularly valuable for active day traders.
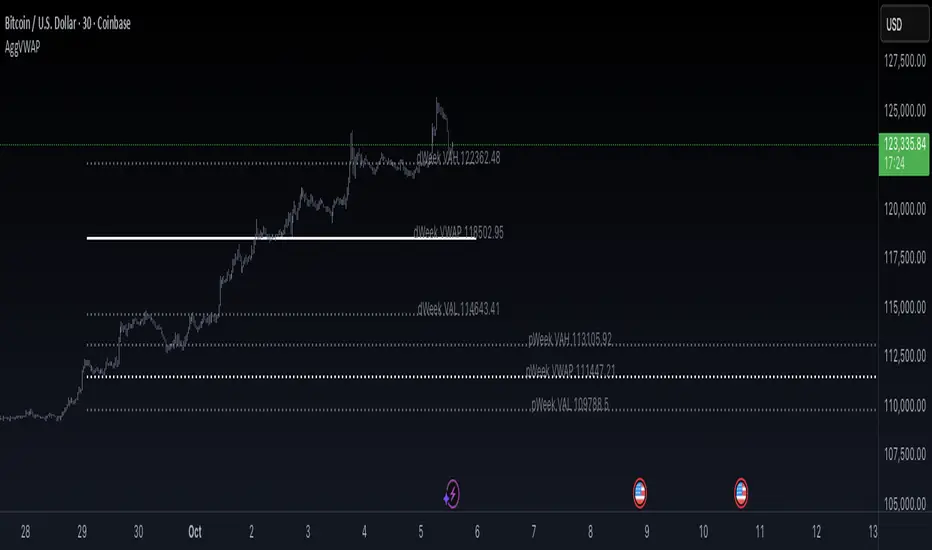
Aggregated VWAP by VibieAggregated VWAP (Professional Layout)
🧠 Concept
VWAP (Volume Weighted Average Price) is a widely used institutional benchmark for fair price.
This indicator enhances standard VWAP by aggregating multiple exchanges, adding standard deviation bands, and offering two visualization modes (bands or lines), providing a professional-grade VWAP analysis tool.
⸻
⚙️ How It Works
1. VWAP Calculation
• VWAP = Σ(price × volume) ÷ Σ(volume), using hlc3 as price reference.
• The indicator supports multiple anchor periods: Daily, Weekly, Monthly, Quarterly, and Yearly.
2. Exchange Aggregation
• VWAP values are aggregated from Binance, Bybit, and Coinbase to compute a market-wide VWAP.
• This prevents bias from a single exchange.
3. Standard Deviation Bands
• Plots ±1σ, ±2σ, ±3σ, ±4σ bands around VWAP.
• These show statistical extremes relative to fair value and act as dynamic overbought/oversold zones.
4. Display Modes
• Bands Mode → continuous VWAP and deviation bands.
• Lines Mode → plots VWAP and deviation levels as fixed horizontal lines for each completed period (e.g., pWeek VAL, dMonth VWAP).
⸻
🧭 How to Use
• VWAP levels act as dynamic support/resistance.
• Deviation bands highlight statistically stretched price areas.
• Previous period VWAP levels (e.g., pWeek, pMonth) often act as institutional reference points.
• Ideal for both swing and intraday trading strategies.
⸻
🌟 Why It’s Original and Useful
• Uses aggregated data for more reliable VWAP calculations.
• Integrates standard deviations, period anchoring, and labeling into one tool.
• Professional layout mirrors institutional analysis techniques.
• Extremely versatile for trend following, mean reversion, and breakout systems.
Kviatek - Multi Day VWAPThis indicator plots VWAPs anchored to each day of the week.
VWAPs are considered "fair price" for both sellers and buyers and it's often times where the liquidity is found.
From my trading I noticed how often times price likes to come back to the daily VWAP from the previous week, especially at the beginning and end of each week.
For example, if we enter a long on Friday, last Friday's VWAP tends to act as a target for the price.
Another use for it is to get an understanding of how the trend develops throughout the week.
If the following day's VWAP is above the previous day's VWAP - we have a trend continuation.
D/W/M VWAPsPlot Daily, Weekly and Monthly VWAPs
Preferences:
- Enable/Disable Daily, Weekly or Monthly VWAPs
- Color
- Hide in own Time Frame (i.e. Daily VWAP is hidden on 1D TF and above)

ATR from VWAP📌 ATRs from VWAP – Intraday Volatility Tracker
This script measures how far price is from VWAP in ATR units, helping traders assess short-term overextension and reversion potential.
🔹 Key Features:
✅ ATR Distance from VWAP – Calculates how many ATRs the price is from the VWAP.
✅ Dynamic Table Display – Shows ATR distance in real-time for quick decision-making.
✅ Intraday Focus – Designed for scalpers and day traders using minutes or hourly timeframes.
📊 How to Use:
Look for price moving away from VWAP to identify extended moves.
Use as a reversion signal when price deviates too far from VWAP.

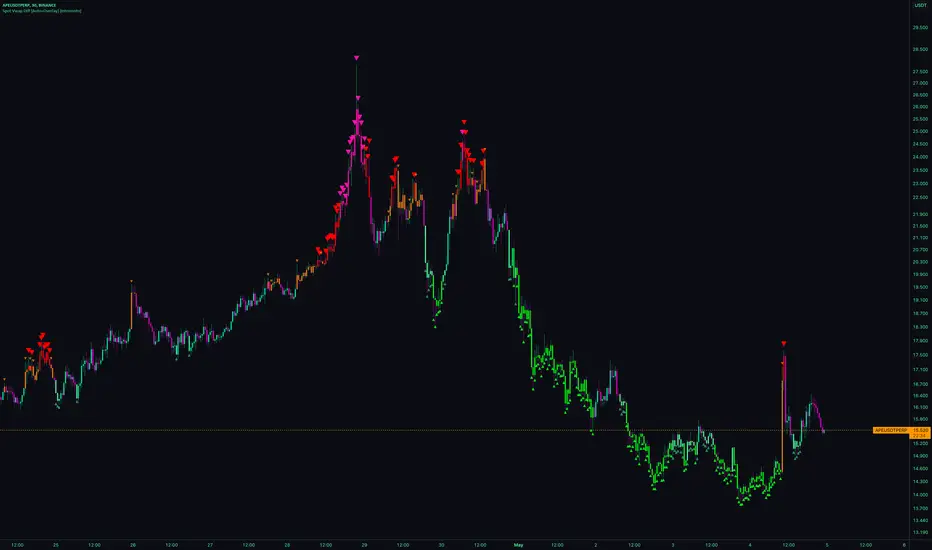
Spot Vwap Diff [Auto+Overlay] [Intromoto]This script shows the percent difference from price, or in percent terms how far away price is from it.
Roughly, the further price goes away from the vwap, the more likely it is to revert.
This script only runs properly on Binance perpetual charts, and auto updates to the SPOT, underlying asset, difference between price and the vwap. The vwap has a resolution option to change the timeframe of the Vwap.
IMPORTANT: If you are not on a Binance perpetual chart, this script will reference the VWAP difference to price on Binance:BTCUSDT.
If you're using this on a recently listed coin, there's a chance I haven't updated the script. Check accordingly.
Settings include bracketing for color reference. High time frame VWAP resolution will cause the colors to go extreme, since price can move further away on high time frames.
I'm hoping to update this script to account for normal uses on high time frame settings.
Plotshapes and respective lines plotted have style and size settings.
DM for access.
Thanks
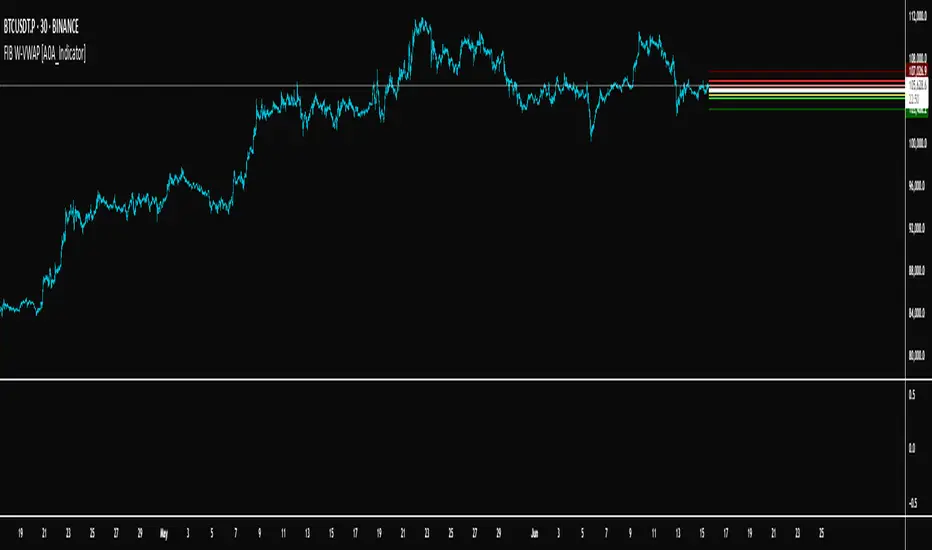
FIB W-VWAP [A0A_Indicator]FIB W-VWAP is an advanced weekly anchored VWAP indicator that leverages Fibonacci-based deviation bands and a custom price source for improved market relevance.
Key Features:
Weekly Anchored VWAP: Resets automatically at the Friday NYSE close, providing a rolling weekly anchor that aligns with professional trading practice.
Fibonacci Deviation Levels: Plots multiple deviation bands around the VWAP, calculated using fixed Fibonacci-inspired multipliers for both positive and negative directions. These serve as key support and resistance zones for mean reversion or trend continuation strategies.
Dynamic Standard Deviation: Each band is based on the live, rolling standard deviation of price within the current weekly session, adapting in real time to changing volatility.
Unique Hybrid Price Source:
VWAP and deviation bands are calculated using a custom price formula:
hidden
This approach gives extra weight to the closing price while still considering intrabar extremes, resulting in a smoother and more robust anchor compared to classic VWAP formulas (such as typical price or close-only).
Visual Enhancements:
Distinct color fills and lines for each band
Configurable transparency and labels
Clearly marked VWAP and all deviation levels, labeled with their corresponding Fibonacci levels
Adaptable for Discretionary and Systematic Trading:
Useful for identifying mean reversion trades, breakouts, and overextended moves during the trading week.
How it works:
At each new weekly session (NY close on Friday), the VWAP and its standard deviation reset.
The script continuously updates cumulative price × volume, cumulative volume, and cumulative price² × volume to maintain accurate VWAP and standard deviation calculations.
Each deviation band is plotted as a multiple of the weekly standard deviation above and below the VWAP, using fixed Fibonacci coefficients.
Labels and horizontal lines extend into the future for clear, actionable visual reference.
Why use this version?
This indicator offers greater precision in turbulent markets, robust support/resistance mapping, and is especially effective for traders seeking a more nuanced, statistically informed view of weekly price structure. The hybrid source makes it more reliable during volatility spikes than classic VWAP methods.
Ready for all timeframes and asset classes—especially powerful for intraday and swing traders working with weekly cycles.
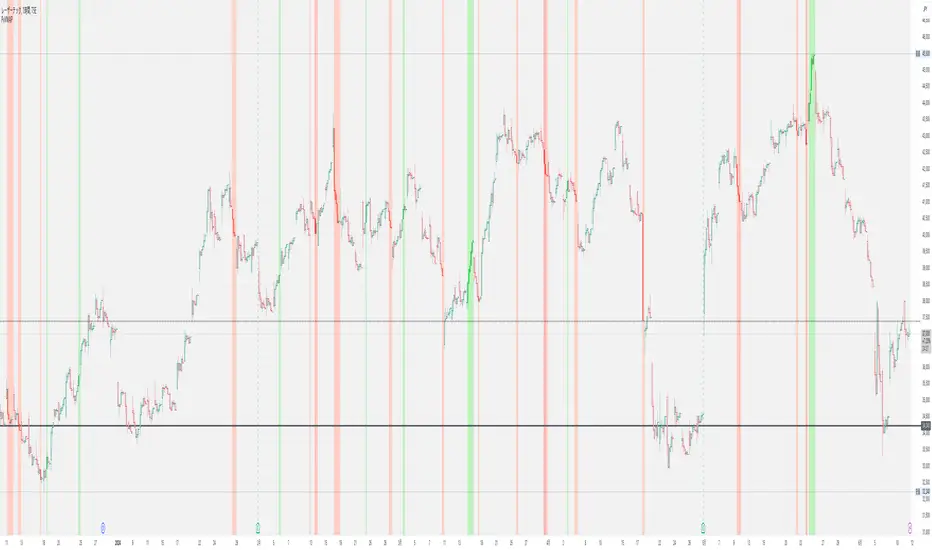
VWAPv6The VWAP ( Volume Weighted Average Price ) Deviation script is a powerful tool designed for traders to analyze the relationship between price and volume . By calculating deviations around the VWAP , the script allows users to identify key support and resistance levels that can help in making better-informed trading decisions.
The script calculates VWAP based on the chosen data source (default is closing price) and then computes deviations above and below the VWAP using either the Average Deviation or the Standard Deviation method. The user can select the desired method through the script's input options. These deviations are then plotted as bands on the chart, providing a visual representation of the areas where the price may potentially revert or experience a breakout.
A unique and valuable feature of this script is the addition of a monitor that counts the number of times the price crosses above the Upper Deviation level 2 and below the Lower Deviation level 2 within a user-defined lookback period. This monitor is displayed as a table in the bottom right corner of the chart and can be enabled or disabled through an input option.
The cross count monitor serves as a valuable aid to traders by providing insights into the historical frequency of price crossing the deviation levels. This information can be used to identify potential trading opportunities based on historical price behavior around these levels.

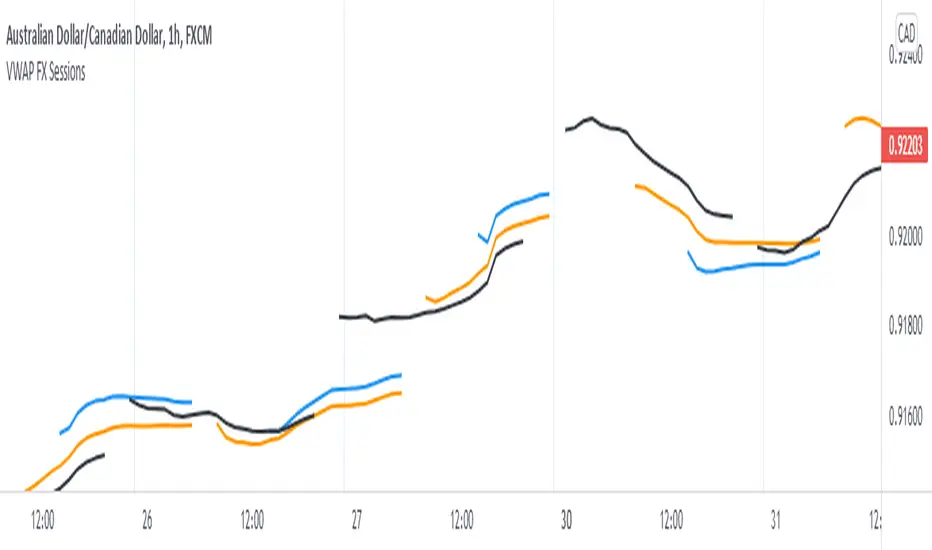
Triple VWAP for FOREX SessionsThis script runs on my previous script Masterwork VWAP .
►It uses regular built-in VWAP improved to avoid weird connecting of the line with its yesterday's value.
►It starts a new VWAP when London session opens . You can select to end it next morning or when the session is about to close.
►It starts a new VWAP when New York session opens . You can select to end it next morning or when the session is about to close.
►You can select intelligent_enabler function to plot the VWAPs on your chart when viewing low timeframe charts (1m, 5m, 15m, 30m)
Price vs VWAP PerformancePrice vs VWAP Performance (PvVWAP)
This indicator visually displays the deviation between the current price and VWAP (Volume Weighted Average Price), helping you to determine the strength of a trend.
How it Works
VWAP Calculation: Calculates the Volume Weighted Average Price (VWAP) over a specified period.
Standard Deviation Calculation: Calculates the standard deviation of closing prices over the past 20 periods.
Deviation Calculation: Calculates the difference between the current price and VWAP, expressed as a multiple of the standard deviation.
Color Assignment: Changes the color of bars and background based on the magnitude of the deviation.
Green: Very strong uptrend
Light Green: Strong uptrend
Light Gray: No trend
Pinkish Red: Weak downtrend
Red: Very strong downtrend
How to Use
Trend Strength Assessment:
The greater the deviation of the price from VWAP, the stronger the trend is considered to be.
The color of the bars and background provides a visual indication of trend strength.
Entry/Exit Point Reference:
You can enter/exit by aiming for the movement of the price returning to VWAP after a large deviation from VWAP.
Notes
Parameter Settings:
The standard deviation period is 20 periods by default, but can be adjusted as needed.
Avoid Using Alone:
It is recommended to use this indicator in combination with other technical indicators.
Session VWAPsThis indicator plots volume-weighted average price (VWAP) lines for three major trading sessions: Tokyo, London, and New York. Each VWAP resets at the start of its session and tracks the average price weighted by volume during that window. You can choose the exact session times, turn individual sessions on or off, and optionally extend each VWAP line until the end of the trading day.
It’s designed to give you a clear view of how price is behaving relative to session-specific value areas. This can help in identifying session overlaps, shifts in price control, or whether price is holding above or below a particular session’s average. The indicator supports futures-style day rollovers and works across markets.