Multi-VWAP System🚀 Multi-VWAP System — Anchored VWAP & Deviation Bands
Overview
The Multi-VWAP System provides traders with a professional-grade approach to anchored VWAP analysis. Inspired by Brian Shannon's pioneering work on Anchored VWAP, this indicator automatically calculates and plots:
Current Session VWAP
Previous Session VWAP (also known as "2-Day VWAP")
High-of-Day (HOD) Anchored VWAP
Each VWAP can also display optional Standard Deviation Bands to highlight statistically significant deviations from the volume-weighted average price.
🔍 Why Anchored VWAP Matters
Volume Weighted Average Price (VWAP) is among the most critical institutional indicators, as it represents the average price paid for a stock adjusted by trading volume. This makes VWAP crucial for identifying fair value and significant areas of institutional activity.
Institutions utilize VWAP extensively to guide their execution algorithms. For instance, if price dips below a 2-day anchored VWAP (anchored to the previous session's open), many institutions interpret this as a discounted entry, potentially triggering large-scale buy programs. Conversely, sustained movement above VWAP signals strong buying pressure and bullish sentiment.
📌 Why Multiple Anchors?
Traders commonly anchor VWAPs at critical reference points:
Current Session VWAP:
Essential for day traders as a reference for intraday sentiment. Price action above this line generally indicates bullish sentiment, while price below signals bearish sentiment.
Previous Session (2-Day) VWAP:
Heavily used by institutions and swing traders, it provides insight into multi-session sentiment. Institutions commonly activate buy or sell programs based on whether price is trading at a premium or discount relative to this VWAP.
High-of-Day (HOD) VWAP:
Frequently used by momentum traders, this anchor captures sentiment after the most recent intraday high. Price above the HOD VWAP suggests sustained bullish momentum, while price below might signal weakening momentum.
🌟 Standard Deviation Bands
Each anchored VWAP in this indicator includes optional Standard Deviation Bands, highlighting statistical extremes. Traders use these bands to:
Identify potentially overextended moves (beyond +2σ or +3σ).
Gauge momentum strength (holding above +1σ).
Spot mean-reversion setups when price returns to VWAP after extreme moves.
🎨 Dynamic Background and Momentum Colorization
To visually highlight strength or weakness in price action relative to VWAP:
Dynamic Background Fill between Current and Previous VWAPs:
Green background appears when the Current VWAP is above the Previous VWAP and the linear regression slope (adjustable length) is positive, indicating bullish sentiment.
Red background appears when the Current VWAP is below the Previous VWAP and the slope is negative, indicating bearish sentiment.
No fill when conditions are mixed or momentum is uncertain.
Gold Fill above HOD VWAP:
When price action is above the High-of-Day VWAP and momentum (linear regression slope) is positive, a subtle gold shading appears, quickly highlighting bullish momentum.
⚙ Fully Customizable Settings
Session Times: Adjust session start and end times to match your specific market hours.
Standard Deviation Bands: Enable or disable each VWAP’s deviation bands individually and select how many bands (1σ, 2σ, or 3σ) you'd like to display.
Momentum Slope Length: Adjustable lookback for linear regression slope calculation—giving you full control of trend sensitivity.
🎯 Who Should Use This Indicator?
This indicator is perfect for:
Day Traders who want quick insights into intraday sentiment shifts.
Swing Traders tracking institutional footprints and seeking optimal entry/exit points.
Momentum Traders who rely on clearly visible momentum signals from HOD anchored VWAPs.
Institutional Traders and Professionals seeking sophisticated, institutionally-inspired VWAP analysis without manual anchoring.
📈 Summary of Features
✅ Automatic VWAP Anchors (Current Session, Previous Session, High-of-Day)
✅ Optional Standard Deviation Bands for each VWAP anchor
✅ Dynamic Background Coloring based on price action and momentum conditions
✅ Gold Momentum Highlight for quick bullish momentum identification above HOD VWAP
✅ Fully Customizable Inputs for precise personalization and flexibility
📢 Conclusion
The Multi-VWAP System isn't just another VWAP indicator. It's an institutional-level, dynamic, multi-dimensional analysis tool inspired by the work of Brian Shannon and leading institutional traders. It takes the guesswork out of anchoring and analysis, leaving you free to focus on identifying and executing high-probability trade setups.
Enjoy trading smarter—not harder. Happy Trading! 🚀📊
Search in scripts for "VWAP"

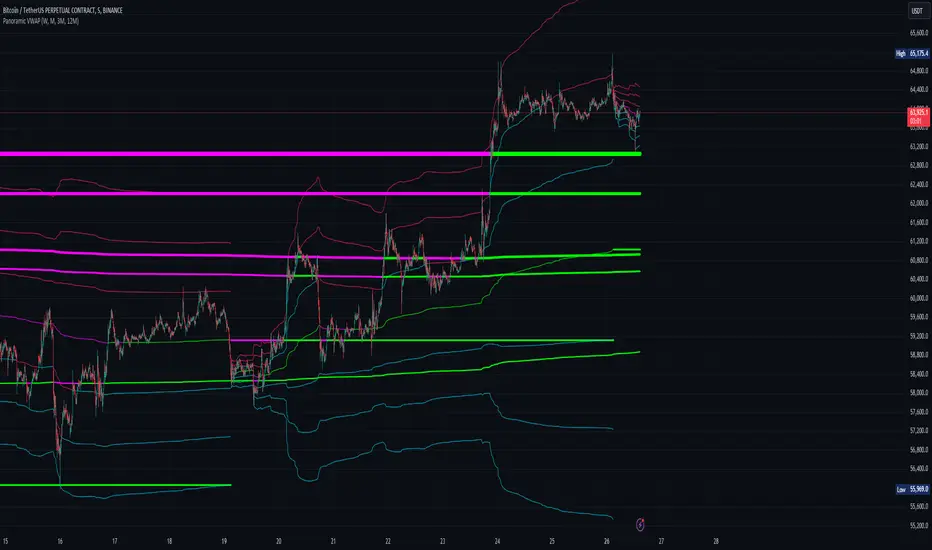
Panoramic VWAP### Panoramic VWAP Indicator Overview
The Panoramic VWAP indicator provides a way to display up to four Volume Weighted Average Price (VWAP) lines on a chart, each anchored to different timeframes. This indicator also includes options for displaying standard deviation bands and close lines, offering a comprehensive view of price action across multiple time horizons.
### Key Features
Quad VWAPs : The indicator allows for the display of four VWAP lines simultaneously. Each line can be set to a different timeframe, enabling traders to analyze market conditions across various periods on a single chart.
Standard Deviation Bands : Users can enable bands around each VWAP line, which represent standard deviations or percentage levels from the VWAP. These bands help in assessing volatility and identifying potential overbought or oversold conditions.
Close Lines : The indicator includes an option to show close lines, marking the price's closing level relative to the VWAP. This feature is useful for examining how the market closes in relation to VWAP, which can be important for understanding trend strength or potential reversals.
### How It Looks
VWAP Lines : Multiple VWAP lines are displayed, each reflecting different timeframes. The lines change color depending on whether the price is above or below the VWAP, indicating bullish or bearish momentum.
Bands : Optional bands around the VWAP lines provide a visual indication of volatility, with the potential to identify overbought or oversold areas.
Close Lines : These lines represent the price's closing level relative to the VWAP and can be displayed to add further context to the analysis.
### How to Use It
Trend Analysis :
- Price above a VWAP line indicates bullish momentum .
- Price below a VWAP line suggests bearish momentum .
Support and Resistance :
- VWAP lines often act as dynamic support and resistance. Price approaching a VWAP line from above may find support, while approaching from below may encounter resistance.
Volatility Assessment :
- Bands around the VWAP lines can signal areas of potential reversal. Upper bands may indicate overbought conditions, while lower bands may indicate oversold conditions.
Multiple Timeframe Analysis :
- The ability to display VWAPs from different timeframes simultaneously allows for the identification of confluence zones, where multiple VWAP levels align, indicating potentially significant support or resistance levels.
Customization :
- The indicator settings are customizable, allowing users to choose which VWAP lines, bands, and close lines to display, along with adjustments for visual preferences like line thickness and colors.
### Practical Application
Intraday Trading : Traders can use the VWAPs and bands to identify potential entry and exit points during the trading day based on price interactions with these levels.
Swing Trading : Monitoring VWAP lines across different timeframes can help identify key levels where price might reverse or gain momentum, aiding in decisions about holding or exiting positions.
Long-Term Analysis : VWAP lines on higher timeframes can serve as dynamic support or resistance levels, providing context for long-term trend analysis and investment decisions.
The Panoramic VWAP indicator allows for a detailed analysis of price trends and levels across multiple timeframes, combining VWAPs, standard deviation bands, and close lines in a single, customizable tool.
VWAP Multi-TimeframeThis is a multi-timeframe VWAP indicator that provides volume weighted average price calculations for the following time periods:
15min
30min
1H
2H
4H
6H
8H
12H
1D
1W
1M
3M
6M
1Y
You can use the lower timeframes for short term trend control areas and use the longer timeframes for long term trend control areas. Trade in the direction of the trend and watch for price reactions that you can trade when price gets close to or touches any of these levels.
This indicator will provide a data plot value of 1 for bullish when price is above all VWAPs that are turned on, -1 for bearish when price is below all VWAPs that are turned on and 0 for neutral when price is not above or below all VWAPs. Use this 1, -1, 0 value as a filter on your signal generating indicators so that you can prevent signals from coming in unless they are in the same direction as the VWAP trend.
Features
Trend direction value of 1, -1 or 0 to send to external indicators so you can filter your signal generating indicators using the VWAP trend.
Trend table that shows you whether price is above or below all of the major VWAPs. This includes the daily, weekly, monthly and yearly VWAPs.
Trend coloring between each VWAP and the close price of each candle so you can easily identify the trend direction.
Customization
Set the source value to use for all of the VWAP calculations. The default is HLC3.
Turn on or off each VWAP.
Change the color of each VWAP line.
Change the thickness of each VWAP line.
Turn on or off labels for each VWAP or turn all labels on or off at once.
Change the offset length from the current bar to the label text.
Change the label text color.
Turn on or off trend coloring for each VWAP.
Change the color for up trends and down trends.
Turn on or off the trend direction display table.
Change the location of the trend direction display table.
Adjust the background and text colors on the trend direction display table.
How To Use The Trend Direction Filtering Feature
The indicator will provide a data plot value of 1 for bullish when price is above all of the VWAPs that are turned on, a value of -1 for bearish when price is below all of the VWAPS that are turned on and a value of 0 for neutral when price is above and below some of the VWAPs that are turned on.
The name of the value to use with your external indicators will show up as: VWAP Multi-Timeframe: Trend Direction To Send To External Indicators
Make sure to use that as your source on your external indicators to get the correct values.
This 1, -1 or 0 value can then be used by another external indicator to tell the indicator what is allowed to do. For instance if you have another indicator that provides buy and sell signals, you can use this trend direction value to prevent your other indicator from giving a sell signal when the VWAP trend is bullish or prevent your other indicator from giving a buy signal when the VWAP trend is bearish.
You will need to program your other indicators to use this trend filtering feature, but this indicator is already set up with this filtering code so you can use it with any other indicator that you choose to filter(if you know how to customize pine script).
Markets You Can Use This Indicator On
This indicator uses volume and price to calculate values, so it will work on any chart that provides volume and price data.

VWAP Suite {Phanchai}VWAP Suite {Phanchai}
Compact, readable, TradingView-friendly.
What is VWAP?
The Volume Weighted Average Price (VWAP) is the average price of a period weighted by traded volume. It’s used as a fair-value reference (mean) and resets at the start of each new period.
Included VWAP Modes
Session — resets each trading day (current session).
Week / Month / Quarter / Year — current calendar periods.
Anchored Week / Month / Quarter / Year — starts at the beginning of the previous completed period.
Rolling 7D / 30D / 90D — rolling windows: today + last 6/29/89 daily sessions.
Important
This suite does not generate buy/sell signals. It provides structure and confluence; decisions remain yours.
Use Cases
Identify fair-value zones / mean-reversion areas.
Plan TP / SL around periodic VWAPs.
Define DCA levels (e.g., anchored to prior week/month).
Gauge trend bias via VWAP slope and reactions.
How to Use
Inputs → VWAP 1..5: Choose the period per slot (Session, Anchored, Rolling, etc.) and toggle Show .
Sources: Select the price source for all VWAPs (default: HLC3).
Global: Line offset (bars) shifts plots visually (does not affect calculations).
Style tab: Adjust per-line colors, thickness, and line style.
Alerts
Price crosses a VWAP (per slot).
VWAP slope turns UP or DOWN (per slot).
Tips & Notes
Volume required: Poor/absent volume (e.g., some FX tickers) can degrade accuracy.
Anchored modes: Start at the prior period’s open; values appear only after that timestamp.
Rolling modes: Use completed daily sessions (including today).
Clutter control: If labels crowd, increase Line offset or hide unneeded slots.
Confluence: Combine with market structure, liquidity zones, or momentum filters for stronger context.
Built for clear VWAP workflows. Trade safe!

Session VWAPs [cryptalent]This indicator provides a more granular and timely analysis of market structure compared to traditional daily Volume Weighted Average Price (VWAP). It splits the 24-hour trading day into four distinct, customizable sessions (T1, T2, T3, T4), calculating an independent Session VWAP and Standard Deviation Bands for each segment.
🌟 Key Features and Functionality
1. Segmented VWAP Calculation
Purpose: To track the true Volume Weighted Average Price (Fair Value) specific to the participants and trading activities within different global market sessions (e.g., Asian, European, US sessions).
Design: By default, the 24 hours (based on UTC time) are divided into T1 (00:00-06:00), T2 (06:00-12:00), T3 (12:00-20:00), and T4 (20:00-00:00).
Mechanism: The VWAP calculation resets at the start of each designated session, offering a clearer, segment-specific view of market consensus and volume absorption.
2. Standard Deviation Bands
Calculation: Each Session VWAP line is accompanied by upper and lower standard deviation bands.
Control: The width of these bands is controlled by the user input "Band Multiplier" (default is 1.0, representing one standard deviation).
Application: These bands measure the Volume-Weighted Volatility and define the expected "normal" trading range for the current session.
- Price within the bands suggests consolidation or a normal auction process.
- Price breaking out of the bands indicates strong directional momentum or an extreme/overbought/oversold condition for that specific session.
3. High Customization (User Inputs)
Session Timing: All four session start and end times (in UTC) are customizable, allowing traders to align the indicator with specific market hours or individual trading strategies.
Price Source: The source price used for the VWAP calculation is selectable (default is close).
💡 Trading Applications
1. Fair Value Identification: The VWAP line serves as the "Fair Value" or "Volume-Weighted Consensus Cost" for the active session.
Price above VWAP: Buyers are in control during that session.
Price below VWAP: Sellers are in control during that session.
2. Dynamic Support & Resistance: Both the VWAP and the Standard Deviation Bands often act as reliable dynamic support and resistance levels.
3. Volatility Assessment: The width of the bands reflects the volume-weighted volatility of the current session. Narrow bands suggest range-bound trading; wide bands imply strong directional activity.
4. Trend Strength: Sustained price action outside of the standard deviation bands is a key measure of the strength and commitment behind a current trend.

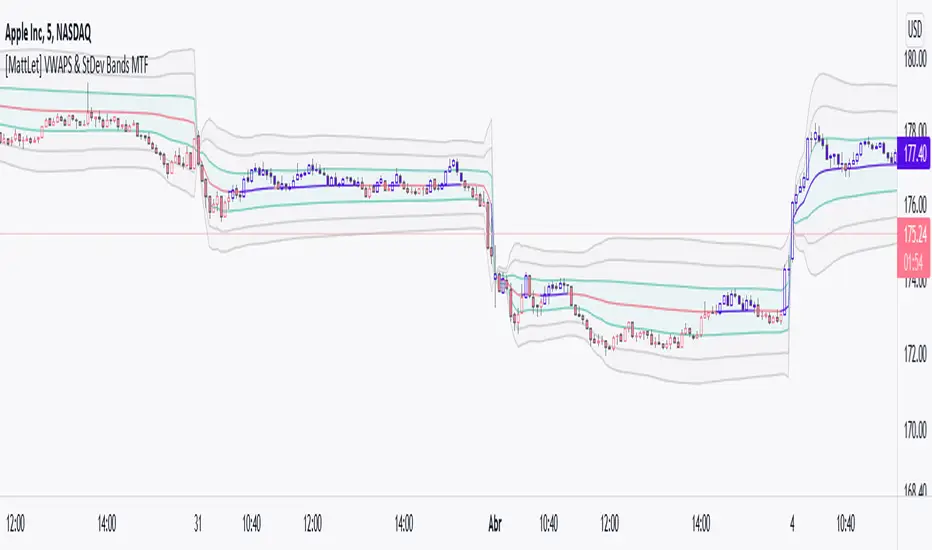
[MattLet] VWAPS + Standard Deviation Bands MTFVWAP is the volume-weighted average price for a futures contract plotted as a line on the price chart. The calculation is the sum of traded volume, multiplied by the price, divided by the sum of the traded volume.
This study has a number of uses. It provides the current volume-weighted average price for the trading day or the trading session.
I have added Standard Deviation Bands to the VWAP indicator. This indicator has three upper and three lower bands. The Standard Deviation Factor of these bands can be set in the parameters.
Features:
1 - VWAPS Multi Timeframe
2 - Standard Deviations Bands Multi Timeframe
3 - Colored candles/bars on "Daily Vwap" crossing up and down.
4 - Every elements styles edition.
Multi-Timeframe Anchored VWAP Valuation# Multi-Timeframe Anchored VWAP Valuation
## Overview
This indicator provides a unique perspective on potential price valuation by comparing the current price to the Volume Weighted Average Price (VWAP) anchored to the start of multiple timeframes: Weekly, Monthly, Quarterly, and Yearly. It synthesizes these comparisons into a single oscillator value, helping traders gauge if the current price is potentially extended relative to significant volume-weighted levels.
## Core Concept & Calculation
1. **Anchored VWAP:** The script calculates the VWAP separately for the current Week, Month, Quarter (3 Months), and Year (12 Months), starting the calculation from the first bar of each period.
2. **Price Deviation:** It measures how far the current `close` price is from each of these anchored VWAPs. This distance is measured in terms of standard deviations calculated *within* that specific anchor period (e.g., how many weekly standard deviations the price is away from the weekly VWAP).
3. **Deviation Score (Multiplier):** Based on this standard deviation distance, a score is assigned. The further the price is from the VWAP (in terms of standard deviations), the higher the absolute score. The indicator uses linear interpolation to determine scores between the standard deviation levels (defaulted at 1, 2, and 3 standard deviations corresponding to scores of +/-2, +/-3, +/-4, with a score of 1 at the VWAP).
4. **Timeframe Weighting:** Longer timeframes are considered more significant. The deviation scores are multiplied by fixed scalars: Weekly (x1), Monthly (x2), Quarterly (x3), Yearly (x4).
5. **Final Valuation Metric:** The weighted scores from all four timeframes are summed up to produce the final oscillator value plotted in the indicator pane.
## How to Interpret and Use
* **Histogram (Indicator Pane):**
* The main output is the histogram representing the `Final Valuation Metric`.
* **Positive Values:** Suggest the price is generally trading above its volume-weighted averages across the timeframes, potentially indicating strength or relative "overvaluation."
* **Negative Values:** Suggest the price is generally trading below its volume-weighted averages, potentially indicating weakness or relative "undervaluation."
* **Values Near Zero:** Indicate the price is relatively close to its volume-weighted averages.
* **Histogram Color:**
* The color of the histogram bars provides context based on the metric's *own recent history*.
* **Green (Positive Color):** The metric is currently *above* its recent average plus a standard deviation band (dynamic upper threshold). This highlights potentially significant "overvalued" readings relative to its normal range.
* **Red (Negative Color):** The metric is currently *below* its recent average minus a standard deviation band (dynamic lower threshold). This highlights potentially significant "undervalued" readings relative to its normal range.
* **Gray (Neutral Color):** The metric is within its typical recent range (between the dynamic upper and lower thresholds).
* **Orange Line:** Plots the moving average of the `Final Valuation Metric` itself (based on the "Threshold Lookback Period"), serving as the centerline for the dynamic thresholds.
* **On-Chart Table:**
* Provides a detailed breakdown for transparency.
* Shows the calculated VWAP, the raw deviation multiplier score, and the final weighted (adjusted) metric for each individual timeframe (W, M, Q, Y).
* Displays the current price, the final combined metric value, and a textual interpretation ("Overvalued", "Undervalued", "Neutral") based on the dynamic thresholds.
## Potential Use Cases
* Identifying potential exhaustion points when the indicator reaches statistically high (green) or low (red) levels relative to its recent history.
* Assessing whether price trends are supported by underlying volume-weighted average prices across multiple timeframes.
* Can be used alongside other technical analysis tools for confirmation.
## Settings
* **Calculation Settings:**
* `STDEV Level 1`: Adjusts the 1st standard deviation level (default 1.0).
* `STDEV Level 2`: Adjusts the 2nd standard deviation level (default 2.0).
* `STDEV Level 3`: Adjusts the 3rd standard deviation level (default 3.0).
* **Interpretation Settings:**
* `Threshold Lookback Period`: Defines the number of bars used to calculate the average and standard deviation of the final metric for dynamic thresholds (default 200).
* `Threshold StDev Multiplier`: Controls how many standard deviations above/below the metric's average are used to set the "Overvalued"/"Undervalued" thresholds (default 1.0).
* **Table Settings:** Customize the position and colors of the data table displayed on the chart.
## Important Considerations
* This indicator measures price deviation relative to *anchored* VWAPs and its *own historical range*. It is not a standalone trading system.
* The interpretation of "Overvalued" and "Undervalued" is relative to the indicator's logic and calculations; it does not guarantee future price movement.
* Like all indicators, past performance is not indicative of future results. Use this tool as part of a comprehensive analysis and risk management strategy.
* The anchored VWAP and Standard Deviation values reset at the beginning of each respective period (Week, Month, Quarter, Year).

Vwap Daily By SamsungTitle
Daily VWAP with Historical Lookback (Logic Fix)
Description
This script calculates and plots the daily Volume-Weighted Average Price (VWAP), an essential tool for intraday traders.
What makes this indicator special is its robust plotting logic. Unlike many simple VWAP scripts that struggle to show data for previous days, this version includes a crucial fix that allows you to reliably display historical VWAP lines for as many days back as you need. This allows for more comprehensive backtesting and analysis of how price has interacted with the VWAP on previous trading days.
This is an indispensable tool for traders who use VWAP as a dynamic level of support/resistance, a benchmark for trade execution quality, or a gauge of the day's trend.
Key Features
Historical VWAP Display: Easily plot VWAP for multiple past days on your chart. Simply set the number of lookback days in the settings.
Accurate Daily Calculation: The VWAP calculation correctly resets at the beginning of each new trading session (00:00 server time).
Fully Customizable: You have full control over the appearance of the VWAP line, including its color, width, and style (Solid or Stepped).
Robust Plotting Engine: This script solves the common Pine Script issue where conditionally plotted historical lines fail to render. It works reliably on all intraday timeframes.
Built-in Debug Mode: For advanced users or those curious about the inner workings, a comprehensive debug mode can be enabled to display raw VWAP values, cumulative volume, and timeframe warnings.
How to Use
Add the "Daily VWAP with Historical Lookback" indicator to your chart.
IMPORTANT: Make sure you are on an intraday timeframe (e.g., 1H, 30M, 15M, 5M, 1M). This indicator is designed for intraday analysis and will display a warning if used on a daily or higher timeframe.
Open the indicator's settings.
In the "VWAP Settings" tab, adjust the "Lookback Days to Display" to set how many previous days of VWAP you want to see. (e.g., 0 for today only, 1 for today and yesterday, 10 for the last 10 days).
Customize the line's appearance in the "Line Style" tab.
The "Logic Fix" Explained (For Developers)
A common challenge in Pine Script is conditionally plotting data for historical bars. Many scripts attempt this by dynamically changing the plot color to na (transparent) for bars that shouldn't be displayed. This method is often unreliable and can result in the entire plot failing to render.
This script employs a more robust and standard approach: manipulating the data series itself.
The Problem: plot(vwap, color = shouldPlot ? color.red : na) can be buggy.
The Solution: plot(shouldPlot ? vwap : na, color = color.red) is reliable.
Instead of changing the color, we create a new data series (plotVwap). This series contains the vwapValue only on the bars that meet our date criteria. On all other bars, its value is na (Not a Number). The plot() function is designed to handle na values by simply "lifting the pen," creating a clean break in the line. This ensures that the VWAP is drawn only for the selected days, with 100% reliability across all historical data.
Settings Explained
Lookback Days to Display: Sets the number of past days (from the last visible bar) for which to display the VWAP.
Line Color, Width, and Style: Standard cosmetic settings for the VWAP line.
Enable Debug Mode (Master Switch): Toggles all debugging features on or off. It is enabled by default to help new users.
Display Debug: Cumulative Volume: When enabled, it shows the daily cumulative volume in a gray area on a separate pane.
Display Debug: Raw VWAP Value: When enabled, it plots the raw, unfiltered VWAP calculation for all days on the chart, helping to verify the core logic.
This script is provided for educational and informational purposes. Trading involves significant risk. Always conduct your own research and analysis before making any trading decisions.
If you find this script useful, a 'Like' is always appreciated! Happy trading
Auto Anchored Swing VWAP'sThe Auto Anchored Swing VWAP's indicator automatically anchors Volume-Weighted Average Price (VWAP) lines to recent swing highs and swing lows. VWAPs often act as key support or resistance levels because they represent the average price at which the majority of trading volume has occurred over a given time.
What is VWAP? VWAP is an essential tool in trading, representing the average price of a security over a specific period, weighted by volume. It helps traders identify the average price at which most trades have been executed, providing a balanced view of price action over time.
Anchored VWAPs: Unlike traditional VWAPs, which start from the beginning of the day, anchored VWAPs allow traders to "anchor" the calculation to a specific point in time or a pivot on the chart, in this case a swing high and swing low. This version of VWAP follows the price action from a selected point forward.
When the price is above the VWAP, it indicates that the majority of traders have paid less for the asset, creating a potential support zone as buyers may step in at or near this level. On the other hand, when the price is below the VWAP, it suggests that most traders have paid a higher price, which can lead to a resistance level where sellers may appear to defend their positions.
Anchored VWAPs, in particular, provide more precise support and resistance levels by starting from a specific swing high, swing low, or other significant point on the chart. This allows traders to track how price interacts with these levels after a certain bar.
The selectable pivot lookback length in this indicator defines the number of bars to the left and right of a potential swing high or swing low that must be lower (for a swing high) or higher (for a swing low) in order to confirm the pivot. In other words, it controls how many surrounding bars need to validate a local price extreme before it is considered a true swing point.
For example, if the lookback length is set to 9, a swing high is identified when there are 9 bars to the left and 9 bars to the right that all have lower highs than the current bar. The same logic applies for swing lows, where the price must be lower than the highs of the bars to the left and right for it to be considered a swing low.
This parameter allows traders to control the sensitivity of the swing points used to anchor VWAPs. A smaller lookback value will identify more frequent and short-term swing highs and lows, making the VWAPs more responsive to recent price action. Conversely, a larger lookback value will result in fewer but more significant swing points.
Pine Script
Utilization of Pine Script’s Enum Feature: This indicator leverages Pine Script's new enum feature for the selection of the VWAP lines (solid, dashed, or dotted) style.
VWAP Bands - Event Based [LuxAlgo]This indicator returns VWAP bands with a degree of smoothness resetting based on various user-selected events. The bands are constructed using a VWAP based naive standard deviation.
The indicator can be anchored or start from the first bar and can be used as trailing support/resistance, in a moving average crossover system, or as source for external indicators.
Settings
Start: VWAP anchor point
Start At First Bar: Display the VWAP from the first bar instead of a specified anchor point
VWAP
Length: Controls certain characteristics of the user-selected event
Mult: Multiplicative factor for the VWAP standard deviation
Source: Price source of the indicator
Event
Event: Determines the event resetting the degree of smoothness of the VWAP
External Cross/Event: Input source used for external crosses/events
Further details about the available events are given below.
Details
Various event conditions are available to the users. When the selected event occurs, the VWAP equals the current closing price.
By default, the event is periodic, that is the VWAP resets periodically, with a period determined by the Length setting.
The Higher High event resets the VWAP when a new higher high occurs.
The Lower Low event resets the VWAP when a new lower low occurs.
The Trend Change event is similar however resets the VWAP only once a higher high or lower low occurs. Higher highs and lower lows are given by Donchian channels with a period determined by the Length setting.
The Start event reset the VWAP at the selected anchor point (or first bar if the "Start At First Bar" setting is selected). This can be useful if one only needs a regular anchored VWAP band indicator.
The External Cross event resets the VWAP when the Source price crosses the series selected in the External Cross/Event setting. In the image above the VWAP resets when the price crosses the volatility stop indicator.
The External Event resets the indicator when a series selected in the External Cross/Event setting is not equal to 0. This allows using a custom event in order to reset the VWAP. In the above example the VWAP is reset during a new session due to the External Session indicator.
MTF VWAP + Fibo Incremental deviationsI made a Fibo variant of my first script "VWAPs + devs" :
This new indicator give you the possibility to plot multi timeframes VWAP (D, W, M, 3M and 12M ) and Fibo deviations for each one.
VWAP is a powerfull indicator which is used by big players to get informations if the price is "overbought" or "oversold". Deviations give the opportunity to have supports and resistances in those "over"-zones.
I searched for better results and found those defaults values :
Fib 1 level : 0.618
Fib 2 level : 0.786
Fib 3 level : 1.000
Fib 4 level : 1.618
Fib 5 level : 2.618
In the thumbnail, we can see that the 1.618 deviation level made a great support on the last uptrend for BTCUSDT .
You can change each values but low ones as 0.382 and 0.5 don't give really interesting supports/resistances.
I made this script as clear and simple as possible with only one menu in the parameters.
Some examples of what you can do :
BTCUSDT (Binance) H4 / D, W, M, 3M ,12M VWAP without devs
BTCUSDT (Binance) M5 / Daily VWAP + Fibo devs
Hope this will be useful for you !

Multi VWAPsMulti VWAPs Inspired by Biran Shannon and his book:
"MAXIMUM TRADING GAINS WITH ANCHORED VWAP . The Perfect Combination of Price, Time & Volume."
(ISBN 9798986868004)
A comprehensive VWAP (Volume Weighted Average Price) indicator that combines multiple timeframes and sessions in one view. Perfect for day trading and swing trading across different markets.
Features:
• Multiple VWAP Timeframes:
- Daily VWAP
- Weekly VWAP
- Monthly VWAP
- Quarterly VWAP
- Yearly VWAP
• Session-specific VWAPs:
- London Session (3:00 AM - 11:30 AM NY time)
- New York Session (9:30 AM - 4:00 PM NY time)
• Additional Indicators:
- Midnight Price Line (Previous day's closing price)
- 5-Day Moving Average
- 50-Day Moving Average
• Customization Options:
- Toggle individual VWAPs and indicators
- Customize colors for each component
- Adjustable label positioning
- MA smoothing settings
- Option to show/hide previous day's midnight price
• Smart Features:
- Auto-adjusting calculations based on timeframe
- Clear session boundaries
- Optimized for all chart timeframes
- Clean label system
Perfect for:
• Day traders tracking multiple timeframe momentum
• Swing traders using longer-term VWAPs
• Session traders focusing on London/NY hours
• Multi-timeframe analysis
• Price action trading with VWAP support/resistance
This indicator combines essential trading tools in one clean interface, helping you make informed decisions without cluttering your chart.
MTFT VWAPs Auto AnchoredMulti Time Frame Tools
Multi Time Frame Tools (MTFT) is a suite of scripts aimed to establish a standard timeframe-based color scheme. This can be utilized to overlay different timeframes calculations/values over a single timeframe. As one example, this would allow to observe the 5-month moving average, 5-week moving average, and 5-day moving average overlaid over each other. This would allow to study a chart, get accustomed to the color scheme and study all these at the same time much easier.
All indicators calculated using the below specific timeframes as input, will always use the color scheme outlined below. This is to get you in habit of recognizing the different timeframes overlaid in top of each other. These can be personalized.
Longer TF analysis.
Yearly - Black
Semi-Annual - Yellow
Quarterly - White
Monthly - Maroon
Weekly - Royal Blue
Daily - Lime
Shorter TF analysis.
4 hour - Fuchsia
1 hour - Orange
30 min - Red
15 min - Brown
10 min - Purple
5 min - Lilac
All color coordination is able to be modified in either the “Inputs” or “Style” section. If you need to make changes, make sure to select “Save as Default” on the bottom right of the settings menu.
Recommended Chart Color Layout
I played around with color coordination a lot. The final product was what worked best for me. I personally use the following chart settings to accent all available TF colors.
-> Click on the settings wheel on your chart. -> Click on “Appearance”.
Background - Solid -> On the top row pick the 6th color from the left.
Vert Grid Lines and Horz Grid Lines -> On the top row pick the 7th color from the left.
You may of course change these and the indicator line colors as you like.
Adding indicator to Chart
-> Open the TradingView “Indicators & Strategies” library, the icon has “ƒx”. -> All premium scripts will be located under “Invite-Only Scripts” -> Click indicator to add to your chart.
MTFT VWAPs Auto Anchored
The Anchored Volume-Weighted Average Price, Anchored VWAP, is a commonly discussed FinTwit tool. I personally found it through Brian Shannon on Twitter. I have seen big FinTwit accounts solely focus on this strategy alone and have seen other big FinTwit accounts mix with their other indicators. I will be providing very basic info to utilize this script; it is up to you to dive deep into learning this strategy. I am not an expert with the tool or a financial advisor. As with all aspects of life, I recommend you research, learn, discern and practice extensively in order to become a master.
The script has the following features.
1. Three user selected time frames auto anchored VWAPS. It will auto anchor to the start of the timeframe. Timeframes(TF) include: Yearly(Y), Semi-annually(S), Quarterly(Q), Monthly(M), Weekly(W), Daily(D), and 4 hour. Image below shows the D candlestick as the active timeframe, the anchored VWAPs for the Year, Quarter, and Month.
2. Auto hide lower timeframe calculations. Auto Hide feature will hide smaller TF calculations when a larger timeframe is selected as the display TF. Example, when the Daily timeframe candlestick selected the Weekly and Daily Anchored VWAPs are hidden because they produce very noisy results. If a lower TF is selected such as the 30 min candlestick, the previously hidden Daily and Weekly Open Anchored VWAPs are now displayed. Notice that this specific indicator calculates different with every different timeframe that is selected. The lower TF calculations are more accurate as they include additional information. Image below shows the 30 min timeframe selected with the Daily, Weekly, and Monthly Open Anchored VWAPs displayed.
3. Auto Anchor using Pivot High/Low locations. Script finds the pivot highs/lows with a user selected look back/forward period. Additionally, as new pivot highs/lows appear you can choose to keep up to 4 each previous pivot high/low anchored VWAPs displayed. Image below has a 40 look back/forward period selected, and 2 past AVWAPs enabled.
You may notice in the above image that there is a gap between the AVWAP plot and the marked pivot point. This is not something that can be avoided as the script has to look forward in order to verify the pivot. The calculation is still correct, this can be verified by manually adding an “Anchored VWAP” drawing and seeing the values align. Image below shows that they match. White lines are the manually added “Anchored VWAP” drawings. If you verify this for yourself, make sure to select the correct input source in the settings of the drawing.
4. Auto Anchored on IPO High/Low. Looks for the first available candlestick in a chart and anchors to the high and low. This is useful with newer companies with recent IPOs.
IMPORTANT NOTE to TradingView admin: One of the lessons I would consider most important in attaining clarity regarding trading, is “TheStrat” by Rob Smith. His lesson on “actionable signals” is something that can be applied to any strategy. For this reason, I am including “MTFT TheStrat Patterns Pro” script in all images that will depict confluence for a better trade selection.
Example using TheStrat Pro MTFT with this indicator.
Look for a “TheStrat actionable signal” or a “TheStrat Reversal signal” on a smaller timeframe that has an instance of this indicator on a larger timeframe calculation that is in range of the candlestick that formed your actionable signal. This means that the indicators plot you are observing must be above the low and below the high of the candlestick that is the actionable signal/reversal signal.
The Image below shows what this would look like with this indicator. The selected candlestick is the 2-day, it shows a 1-3-1 pattern and the Quarter Anchored VWAP in range. This actionable signal could be played in both directions. If the high is breached, you would enter a long position from the high of the inside candlestick. If the low is breached than you would enter a short. For targets you would look at the previous pivots, for this example all targets were hit. Note that the “Entry” and “Targets” line were added manually and are not part of the script. Setups won’t always play out so nice and clean, but given that there is so many stocks and so many signals this is just a thought to improve the quality of the signal as it has extra confluence. If you are interested in learning further, research ‘TheStrat’ by Rob Smith.
VWAP CALENDARThe VWAP CALENDAR indicator plots up to 20 anchored Volume-Weighted Average Price (VWAP) lines on your chart, each starting from a user-defined date and time (e.g., April 20, 2024). Designed for simplicity, it helps traders visualize VWAPs for key events or dates, with customizable labels and colors. The indicator is optimized for crypto markets (e.g., BTC/USD) but works with any symbol providing volume data.
Features: Multiple VWAPs: Configure up to 20 independent VWAPs, each with a custom anchor date and time.
Dynamic Labels: Labels update in real-time, aligning precisely with each VWAP line’s price level, positioned to the right of the chart for clarity.
Customizable Settings: Adjust label text (e.g., “Event A”), line colors, line widths (1–5 pixels), text colors, and text sizes (8–40 points, default 22).
Bubble or No-Background Labels: Choose between bubble-style labels (with colored backgrounds) or plain text labels without backgrounds.
Timeframe Support: Accurate on daily, 4-hour, 1-hour, and 30-minute charts for anchors within ~1.5 years (e.g., April 20, 2024, from August 2025).
Limitations: VWAP accuracy for anchors like April 20, 2024 (~477 days back) is reliable on 1-hour and larger timeframes. Below 30-minute (e.g., 15-minute, 24-minute), VWAPs may start later or be unavailable due to TradingView’s 5,000-bar historical data limit. For distant anchors, use 4-hour or daily charts to ensure accuracy.
Requires sufficient chart history (e.g., premium account or deep exchange data) for older anchors on 1-hour or 30-minute charts.
Usage Notes: Set anchor dates via the indicator settings (e.g., “2024-04-20 00:00”).
Enable/disable individual VWAPs as needed.
Zoom out to load maximum chart history for best results, especially on 1-hour or 30-minute timeframes.
Ideal for crypto symbols with continuous trading data, but verify data availability for other markets.
Disclaimer:
This is a free indicator provided as-is.
VWAP Bands [UAlgo]The "VWAP Bands " indicator is designed to provide traders with valuable insights into market trends and potential support/resistance levels using Volume Weighted Average Price (VWAP) bands. This indicator integrates the core concepts of VWAP with additional trend analysis features, making it a versatile tool for both range trading and trend-following strategies.
The VWAP bands are plotted based on the standard deviation multipliers, creating upper and lower bands around the VWAP. These bands serve as dynamic support and resistance levels. When the price approaches these bands, traders can anticipate potential reversals or continuations of the current trend. Additionally, the indicator provides visual cues for trend strength and potential trend changes, helping traders make informed decisions in various market conditions.
🔶 Settings
Source (Data Source): The data source for VWAP calculations. The default setting is the typical price (HLC3), which is the average of the high, low, and close prices.
Length: The number of bars used in the VWAP calculation. This determines the lookback period for the indicator.
Standard Deviation Multiplier: The multiplier applied to the standard deviation to create the primary upper and lower VWAP bands. This setting controls the distance of the bands from the VWAP.
Secondary Standard Deviation Multiplier: The multiplier applied to the standard deviation to create the secondary upper and lower VWAP bands, providing additional levels of support and resistance.
Display Trend: A toggle to enable or disable the display of the trend analysis feature. When enabled, the indicator highlights trend strength and potential trend changes.
Display Trend Crossovers: A toggle to enable or disable the display of trend crossover signals. When enabled, the indicator plots shapes to indicate where trend switches are likely occurring.
🔶 Calculations
The calculations behind the "VWAP Bands " indicator begin with determining the Volume Weighted Average Price (VWAP), which provides a comprehensive view of the average price of an asset, weighted by trading volume. This gives a more accurate representation of the asset's true average price over a specified period.
The first step in this process involves summing the trading volume over a chosen period, typically represented by the length parameter. Simultaneously, the product of the price (usually an average of the high, low, and close prices) and the trading volume is calculated and summed. By dividing this cumulative price-volume product by the total volume, we obtain the VWAP value. This VWAP serves as the central anchor around which the price action oscillates.
To enhance the utility of VWAP, we introduce standard deviation calculations. Standard deviation measures the extent of price dispersion from the VWAP, providing insight into price volatility. By calculating the variance (which involves the squared deviations of price) and then taking its square root, we derive the standard deviation. This helps in understanding how far prices typically stray from the VWAP.
With the VWAP and standard deviation in hand, we then establish upper and lower bands by adding and subtracting multiples of the standard deviation from the VWAP. These bands act as dynamic support and resistance levels, adapting to changes in market volatility. The primary bands, set by the first standard deviation multiplier, are augmented by secondary bands defined by a larger multiplier, offering additional layers of potential support and resistance.
It also integrates trend analysis, highlighting areas where the price action suggests a strong or weak trend. This is achieved by overlaying colored zones above and below the bands, indicating the strength and direction of the trend. When the price crosses these bands, it signals potential trend changes, aiding traders in making timely decisions.
🔶 Disclaimer
The "VWAP Bands " indicator is provided for educational and informational purposes only. It is not intended as financial advice and should not be construed as such.
Trading involves significant risk and may not be suitable for all investors. Before using this indicator or making any investment decisions, it is important to conduct thorough research and consider your financial situation.

VWAP Previous VWAP WMQY StdDev Extensions Nadro StyleDisplays Multi-TF VWAP with Std Dev Bands.
Developing VWAP and Std Dev Bands
Previous VWAP and Std Dev Bands
Previous VWAP Extensions
Some Examples
VWAP Divergence | dobofulopOverview :
This script identifies potential bullish and bearish divergence signals using the Volume Weighted Average Price (VWAP). It calculates VWAP resets based on a selected “Anchor Period” (Session, Week, Month, Quarter, Year, Decade, Century, or corporate events like Earnings, Dividends, Splits). When price action and VWAP move in opposite directions with a sufficiently large ATR-based move over a chosen lookback period, the script plots divergence dots on the chart.
Key Features:
VWAP Anchoring : Choose an anchor period for resetting VWAP. This could be daily, weekly, monthly, or based on specific corporate events (Earnings, Dividends, Splits).
Divergence Detection : Looks for instances where the price is moving up while VWAP moves down (potential bullish divergence), and vice versa for bearish divergence.
ATR Filter : Uses the ATR (Average True Range) to filter out minor or insignificant price moves, helping to reduce noise.
Gap Check : Automatically invalidates signals if large price gaps occur within the lookback range.
Visual Signals : Bullish divergences are plotted below the bar, while bearish divergences are plotted above, making it easy to spot potential reversal zones.
How to Us
Inputs:
- Anchor Period (Session, Week, Month, etc.) – determines when the VWAP calculation restarts.
- Source (Default: HLC3) – Price source for the VWAP.
- ATR Multiplier and Lookback Period – Fine-tune the threshold for detecting significant moves vs. VWAP.
Interpretation:
- Bullish Divergence Dot: Suggests potential price strength when price moves higher but VWAP moves lower.
- Bearish Divergence Dot: Suggests potential price weakness when price moves lower but VWAP moves higher.
Disclaimer:
This script is provided for educational purposes only and should not be interpreted as financial advice. Past performance does not guarantee future results. Always conduct your own analysis and consider consulting a financial professional before making trading decisions.

Multi-Day Rolling VWAP [Intraday]Ideas from Brian Shannon's book "Anchored VWAP"
The Multi-Day Rolling VWAP indicator for intraday timeframes allows you to track the Volume Weighted Average Price (VWAP) over multiple days, specifically for 1-day, 2-day, 3-day, 4-day, and 5-day periods. This indicator beyond the standard daily VWAP provides a broader perspective on price trends and market sentiment.
Features:
- Multi-day VWAPs: Analyze VWAP over several days to observe longer-term price movements.
- Customizable display: Choose which VWAP periods to display on the chart
- Colorize: Choose different colors for each VWAP to easily distinguish between periods.
- Adjustable settings: Change the line thickness and select the price source for VWAP calculations.
- Works with Replay Mode
- Works in any intraday timeframe on any asset with volume and price
Benefits:
- Trend identification: Compare current prices with multi-day rolling VWAPs to spot trends.
- Spot reversals: Look for potential price reversals or support when prices cross VWAP lines.
VWAP RangeThe VWAP Range indicator is a highly versatile and innovative tool designed with trading signals for trading the supply and demand within consolidation ranges.
What's a VWAP?
A VWAP (Volume Weighted Average Price) represents an equilibrium point in the market, balancing supply and demand over a specified period. Unlike simple moving averages, VWAP gives more weight to periods with higher volume. This is crucial because large volumes indicate significant trading activity, often by institutional traders, whose actions can reflect deeper market insights or create substantial market movements. The VWAP is also often used as a benchmark to evaluate the efficiency of executed trades. If a trader buys below the VWAP and sells above it, they are generally considered to have transacted favourably.
This is how it works:
Multiple VWAP Anchors:
This indicator uses multiple VWAPs anchored to different optional time periods, such as Daily, Weekly, Monthly, as well as to the highest high a lowest low within those periods. This multiplicity allows for a comprehensive view of the market’s average price based on volume and price, tailored to different trading styles and strategies.
Dynamic and Fixed Periods:
Traders can choose between using dynamic ranges, which reset at the start of each selected period, and specifying a date and time for a particular fixed range to trade. This flexibility is crucial for analyzing price movements within specific ranges or market phases.
Fixed ranges allow VWAPs to be calculated and anchored to a significant market event, the beginning of a consolidation phase or after a major news announcement.
Signal Generation:
The indicator generates buy and sell signals based on the relationship of the price to the VWAPs. It also allows for setting a maximum number of signals in one direction to avoid overtrading or pyramiding. Be sure to wait for the candle close before trading on the signals.
Average Buy/Sell Signal Lines:
Lines can be plotted to display the average buy and sell signal prices. The difference between the lines shows the average profit per trade when trading on the signals in that range. It's a good way to see how profitable a range is on average without backtesting the signals. The lines will also often turn into support and resistance areas, similar to value areas in a volume profile.
Customizable Settings:
Traders have control over various settings, such as the VWAP calculation method and bar color. There are also tooltips for every function.
Hidden Feature:
There's a subtle feature in this indicator: if you have 'Indicator values' turned on in TradingView, you'll see a Sell/Buy Ratio displayed only in the status line. This ratio indicates whether there are more sell signals than buy signals in a range, regardless of the Max Signals setting. A red value above 1 suggests that the market is trending upward, indicating you might want to hold your long positions a bit longer. Conversely, a green value below 1 implies a downward trend.

VWAP and previous VWAP for Support & Resistance for D W MI overhauled my old multi timeframe VWAP script to make the VWAP OC-Check work for all timeframes. Now only one function is used to calculate the 3 preset VWAPs.
Previous VWAPS = the price where the last session closed sometimes work as Support and Resistance.
The OC-Check Mode theory examines if the VWAP from the Open is above or below the VWAP from Close
and if price is above or below normal VWAP (HLC3).
This way we have 4 states:
Red = Strong Downtrend
Orange = Weak Downtrend
Blue = Weak Uptrend
Green = Strong Uptrend
As always it is just a theory - nothing is set in stone regarding any indicator.
VWAP Xing D, Prv.D, W, Q, M, & Y + SD [UOI]Introducing the "VWAP Xing D, Prv.D, W, Q, M, & Y + SD" Indicator: A Comprehensive, Multi-Timeframe Trading Tool for the Modern Trader
In today's dynamic and fast-paced financial markets, traders require versatile and powerful tools that can help them navigate the complex world of trading. The "VWAP Xing D, Prv.D, W, Q, M, & Y + SD" indicator is designed to be the ultimate, all-in-one solution for traders seeking a comprehensive and robust trading indicator. This cutting-edge tool combines the power of an extensive VWAP library with the versatility of Bollinger Bands, Donchian Channels, standard deviation multi-timeframe analysis, and an auto boxed range identifier, all to provide traders with the crucial insights needed to identify reversals, breakdowns, and breakups.
Offering the magnetic daily, previous day, weekly, monthly, quarterly, and even yearly VWAP levels, this comprehensive library caters to traders with varying time horizons and strategies. Coupled with the precision of Bollinger Bands and Donchian Channels, the indicator allows for accurate tracking of price volatility, enabling traders to make more informed decisions in response to changing market conditions. The integration of multi-timeframe standard deviation analysis further bolsters the indicator's ability to identify potential trading opportunities, ensuring that users can stay ahead of the curve.
Finally, the auto boxed range identifier serves as the cherry on top, automatically detecting critical price levels where reversals, breakdowns, and breakups are most likely to occur. This powerful feature not only helps traders confirm potential entry and exit points but also allows for more effective risk management.
Overall, the "VWAP Xing D, Prv.D, W, Q, M, & Y + SD" indicator is a comprehensive, multi-timeframe trading tool that empowers traders with unparalleled insights, precision, and adaptability. Whether you're a seasoned professional or a novice trader, this powerful indicator is a must-have tool for anyone looking to excel in today's competitive financial markets.
Multi-timeframe Volume Weighted Average
First let's define Volume Weighted Average Price (VWAP):
Volume Weighted Average Price (VWAP) is a widely-used technical analysis indicator that calculates the average price of a security, taking into account both price and trading volume. In essence, it represents the average price at which a security has been traded throughout a specified time period, giving more weight to transactions with higher volume.
The VWAP is often used by traders and investors to assess the market's trend and gauge the relative value of a security. It serves as a benchmark for institutional investors, who often use it to evaluate their trading performance and determine whether they are buying or selling at favorable prices.
The formula for calculating VWAP is:
VWAP = (Sum of (Price * Volume)) / Total Volume
By incorporating volume into the calculation, the VWAP provides a more accurate representation of a security's true average price, as it takes into consideration the impact of larger trades on the price. This makes it a valuable tool for traders seeking to make more informed decisions in the market and avoid getting caught in unfavorable trading positions.
VWAP is a crucial indicator that provides insights into the average price at which a financial asset, such as a stock or cryptocurrency, has been traded throughout a specific period. It takes into consideration the volume of trades executed at each price level during that period. The VWAP lines included in the " VWAP Xing D, Prv. D, W, Q, M, & Y" indicator offer various timeframe perspectives, allowing traders to analyze different levels of market trends and behaviors.
Here's a detailed explanation of the VWAP lines and their significance:
1. Daily VWAP (D): The daily VWAP line represents the average price at which the asset has been traded throughout the current trading day. It resets at the beginning of each trading session. Traders often use the daily VWAP as a reference point to gauge the fairness of their trade executions relative to the prevailing market prices. Price deviations from the daily VWAP can indicate shifts in market sentiment and potential trading opportunities.
2. Previous Day VWAP (Prv.D): The previous day VWAP line reflects the average price at which the asset was traded during the preceding trading day. It helps traders assess the continuity or deviation of the current day's price action relative to the previous day's trading activity. Traders often observe the previous day VWAP for insights into potential support or resistance levels and to identify whether the current day's price is trading above or below the previous day's average price.
3. Weekly VWAP (W): The weekly VWAP line calculates the average price of the asset over the entire week, taking into account the volume traded at each price level. Traders use the weekly VWAP to gain a broader perspective on the asset's price movement and potential trend directions. It can act as a significant support or resistance level, especially when the price interacts with the weekly VWAP.
4. Monthly VWAP (M): The monthly VWAP line provides a longer-term perspective by averaging the asset's price and volume data over the entire month. It helps traders identify key price levels that are significant within the monthly timeframe. Traders often observe the monthly VWAP to assess the overall trend and to determine whether the current price is trading above or below the monthly average.
5. Quarterly VWAP (Q): The quarterly VWAP line calculates the average price and volume data over a three-month period, representing a longer-term view of market activity. Traders use the quarterly VWAP to identify significant price levels and to analyze the broader trend within the quarterly timeframe. Deviations from the quarterly VWAP can indicate potential shifts in market sentiment and trading opportunities.
6. Yearly VWAP (Y): The yearly VWAP line represents the average price and volume data over the course of a year. It offers a comprehensive long-term perspective on the asset's price behavior and trend. Traders often consider the yearly VWAP as a key reference point for assessing the asset's overall performance and identifying major support or resistance levels.
By observing the VWAP lines, traders can gain insights into the prevailing market sentiment, potential support or resistance levels, and deviations from average prices. These deviations can be useful for identifying potential trading opportunities, such as when the price significantly deviates from the VWAP lines, suggesting potential overbought or oversold conditions. Additionally, VWAP can serve as a benchmark for evaluating trade executions and assessing the fair value of an asset.
It's important to note that while VWAP is a valuable tool, it should be used in conjunction with other technical analysis indicators and strategies to make informed trading decisions. Traders should consider factors like market context, trend analysis, and risk management principles to validate signals and confirm potential trading opportunities.
Bollinger Bands and Donchian Channels
In addition to VWAP this indicator also has combined the power of Bollinger Bands and Donchian Channels to produce a solid framework. The time frame by default is set to 30 min which is good for intraday trading but you can also change that in the setting to always use chart time frame intervals which works better on longer time frames.
IMPORTANT: You can change the time frame to always use chart or keep the default on 30 min or change it to another timeframe manually. If you allow the chart to always provide the intervals then the default 30 min will be ineffective and it automatically adjust to chart timeframe. Personally I think a fixed timeframe work better so keep in that way if you trade on 30 min or lower time frame.
Bollinger Bands and Donchian Channels are two popular technical analysis tools that provide valuable insights into price volatility, potential breakout levels, and support/resistance areas. When used in combination, they offer a comprehensive framework for analyzing market conditions and identifying trading opportunities.
Bollinger Bands: Bollinger Bands consist of two lines plotted above and below a moving average, typically a simple moving average (SMA). The upper band is calculated by adding the standard deviation of price multiplied by a customizable standard deviation factor to the SMA. The lower band is calculated by subtracting the standard deviation multiplied by the same factor from the SMA. The key features of Bollinger Bands are as follows:
1. Volatility Measurement: Bollinger Bands expand and contract based on market volatility. When the bands widen, it indicates higher volatility, and when they narrow, it suggests lower volatility. Traders can observe the width of the bands to gauge the potential for price movements and volatility expansions.
2. Overbought/Oversold Levels: Bollinger Bands can help identify overbought and oversold conditions in the market. When the price reaches or exceeds the upper band, it may indicate that the asset is overbought and due for a potential reversal or pullback. Conversely, when the price reaches or falls below the lower band, it may suggest oversold conditions and a possible bounce or reversal.
Donchian Channels: Donchian Channels consist of two lines representing the highest high and lowest low within a specified period. The key characteristics of Donchian Channels are as follows:
1. Breakout Levels: The upper line of the Donchian Channel represents the highest high within the specified period, while the lower line represents the lowest low. Traders often use Donchian Channels to identify potential breakout levels. When the price breaks above the upper channel line, it may indicate a bullish breakout and the potential for further upward momentum. Conversely, a break below the lower channel line suggests a bearish breakout and the possibility of downward momentum.
2. Support/Resistance Areas: Donchian Channels also act as dynamic support and resistance levels. The upper channel line can act as a resistance level where the price may encounter selling pressure. The lower channel line can act as a support level where the price may find buying interest. Traders can monitor price interactions with these levels to make informed trading decisions.
Advantages of Using Bollinger Bands and Donchian Channels Together: By combining Bollinger Bands and Donchian Channels, traders can gain a more comprehensive view of market conditions and potential trading opportunities. Here are some advantages of using them together:
1. Volatility Confirmation: Bollinger Bands help identify periods of high or low volatility, while Donchian Channels confirm breakouts and potential trend changes. When the bands widen and a breakout occurs above or below the Donchian Channels, it can provide confirmation of increased volatility and the start of a new trend.
2. Price Extremes and Breakouts: Bollinger Bands assist in identifying overbought and oversold conditions, while Donchian Channels help pinpoint breakout levels. When price reaches an extreme level according to Bollinger Bands and coincides with a breakout from the Donchian Channels, it can signal a significant trading opportunity.
3. Support/Resistance Validation: Donchian Channels act as dynamic support and resistance levels, and Bollinger Bands can validate these levels. When price bounces off the upper or lower Bollinger Band near a Donchian Channel level, it provides additional confirmation of the support or resistance area.
4. Risk Management: The combination of Bollinger Bands and Donchian Channels enables traders to set more precise stop-loss levels and define risk. They can place stop-loss orders beyond the support or resistance levels identified.
Standard Deviation
Standard deviation bands by default are disabled but you can easily enable them in the setting. The 1 standard deviation bands are made invisible by default to avoid a crowded space. You can reduce the transparency to view them.
In intraday trading, the Daily VWAP (Volume Weighted Average Price) with 3 standard deviations is a powerful tool that helps traders gauge price movements and potential trading opportunities. Here's how it works and why it is useful:
1. Calculation of Daily VWAP: The Daily VWAP is the average price at which a security has traded throughout the trading day, weighted by the volume of each trade. It provides a measure of the average price that traders have paid for the asset during the day.
2. Standard Deviation: Standard deviation is a statistical measure that quantifies the dispersion or variability of prices around the Daily VWAP. It gives an indication of how much prices deviate from the average. A higher standard deviation suggests greater price volatility.
3. Three Standard Deviations: By adding and subtracting three times the standard deviation from the Daily VWAP, you create bands that represent the potential price range within which the majority of intraday trading activity is expected to occur. These bands act as potential support and resistance levels and help traders identify price extremes.
4. Price Reversals: When the intraday price extends beyond the upper or lower band (three standard deviations), it suggests an overextended move or potential price reversal. Traders interpret this as an opportunity to enter or exit trades. If the price moves beyond the upper band, it may indicate overbought conditions and a possible reversal to the downside. Conversely, if the price moves below the lower band, it may signal oversold conditions and a potential reversal to the upside.
5. Volatility and Breakouts: Intraday traders often look for volatility and breakout opportunities. The three standard deviation bands on the Daily VWAP provide valuable information about price volatility. When the price breaks out of the bands, it suggests a significant increase in volatility and potential opportunities for intraday traders to take advantage of strong momentum moves.
6. Risk Management: The three standard deviation bands help traders define their risk and set stop-loss orders. By placing stop-loss orders outside the bands, traders can protect their positions in case the price moves beyond the expected range. This risk management technique allows traders to limit their potential losses and preserve capital.
7. Confirmation with Other Indicators: Intraday traders often use the three standard deviation bands on the Daily VWAP in conjunction with other technical indicators or chart patterns to strengthen their trading decisions. The bands can validate other signals or provide additional confirmation before entering or exiting a trade.
Overall, the Daily VWAP with three standard deviations is a valuable tool for intraday traders as it helps identify price extremes, potential reversals, volatility, and breakout opportunities. By incorporating this indicator into their trading strategies, traders can make more informed decisions and enhance their intraday trading performance.
Auto Boxed Range Detector
The true innovation in the "VWAP Xing D, Prv.D, W, Q, M, & Y + SD" indicator lies in the integration of the sophisticated 'Auto Boxed Range Detector.' This feature serves as the cornerstone of the tool's enhanced functionality, shedding light on critical price ranges to give traders a distinct advantage when identifying potential breakouts or breakdowns.
Meticulously designed with the needs of traders in mind, the Auto Boxed Range Detector automates the process of pinpointing trading ranges, resulting in increased precision and swiftness in your decision-making. By automating this crucial aspect of technical analysis, traders can now focus on other essential factors, ultimately maximizing their trading efficiency.
Furthermore, the Auto Boxed Range Detector helps traders avoid falling prey to false breakouts. By identifying the top of the boxed range in relation to resistance levels, users can more accurately predict the likelihood of a breakout. For instance, if the top of the boxed range is situated near a resistance line, the chances of a breakout are diminished unless the market is experiencing a trend day.
In essence, the Auto Boxed Range Detector not only streamlines the identification of trading ranges but also provides invaluable insights into the validity of potential breakouts or breakdowns. This innovative feature makes the "VWAP Xing D, Prv.D, W, Q, M, & Y + SD" indicator an indispensable tool for traders seeking to capitalize on opportunities while minimizing risk in today's fast-paced financial markets.
Once you get used to this tool it will be an integral part of your trading.

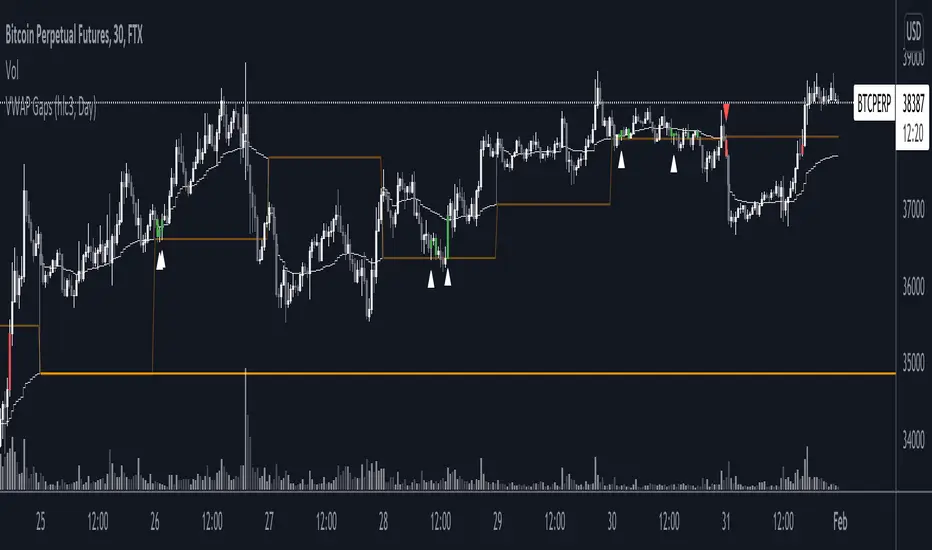
VWAP GapsTheory of untested previous VWAPs acting in similar way to nPOC, where agreed previous 'value' based on volume acts as a liquidity area to be retested.
Indicator shows
- User selected VWAP
- Untested previous VWAPs. The line will disappear once price crosses it's value
- Sweeps of previous VWAPs. Show by both bar colours and plotted arrows under different conditions.
Sweep Filters
1. Bull or Bear Bar (required for an arrow plot)
2. Sweep Conditions i.e. open below line, high above line, and close below line
3. If current VWAP is below/above the previous VWAP value.
All-In-One Auto Anchored VWAPsA chart isn't trendy without a VWAP (which stands for volume weighted average price).
This indicator allows you to choose 3 different anchored VWAPs, and customize the anchor period from one of many different options, including:
- Daily
- Weekly
- Monthly
- Quarterly
- Yearly
- All Time
- Specific Pivots
- Specific Sessions
You can then choose whether you want to anchor to the open, highest or lowest value within that period.
The indicator will automatically update every time a new anchor point is triggered. Every VWAP has colors and standard deviation bands as an optional setting.
As interest in the script grows I will continue to add new features.