Search in scripts for "WaveTrend"

SuperWaveTrendWaveTrend with Crosses + HyperWave + Confluence Zones + Thresholds
SuperWaveTrend — Advanced Momentum System Integrating WaveTrend, HyperWave, Confluence Zones & Threshold Filters
SuperWaveTrend is an enhanced momentum indicator built upon the classic WaveTrend (WT) framework.
It integrates HyperWave extreme zones, top/bottom Confluence Zones, trend hesitation Threshold regions, WT crossover reversal signals, and more.
This indicator is suitable for:
• Trend following
• Swing trading
• Reversal spotting
• Overbought/oversold structure analysis
• Extreme market sentiment detection
Whether you’re scalping or planning swing entries, SuperWaveTrend offers a more precise and visually intuitive momentum structure.
Key Features
1. WaveTrend Core Structure (WT1 / WT2)
• WT1: Primary momentum line
• WT2: Signal line
• Momentum Spread Area (WT1 − WT2) visualization highlights shifts in trend strength
2. HyperWave Extreme Momentum Zones
Background highlight automatically appears during extreme momentum conditions:
• Purple-red: Extreme bullish zone
• Orange: Extreme bearish zone
Helps identify:
• Blow-off tops
• Panic sell-offs
• Extreme trend continuation phases
3. Confluence Zones (Top/Bottom Resonance)
Combines overbought/oversold signals with momentum structure to mark:
• Gold top zones → weakening bullish momentum
• Blue bottom zones → weakening bearish momentum
Useful for detecting:
• Bearish divergence tops
• Reversal bounces
• High-level exhaustion / low-level capitulation
4. Threshold Hesitation Zone (Gray)
When WT1 and WT2 converge tightly, a gray background highlights:
• Unclear direction
• Trend weakening
• Higher risk of false signals
Generally not recommended for new entries.
5. WT Crossover Signals (Cross Signals)
WT1 and WT2 crossovers are marked with color-coded dots:
• Green: Bullish cross
• Red: Bearish cross
A core signal for capturing reversal shifts.
⚠️ Creator’s Disclaimer & Usage Insights
***WARNING***
SuperWaveTrend is not designed for extremely strong one-sided trends.
During highly impulsive markets, signals may become delayed or less reliable.
Optimal Timeframes
Based on extensive backtesting, In swing-trading environments, the indicator performs most effectively on the 1H–4H timeframes, where momentum cycles form cleanly and Confluence Zones provide high-probability setups.
Trading Insights
• In swing-trading environments, Confluence Zones often coincide with excellent long/short opportunities, especially when momentum exhaustion is confirmed.
• When paired with a Bollinger Bands framework, the system exhibits significantly improved accuracy and structure clarity.
Have fun,
BigTrunks

WaveTrend RBF What it does
WT-RBF extracts a “wave” of momentum by subtracting a fast Gaussian-weighted smoother from a slow one, then robust-normalizes that wave with a median/MAD proxy to produce a z-score (z). A short EMA of z forms the signal line. Optional dynamic thresholds use the MAD of z itself so overbought/oversold levels adapt to volatility regimes.
How it’s built:
Radial (Gaussian) smoothers
Causal, exponentially-decaying weights over the last radius bars using σ (sigma) to control spread.
fast = rbf_smooth(src, fastR, fastSig)
slow = rbf_smooth(src, slowR, slowSig)
wave = fast − slow (band-pass)
Robust normalization
A two-stage EMA approximates the median; MAD is estimated from EMA of absolute deviations and scaled by 1.4826 to be stdev-comparable.
z = (wave − center) / MAD
Thresholds
Dynamic OB/OS: ±2.5 × MAD(z) (or fixed levels when disabled)
Reading the indicator
Bull Cross: z crosses above sig → momentum turning up.
Bear Cross: z crosses below sig → momentum turning down.
Exits / Bias flips: zero-line crosses (below 0 → exit long bias; above 0 → exit short bias).
Overbought/Oversold: z > +thrOB or z < thrOS. With dynamics on, the bands widen/narrow with recent noise; with dynamics off, static guides at ±2 / ±2.5 are shown.
Core Inputs
Source: Price series to analyze.
Fast Radius / Fast Sigma (defaults 6 / 2.5): Shorter radius/smaller σ = snappier, higher-freq.
Slow Radius / Slow Sigma (defaults 14 / 5.0): Larger radius/σ = smoother, lower-freq baseline.
Normalization
Robust Z-Score Window (default 200): Lookback for median/MAD proxy (stability vs responsiveness).
Small ε for MAD: Floor to avoid division by zero.
Signal & Thresholds
Dynamic Thresholds (MAD-based) (on by default): Adaptive OB/OS; toggle off to use fixed guides.
Visuals
Shade OB/OS Regions: Background highlights when z is beyond thresholds.
Show Zero Line: Midline reference.
(“Plot Cross Markers” input is present for future use.)

WaveTrend OscillatorWave trend Oscillator, similar to the other Cypher Oscillators, just that this oscillator is a little bit more refined less noise and a few better options for the money flow, but keeping the basic Structures and features. The only feature this does not have is the divergences

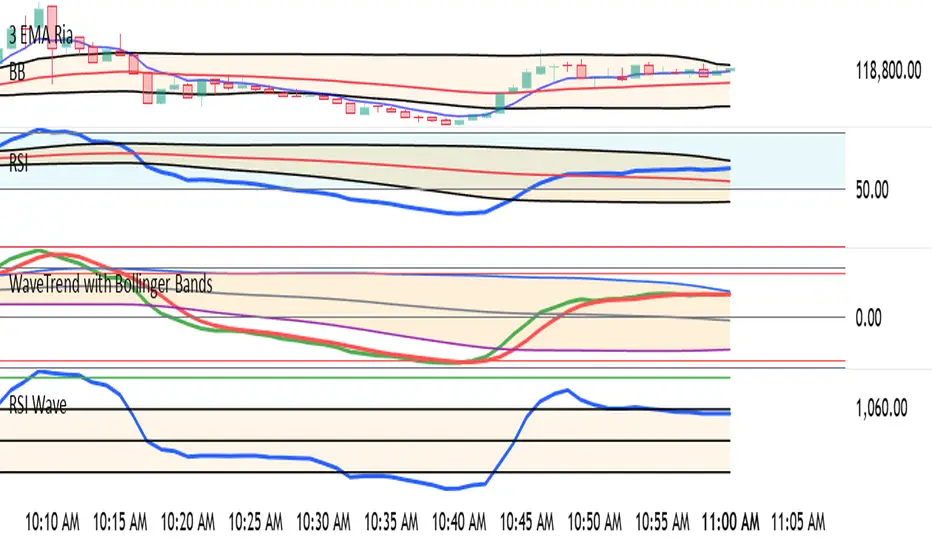
WaveTrend with Bollinger BandsPlots TTM Squeeze momentum histogram (green/red).
Plots RSI (blue) in the same pane.
Shows squeeze dots and RSI overbought/oversold lines.
Wavetrend strategy with trading session for any time chartHello there
Today I am glad to provide you a strategy based on the wave trend oscillator. If you want to use it as an indicator, just disable long and short to not make any shops.
It works on all time frames.
The way it works its like an RSI .
We have overbought and oversold levels, and together with a channel and length we calculate the wave trend.
And then like in RSI, when we cross those lines we buy or sell depending on which lines we cross.
For risk management, so far its not implemented, but it can be done in many ways.
The only thing I applied is to always close a trade at the end of friday day. At the same time it can be applied the rule to sell when % of equity is lost, or at the end of a trading session like london,neywork and so on.
For any questions or doubts, let me know.
Hope you enjoy it :)

WaveTrend mtfThis is based on Lazy Bear famous script of Wave trend
So in basic we do MTF on it
One can choose to use the signal of the MTF (circles red or green for buy and sell)
or the regular buy and sell by cross green /red
to the script one can add if it cross the 0 above or bellow (not done here)
the MTF is taken from pinescripter example how to avoid repainting , so it good also for using your indicator to make MTF scripts
alerts included

WaveTrend with Crosses and Alerts - Jab ZootaLazy bear created this script. I added alertconditions to send alerts on crossovers.

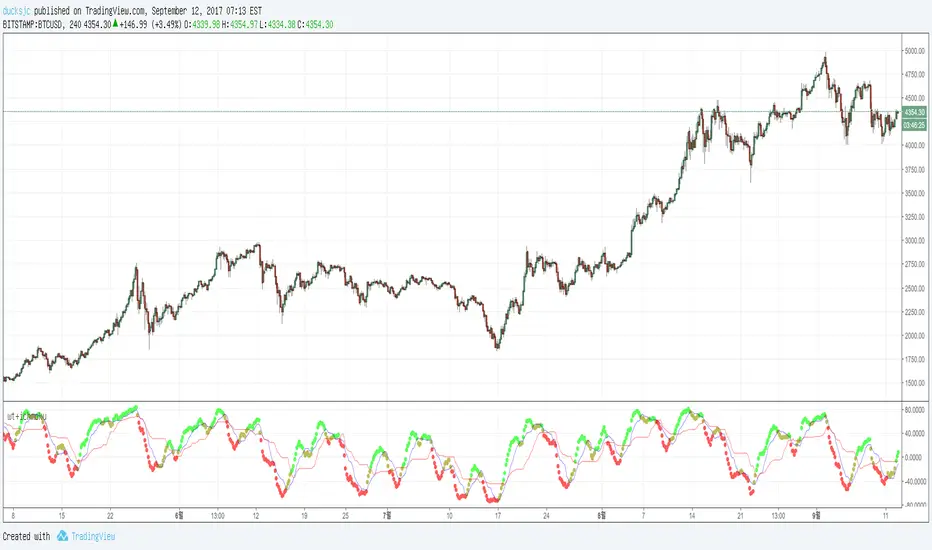
wt+ichmokuwaveTrend is very very very nice script.
and i also like ichmoku
yesterday 'nssoholik' gave me some idea that is rsi+ichmoku
and this is wt+ichmoku
easily
red to green = buy
green to red = sell
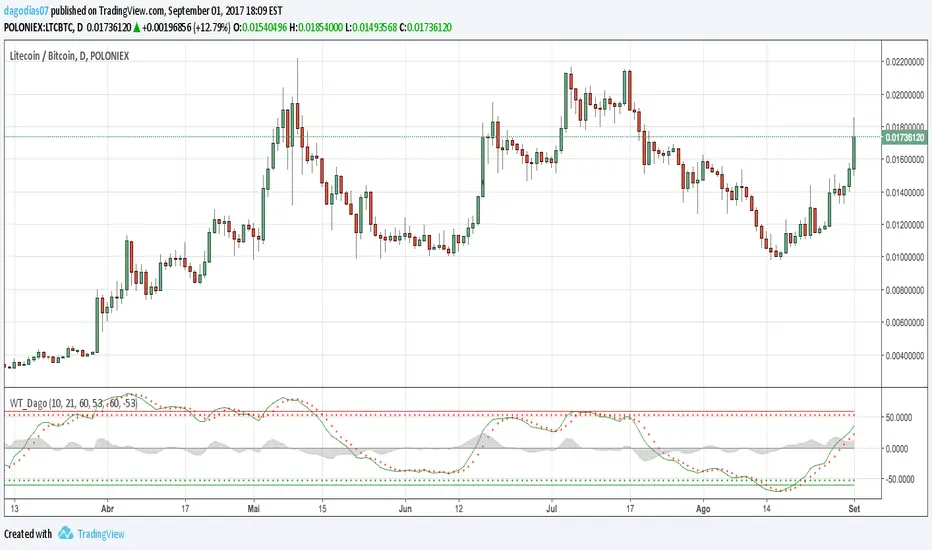
WaveTrend [DagoDias]@author LazyBear -- Modificado por Dagodias adicionado títulos às variáveis e traduzido para o Português.
Através dos títulos fica melhor para customizar o indicador e criar alertas a partir do indicador.
Para utilização em Criptomoedas acredito ser interessante suavemente levantar as linhas base; tornando a área de sobre venda antecipada.
Este indicador não é recomendado para fortes tendências.
WaveTrend [MastroFran]Great indicator to show short term price movements. 5 day moving average oscillator. When green crosses red and under the 60 mark, buy with caution. when over the 60 mark and red crosses green sell immediately for highest profits.

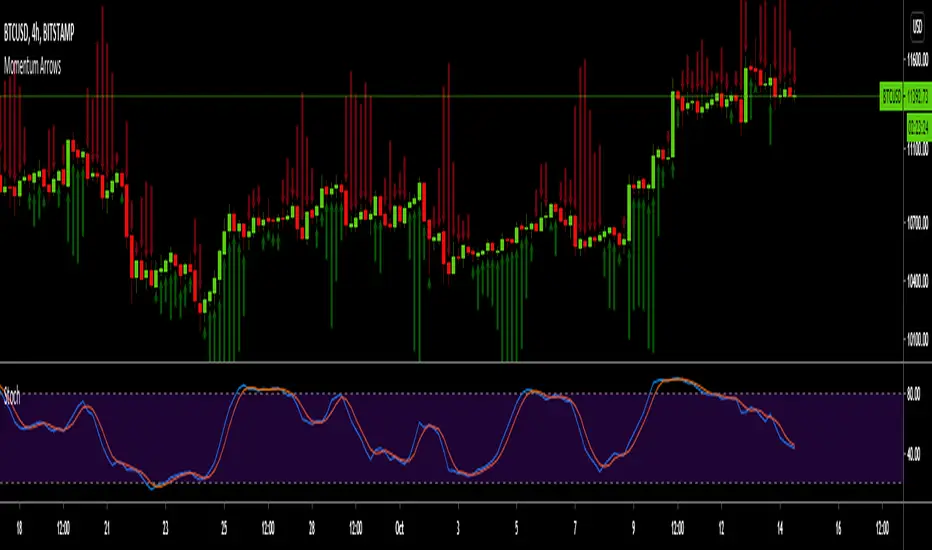
Momentum ArrowsThis simple indicators paints the Momentum based on Stochastic, RSI or WaveTrend onto the Price Chart by showing Green or Red arrows.
In the settings it can be selected which indicator is used, Stochastic is selected by default.
Length of the arrows is determined by the strength of the momentum:
Stochastic: Difference between D and K
RSI: Difference from RSI-50
WaveTrend: Difference between the Waves
(Thanks to @LazyBear for the WaveTrend inspiration)
PS:
If anyone has an idea how to conditionally change the color of the arrows, then please let me know - that would be the icing on the cake. Then it would be possible to indicate Overbought/Oversold levels with different colors.
Unfortunately it currently seems not to be possible to dynamically change the arrow colour.
TradingGroundhog - Strategy & Fractal V1#-- Public Strategy - No Repaint - Fractals -- Short term
Here I come with another script, more simple than Wavetrend V1. You will love it.
#-- Synopsis --
Another simple idea, on a small time frame (15 min) we buy when the opening price goes below a Bottom fractals and sell when it goes over a Top fractals, but as this script do not use Wavetrends. You should stop by your self to use the script during long lasting downtrends.
I developed the strategy using BTC /EUR 3 MIN BINANCE but it can be applied to many other cryptos, I don't know for forex or others. You can use it for short term (to a month of uptrend) and automated trading.
#-- Graph reading --
And now, how to read it ?
Fractals:
Yellow Flags occur when the opening price goes below a Bottom fractal , it means Buy.
White Flags appear when the opening price goes over a Top fractal , it means Sell.
#-- Parameters --
*** Parameters have been intensively optimized using 10 cryptocurrency markets in order to have potent efficiency for each of them. I would recommend to only change the Can Be touch parameter. For the others, I don't recommend any modifications. The idea behind the script is to be able to switch between markets without having to optimize parameters, less work, easy to target active crypto and therefor limit the risks. ***
Can be touch :
'Filter fractals' : Activate or Disable the filtering fractal operation. If Enable, buy during less risky periods. (Activate is often better)
Can be touch but not necessary :
'VolumeMA' : The Volume corrector used by the fractals
'Extreme window' : The number of price individuals to look for if we want to remove extreme fractals.
Not to touch :
'Long Sop Loss (%)' : The minimal difference of price between a Fractal bottom and the opening price to buy.
#-- Time frame --
Should be used with the following time frames depending on the necessity:
1 MIN
3 MIN (Preferred with the parameters set)
5 MIN
#-- Last words --
The script can be set up to send Tradingview signals to 3comma just by adding comment = " " in strategy.close_all() and strategy.entry().
Good trades !
Disclaimer (As it should always be one to any script)
***
This script is intended for and only to be used for personal purposes only. No such information provided by it constitutes advice or a recommendation for any investment or trading strategy for any specific person. There is no guarantee presented or implied as to the accuracy of specific forecasts, projections, or predictive statements offered by the script. Users of the script agree that its original developer does not take responsibility for any of your investment decisions. Please seek professional advice before trading.
***
# Here are the results from the 20rst of September 2021 with 100% of equity on the BTC /EUR 3 Min and with a capital of 10 000 EUR. So almost, one month.
# As I saw, it goes from +30% to more than +160% (the great SHIB) depending on the selected crypto. It may be negative if you spot a downtrend.

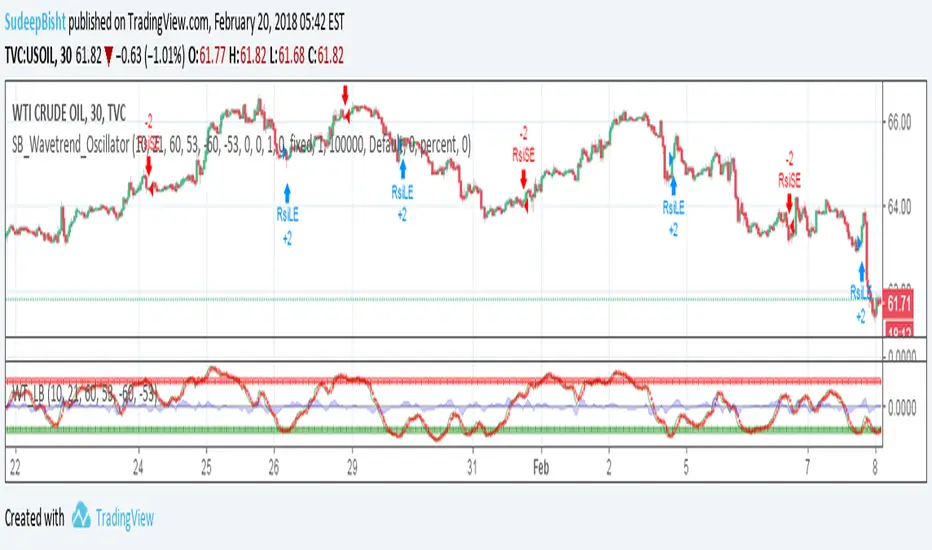
SB_Wavetrend_OscillatorA take on LazyBear's Wavetrend_Oscillator
The idea is bit modified.
Original Idea:
When the oscillator is above the overbought band (red lines) and crosses down the signal (dotted line), it is usually a good SELL signal. Similarly, when the oscillator crosses above the signal when below the Oversold band (green lines), it is a good BUY signal.
Modified Idea:
Carrying the original idea, if the oscillator crosses the overbought band (red lines) and crosses down the signal (dotted line) twice without crossing the Oversold band (green lines) and crosses above the signal (dotted line), a buy or sell signal will take place when the oscillator crosses the dotted line and the value of oscillator is >0(if sell order is to be placed) and <0(if buy order is to be placed).
For the original idea you can refer to:
Let me know if any refinements could improve the oscillator.
Stochastic RSI - WT Confluence Signal Detectors (TraderDemircan)Description
What This Indicator Does:
This indicator combines two powerful momentum oscillators—WaveTrend and Stochastic RSI—to identify high-probability trading signals through confluence. Instead of relying on a single indicator that may generate false signals, this tool only triggers buy/sell alerts when both oscillators simultaneously confirm extreme market conditions and trend reversals. This confluence approach significantly reduces noise and helps traders focus on the most reliable setups.
Key Features:
Dual-Oscillator Confluence: Generates signals only when both WaveTrend crossovers and Stochastic RSI extreme levels align
Normalized Scale Display: Both oscillators are plotted on a unified -100 to +100 scale for easy visual comparison
Visual Signal Confirmation: Clear intersection points marked with colored circles, plus optional candle coloring at crossover moments
Customizable Thresholds: Adjust overbought/oversold levels for both oscillators to match your trading style and asset volatility
Clean Visual Presentation: Optional area fill showing WaveTrend momentum difference, making divergences easier to spot
How It Works:
The indicator operates on a confluence principle where multiple conditions must align:
For BUY Signals (Green):
WaveTrend 1 crosses above WaveTrend 2 (bullish crossover)
WaveTrend is in oversold territory (below -53 or -60)
Stochastic RSI K-line is below 20 (oversold)
For SELL Signals (Red):
WaveTrend 1 crosses below WaveTrend 2 (bearish crossover)
WaveTrend is in overbought territory (above 53 or 60)
Stochastic RSI K-line is above 80 (overbought)
WaveTrend Component:
Uses the hlc3 price (average of high, low, close) to calculate a channel index that identifies market momentum waves. The two WaveTrend lines (WT1 and WT2) act similarly to MACD, where crossovers indicate momentum shifts. The oscillator ranges from approximately -100 to +100, with extreme values suggesting potential reversals.
Stochastic RSI Component:
Applies stochastic calculations to RSI values rather than raw price, creating a more sensitive momentum indicator. Values above 80 indicate overbought conditions (potential selling opportunity), while values below 20 indicate oversold conditions (potential buying opportunity). The indicator includes both K-line (faster) and D-line (slower, smoothed) for additional confirmation.
Normalization Technology:
To enable direct visual comparison, the Stochastic RSI (normally 0-100 scale) is normalized to match WaveTrend's -100 to +100 scale. This allows traders to see both oscillators' movements in relation to the same reference levels, making divergences and convergences more apparent.
How to Use:
For Trend Traders:
Wait for confluence signals in the direction of the larger trend
Use buy signals in uptrends as entry points during pullbacks
Use sell signals in downtrends as entry points during bounces
For Reversal Traders:
Focus on confluence signals at major support/resistance levels
Look for divergences between price and oscillators before confluence signals
Consider stronger signals when both oscillators reach extreme levels (WT beyond ±60, Stoch beyond 20/80)
For Scalpers:
Lower the WaveTrend Channel Length (default 10) to 5-7 for more frequent signals
Tighten overbought/oversold thresholds slightly (e.g., WT: ±50, Stoch: 30/70)
Use on lower timeframes (5m, 15m) with strict stop losses
Settings Guide:
WaveTrend Parameters:
Channel Length (10): Controls sensitivity. Lower = more signals but more noise. Higher = fewer but more reliable signals
Average Length (21): Smoothing period for WT2. Higher values reduce whipsaws
Overbought Levels (60/53): Two-tier system. Breaching 60 indicates strong overbought, 53 is moderate
Oversold Levels (-60/-53): Mirror of overbought levels for downside extremes
Stochastic RSI Parameters:
K-Smooth (3): Smoothing for the K-line. Higher = smoother but delayed
D-Smooth (3): Additional smoothing for the D-line signal
RSI Period (14): Standard RSI calculation period
Stoch Period (14): Stochastic calculation lookback
Oversold (20) / Overbought (80): Classic thresholds for extreme conditions
Visual Options:
Show WT Difference Area: Displays the momentum difference between WT1 and WT2 as a blue shaded area
Show WT Intersection Points: Marks crossover points with colored circles (red for bearish, green for bullish)
Color Candles at Intersection: Changes candle colors at crossover moments (blue for bearish, yellow for bullish)
Show Stoch Over Signals: Displays when Stochastic RSI breaches extreme levels
What Makes This Original:
While WaveTrend and Stochastic RSI are established indicators, this script's originality lies in:
Confluence Logic: The specific combination requiring simultaneous confirmation from both oscillators in extreme zones, not just simple crossovers
Normalization Approach: Displaying both oscillators on the same -100 to +100 scale for direct visual comparison, which is not standard
Multi-Tier Overbought/Oversold: Using two levels (60/53) instead of one, allowing for nuanced signal strength assessment
Integrated Visual System: Combining area fills, intersection markers, and candle coloring in a coordinated display that shows momentum flow at a glance
Important Considerations:
This is a momentum-based oscillator system, which performs best in ranging or trending markets with clear swings
In strong trending markets, the oscillator may remain in extreme zones for extended periods (remain overbought during strong uptrends, oversold during strong downtrends)
Confluence signals are intentionally rare to maintain quality—expect fewer signals than with single-indicator systems
Always combine with price action analysis, support/resistance levels, and proper risk management
Not recommended for extremely low volatility or thin markets where oscillators may produce erratic readings
Best Timeframes:
Intraday: 15m, 1H (with tighter parameters)
Swing Trading: 4H, Daily (with default parameters)
Position Trading: Daily, Weekly (with extended Channel Length 15-20)
Typical Use Cases:
Identifying exhaustion points in trending markets
Timing entries during pullbacks in established trends
Spotting potential reversal zones at key price levels
Filtering out weak momentum signals during consolidation

Ultimate Multi-Asset Correlation System by able eiei Ultimate Multi-Asset Correlation System - User Guide
Overview
This advanced TradingView indicator combines WaveTrend oscillator analysis with comprehensive multi-asset correlation tracking. It helps traders understand market relationships, identify regime changes, and spot high-probability trading opportunities across different asset classes.
Key Features
1. WaveTrend Oscillator
Main Signal Lines: WT1 (blue) and WT2 (red) plot momentum and its moving average
Overbought/Oversold Zones: Default levels at +60/-60
Cross Signals:
🟢 Bullish: WT1 crosses above WT2 in oversold territory
🔴 Bearish: WT1 crosses below WT2 in overbought territory
Higher Timeframe (HTF) Analysis: Shows WT1 from 4H, Daily, and Weekly timeframes for trend confirmation
2. Multi-Asset Correlation Tracking
Monitors relationships between:
Major Assets: Gold (XAUUSD), Dollar Index (DXY), US 10-Year Yield, S&P 500
Crypto Assets: Bitcoin, Ethereum, Solana, BNB
Cross-Asset Analysis: Correlation between traditional markets and crypto
3. Market Regime Detection
Automatically identifies market conditions:
Risk-On: High correlation + positive sentiment (🟢 Green background)
Risk-Off: High correlation + negative sentiment (🔴 Red background)
Crypto-Risk-On: Strong crypto correlations (🟠 Orange background)
Low-Correlation: Divergent market behavior (⚪ Gray background)
Neutral: Mixed signals (🟡 Yellow background)
How to Use
Basic Setup
Add to Chart: Apply the indicator to any chart (works on all timeframes)
Choose Display Mode (Display Options):
All: Shows everything (recommended for comprehensive analysis)
WaveTrend Only: Focus on momentum signals
Correlation Only: View market relationships
Heatmap Only: Simplified correlation view
Enable Asset Groups:
✅ Major Assets: Traditional markets (stocks, bonds, commodities)
✅ Crypto Assets: Digital currencies
Mix and match based on your trading focus
Reading the Charts
WaveTrend Section (Bottom Panel)
Above 0 = Bullish momentum
Below 0 = Bearish momentum
Above +60 = Overbought (potential reversal)
Below -60 = Oversold (potential bounce)
Lighter lines = Higher timeframe trends
Correlation Histogram (Colored Bars)
Blue bars: Major asset correlations
Orange bars: Crypto correlations
Purple bars: Cross-asset correlations
Bar height: Correlation strength (-50 to +50 scale)
Background Color
Intensity reflects correlation strength
Color shows market regime
Dashboard Elements
🎯 Market Regime Analysis (Top Left)
Current Regime: Overall market condition
Average Correlation: Strength of relationships (0-1 scale)
Risk Sentiment: -100% (risk-off) to +100% (risk-on)
HTF Alignment: Multi-timeframe trend agreement
Signal Quality: Confidence level for current signals
📊 Correlation Matrix (Top Right)
Shows correlation values between asset pairs:
1.00: Perfect positive correlation
0.75+: Strong correlation (🟢 Green)
0.50+: Medium correlation (🟡 Yellow)
0.25+: Weak correlation (🟠 Orange)
Below 0.25: Negative/no correlation (🔴 Red)
🔥 Correlation Heatmap (Bottom Right)
Visual matrix showing:
Gold vs. DXY, BTC, ETH
DXY vs. BTC, ETH
BTC vs. ETH
Color-coded strength
📈 Performance Tracker (Bottom Left)
Tracks individual asset momentum:
WT1 Values: Current momentum reading
Status: OB (overbought) / OS (oversold) / Normal
Trading Strategies
1. High-Probability Trend Following
✅ Entry Conditions:
WaveTrend bullish/bearish cross
HTF Alignment matches signal direction
Signal Quality > 70%
Correlation supports direction
2. Regime Change Trading
🎯 Watch for regime shifts:
Risk-Off → Risk-On = Consider long positions
High correlation → Low correlation = Reduce position size
Crypto-Risk-On = Focus on crypto longs
3. Divergence Trading
🔍 Look for:
Strong correlation breakdown = Potential volatility
Cross-asset correlation surge = Follow the leader
Volume-price correlation extremes = Trend confirmation
4. Overbought/Oversold Reversals
⚡ Trade reversals when:
WT crosses in extreme zones (-60/+60)
HTF alignment shows opposite trend weakening
Correlation confirms mean reversion setup
Customization Tips
Fine-Tuning Parameters
WaveTrend Core:
Channel Length (10): Lower = more sensitive, Higher = smoother
Average Length (21): Adjust for your timeframe
Correlation Settings:
Length (50): Longer = more stable, Shorter = more responsive
Smoothing (5): Reduce noise in correlation readings
Market Regime:
Risk-On Threshold (0.6): Lower = earlier regime signals
High Correlation Threshold (0.75): Adjust sensitivity
Custom Asset Selection
Replace default symbols with your preferred markets:
Major Assets: Any forex, indices, bonds
Crypto: Any digital currencies
Must use correct exchange prefix (e.g., BINANCE:BTCUSDT)
Alert System
Enable "Advanced Alerts" to receive notifications for:
✅ Market regime changes
✅ Correlation breakdowns/surges
✅ Strong signals with high correlation
✅ Extreme volume-price correlation
✅ Complete HTF alignment
Correlation Interpretation Guide
ValueMeaningTrading Implication+0.75 to +1.0Strong positiveAssets move together+0.5 to +0.75Moderate positiveGenerally aligned+0.25 to +0.5Weak positiveLoose relationship-0.25 to +0.25No correlationIndependent movements-0.5 to -0.25Weak negativeSlight inverse relationship-0.75 to -0.5Moderate negativeTend to move opposite-1.0 to -0.75Strong negativeStrongly inversely correlated
Best Practices
Use Multiple Timeframes: Check HTF alignment before trading
Confirm with Correlation: Strong signals work best with supportive correlations
Watch Regime Changes: Adjust strategy based on market conditions
Volume Matters: Enable volume-price correlation for confirmation
Quality Over Quantity: Trade only high-quality setups (>70% signal quality)
Common Patterns to Watch
🔵 Risk-On Environment:
Gold-BTC positive correlation
DXY negative correlation with risk assets
High crypto correlations
🔴 Risk-Off Environment:
Flight to safety (Gold up, stocks down)
DXY strength
Correlation breakdowns
🟡 Transition Periods:
Low correlation across assets
Mixed HTF signals
Use caution, reduce position sizes
Technical Notes
Calculation Period: Uses HLC3 (average of high, low, close)
Correlation Window: Rolling correlation over specified length
HTF Data: Accurately calculated using security() function
Performance: Optimized for real-time calculation on all timeframes
Support
For optimal performance:
Use on 15-minute to daily timeframes
Enable only needed asset groups
Adjust correlation length based on trading style
Combine with your existing strategy for confirmation
Enjoy comprehensive multi-asset analysis! 🚀

MFx Radar (Money Flow x-Radar)Description:
MFx Radar is a precision-built multi-timeframe analysis tool designed to identify high-probability trend shifts and accumulation/distribution events using a combination of WaveTrend dynamics, normalized money flow, RSI, BBWP, and OBV-based trend biasing.
Multi-Timeframe Trend Scanner
Analyze trend direction across 5 customizable timeframes using WaveTrend logic to produce a clear trend consensus.
Smart Money Flow Detection
Adaptive hybrid money flow combines CMF and MFI, normalized across lookback periods, to pinpoint shifts in accumulation or distribution with high sensitivity.
Event-Based Labels & Alerts
Minimalist "Accum" and "Distr" text labels appear at key inflection points, based on hybrid flow flips — designed to highlight smart money moves without clutter.
Trigger & Pattern Recognition
Built-in logic detects anchor points, trigger confirmations, and rare "Snake Eye" formations directly on WaveTrend, enhancing trade timing accuracy.
Visual Dashboard Table
A real-time table provides score-based insight into signal quality, trend direction, and volume behavior, giving you a full picture at a glance.
MFx Radar helps streamline discretionary and system-based trading decisions by surfacing key confluences across price, volume, and momentum all while staying out of your way visually.
How to Use MFx Radar
MFx Radar is a multi-timeframe market intelligence tool designed to help you spot trend direction, momentum shifts, volume strength, and high-probability trade setups using confluence across price, flow, and timeframes.
Where to find settings To see the full visual setup:
After adding the script, open the Settings gear. Go to the Inputs tab and enable:
Show Trigger Diamonds
Show WT Cross Circles
Show Anchor/Trigger/Snake Eye Labels
Show Table
Show OBV Divergence
Show Multi-TF Confluence
Show Signal Score
Then, go to the Style tab to adjust colors and fills for the wave plots and hybrid money flow. (Use published chart as a reference.)
What the Waves and Colors Mean
Blue WaveTrend (WT1 / WT2). These are the main momentum waves.
WT1 > WT2 = bullish momentum
WT1 < WT2 = bearish momentum
Above zero = bullish bias
Below zero = bearish bias
When WT1 crosses above WT2, it often marks the beginning of a move — these are shown as green trigger diamonds.
VWAP-MACD Line
The yellow fill helps spot volume-based momentum.
Rising = trend acceleration
Use together with BBWP (bollinger band width percentile) and hybrid money flow for confirmation.
Hybrid Money Flow
Combines CMF and MFI, normalized and smoothed.
Green = accumulation
Red = distribution
Transitions are key — especially when price moves up, but money flow stays red (a divergence warning).
This is useful for spotting fakeouts or confirming smart money shifts.
Orange Vertical Highlights
Shows when price is rising, but money flow is still red.
Often a sign of hidden distribution or "exit pump" behavior.
Table Dashboard (Bottom-Right)
BBWP (Volatility Pulse)
When BBWP is low (<20), it signals consolidation — a breakout is likely to follow.
Use this with ADX and WaveTrend position to anticipate directional breakouts.
Trend by ADX
Shows whether the market is trending and in which direction.
Combined with money flow and RSI, this gives strong confirmation on breakouts.
OBV HTF Bias
Gives higher timeframe pressure (bullish/bearish/neutral).
Helps avoid taking counter-trend trades.
Pattern Labels (WT-Based)
A = Anchor Wave — WT hitting oversold
T = Trigger Wave — WT turning back up after anchor
👀 = Snake Eyes — Rare pattern, usually signaling strong reversal potential
These help in timing entries, especially when they align with other signals like BBWP breakouts, confluence, or smart money flow flips.
Multi-Timeframe (MTF) Consensus
The system checks WaveTrend on 5 different timeframes and gives:
Color-coded signals on each TF
A final score: “Mostly Up,” “Mostly Down,” or “Mixed”
When MTFs align with wave crosses, BBWP expansion, and hybrid money flow shifts, the probability of sustained move is higher.
Divergence Spotting (Advanced Tip)
Watch for:Price rising while money flow is red → Possible trap / early exit
Price dropping while money flow is green → Early accumulation
Combine this with anchor-trigger patterns and MTF trend support for spotting bottoms or tops early.
Final Tips
Use WT trigger crosses as initial signal. Confirm with money flow direction + color flip
Look at BBWP for breakout timing. Use table as your decision dashboard
Favor trades that align with MTF consensus

Master Crypto Overlay [R2D2]The Gemini Master Crypto Overlay: User Guide
1. Introduction
The Gemini Master Crypto Overlay is a professional-grade TradingView script designed to consolidate six powerful institutional indicators into a single, clean "heads-up display" (HUD).
Instead of cluttering your chart with multiple sub-windows (which shrinks your view of the price), this script uses smart overlays and a data dashboard to provide actionable data instantly. It is optimized for the Daily timeframe as requested, but functions on all timeframes.
Included Indicators:
Ichimoku Cloud: Identifies the primary trend and support/resistance zones.
MACD (Custom Crypto Settings): Optimized (3-10-16) for catching fast crypto moves.
WaveTrend Oscillator: Visual signals for Overbought/Oversold entries.
Supertrend: A trailing stop-loss line to keep you in profitable trades.
Ultimate RSI (MTF): Multi-timeframe analysis to ensure you are trading with the higher trend.
Volume Reference (VWAP): An on-chart proxy for Volume Profile to spot fair value.
2. Installation Instructions
Step 1: Open Pine Editor
Launch your chart on TradingView.
At the bottom of the screen, click the tab labeled Pine Editor.
Step 2: Paste the Code
Delete any text currently in the editor window.
Copy the code block at the bottom of this response.
Paste it into the editor.
Step 3: Save and Add
Click "Save" (top right of the editor) and name it "Master Crypto Overlay".
Click "Add to chart".
Note: You may hide the "Pine Editor" panel now by clicking the arrow at the bottom center of the screen.
3. How to Use the Interface
The script is designed to be intuitive. Here is what you are looking at:
A. The Dashboard (Bottom Right)
This is your "Confluence Checker." It summarizes the status of the major indicators in real-time.
GREEN: Bullish (Buy/Hold)
RED: Bearish (Sell/Short)
GRAY: Neutral/Choppy (Stay out)
Pro Tip: Do not enter a trade unless at least 3 out of 4 signals on the dashboard match your direction.
B. On-Chart Signals
Clouds (Red/Green): If the cloud is Green and rising, only look for Long trades. If Red, only look for Short trades.
Supertrend Line: This continuous line trails the price. If price is above it (Green line), you are safe. If price closes below it, the trend has reversed.
MACD Labels: Small "MACD" text appears when momentum flips.
WaveTrend Circles:
Blue Circle (Bottom): Price is "Oversold." Good time to buy if the trend is up.
Orange Circle (Top): Price is "Overbought." Good time to take profit.
4. Strategy: Maximizing Trading Returns
To make money with this script, you need a rule-based system. Do not just blindly click when you see a label. Use this "Trend & Trigger" strategy:
The "Golden Entry" (High Probability Long)
Trend Check: Ensure price is ABOVE the Ichimoku Cloud.
Dashboard Check: Verify the RSI Status says "BULL (>50)".
The Trigger: Wait for a pullback where price touches the Supertrend Line (Green) or the top of the Cloud.
The Entry: Enter the trade when a Blue WaveTrend Circle appears OR a MACD Buy Label prints.
Stop Loss: Place your stop loss slightly below the Supertrend line.
The "Exit Strategy" (Protecting Profits)
Conservative: Sell half your position when an Orange WaveTrend Circle appears.
Trend Follower: Hold the rest of your position until the Supertrend Line turns RED.

GT 5.1 Strategy═════════════════════════════════════════════════════════════════════════
█ OVERVIEW
People often look an indicator in their technical analysis to enter a position. We may also need to look at the signals of one or more indicators to verify the signals given by some indicators. In this context, I developed a strategy to test whether it really works by choosing some of the indicators that capture trend changes with the same characteristics. Also, since the subject is to catch the trend change, I thought it would be right to include an indicator using the heikin ashi logic. By averaging and smoothing the market noise, Heiken Ashi makes it easier to detect the direction of the trend helps to see possible reversal points on the chart. However, it should be noted that Heiken Ashi is a lagging indicator.
I picked 5 different indicators (but their purpose are similar) and combined them to produce buy and sell signals based on your choice(not repaint). First of all let's get some information about our indicators. So you will understand me why i picked these indicators and what is the meaning of their signals.
1 — Coral Trend Indicator by LazyBear
Coral Trend Indicator is a linear combination of moving averages, all obtained by a triple or higher order exponential smoothing. The indicator comes with a trend indication which is based on the normalized slope of the plot. the usage of this indicator is simple. When the color of the line is green that means the market is in uptrend. But when the color is red that means the market is in downtrend.
As you see the original indicator it is simple to find is it in uptrend or downtrend.
So i added a code to find when the color of the line change. When it turns green to red my script giving sell signals, when it turns red to green it gives buy signals.
I hide the candles to show you more clearly what is happening when you choose only Coral Strategy. But sometimes it is not enough only using itself. Even if green dots turn to red it continues in uptrend. So we need a to look another indicator to approve our signal.
2 — SSL channel by ErwinBeckers
Known as the SSL , the Semaphore Signal Level channel is an indicator that combines moving averages to provide you with a clear visual signal of price movement dynamics. In short, it's designed to show you when a price trend is forming. This indicator creates a band by calculating the high and low values according to the determined period. Simply if you decide 10 as period, it calculates a 10-period moving average on the latest 10 highs. Calculate a 10-period moving average on the latest 10 lows. If the price falls below the low band, the downtrend begins, if the price closes above the high band, the uptrend begins. Lets look the original form of indicator and learn how it using.
If the red line is below and the green band is above, it means that we are in uptrend, and if it is on the opposite side, it means that we are in downtrend. Therefore, it would be logical to enter a position where the trend has changed. So i added a code to find when the crossover has occured.
As you see in my strategy, it gives you signals when the trend has changed. But sometimes it is not enough only using this indicator itself. So lets look 2 indicator together in one chart.
Look circle SSL is saying it is in downtrend but Coral is saying it has entered in uptrend. if we just look to coral signal it can misleads us. So it can be better to look another indicator for validating our signals.
3 — Heikin Ashi RSI Oscillator by JayRogers
The Heikin-Ashi technique is used by technical traders to identify a given trend more easily. Heikin-Ashi has a smoother look because it is essentially taking an average of the movement. There is a tendency with Heikin-Ashi for the candles to stay red during a downtrend and green during an uptrend, whereas normal candlesticks alternate color even if the price is moving dominantly in one direction. This indicator actually recalculates the RSI indicator with the logic of heikin ashi. Due to smoothing, the bars are formed with a slight lag, reflecting the trend rather than the exact price movement. So lets look the original version to understand more clearly. If red bars turn to green bars it means uptrend may begin, if green bars turn to red it means downtrend may begin.
As you see HARSI giving lots of signal some of them is really good but some of them are not very well. Because it gives so much signals Now i will change time period and lets look same chart again.
Now results are better because of heikin ashi's logic. it is not suitable for day traders, it gives more accurate result when using the time period is longer. But it can be useful to use this indicator in short time periods using with other indicators. So you may catch the trend changes more accurately.
4 — MACD DEMA by ToFFF
This indicator uses a double EMA and MACD algorithm to analyze the direction of the trend. Though it might seem a tough task to manage the trades with the help of MACD DEMA once you know how the proper way to interpret the signal lines, it will be an easy task.
This indicator also smoothens the signal lines with the time series algorithm which eventually makes the higher time frame important. So, expecting better results in the lower time frame can result in big losses as the data reading from the MACD DEMA will not be accurate. In order to understand the function of this indicator, you have to know the functions of the EMA also.
The exponential moving average tends to give more priority to the recent price changes. So, expecting better results when the volatility is very high is a very risky approach to trade the market. Moreover, the MACD has some lagging issues compared to the EMA, so it is super important to use a trading method that focuses on the higher time frame only. What does MACD 12 26 Close 9 mean? When the DEMA-9 crosses above the MACD(12,26), this is considered a bearish signal. It means the trend in the stock – its magnitude and/or momentum – is starting to shift course. When the MACD(12,26) crosses above the DEMA-9, this is considered a bullish signal. Lets see this indicator on Chart.
When the blue line crossover red line it is good time to buy. As you see from the chart i put arrows where the crossover are appeared.
When the red line crossover blue line it is good time to sell or exit from position.
5 — WaveTrend Oscillator by LazyBear
This is a technical indicator that creates high and low bands between two values. It then creates a trend indicator that draws waves with highs and lows within these boundaries. WaveTrend is a widely used indicator for finding direction of an asset.
Calculation period: number of candles used to calculate WaveTrend, defaults to 10. Averaging period: number of candles used to average WaveTrend, defaults to 21.
As you see in chart when the lines crossover occured my strategy gives buy or sell signals.
═════════════════════════════════════════════════════════════════════════
█ HOW TO USE
I hope you understand how the indicators I mentioned above work and what they are used for. Now, I will explain in detail how to use the strategy I have created.
When you enter the settings section, you will see 5 types of indicators. If you want to use the signals of the indicators, simply tick the box next to the indicators. Also, under each option there is an area where you can set the "lookback". This setting is a field that will make the signals overlap when you select more than one option. If you are going to trade with only one option, you should make sure that this field is 0. Otherwise, it may continue to generate as many signals as you choose.
Lets see in chart for easy understanding.
As you see chart, if i chose only HARSI with lookback 0 (HARSI and CORAL should be 1 minumum because of algorithm-we looking 1 bar before, others 0 because we are looking crossovers), it will give signals only when harsı bar's color changed. But when i changed Lookback as 7 it will be like this in chart.
Now i will choose 2 indicator with settings of their lookback 0.
As you see it will give signals when both of them occurs same time. But HARSI is an indicator giving very early signal so we can enter position 5-6 bars after the first bar color change. So i will change HARSI Lookback settings as 7. Lets look what happens when we use lookback option.
So it wil be useful to change lookback settings to find best signals in each time period and in each symbol. But it shouldnt be too high. Because you can be late to catch trend's starting.
this is an image of MACD and WAVE trend used and lookback option are both 6.
Now lets see an example with 3 options are chosen with lookback option 11-1-5
Now lets talk about indicators settings. After strategy options you will see each indicators settings, you can change their settings as you desired. So each indicators signal will be changed according to your adjustment.
I left strategy options with default settings. You can change it manually as if you want.
═════════════════════════════════════════════════════════════════════════
█ LIMITATIONS: Don't rely on non-standard charts results. For example Heikin Ashi is a technical analysis method used with the traditional candlestick chart.Heikin Ashi vs. Candlestick Chart: The decisive visual difference between Heikin Ashi and the traditional chart is that Heikin Ashi flattens the traditional candlestick chart using a modified formula.
The primary advantage of Heikin Ashi is that it makes the chart more reader-friendly and helps users identify and analyze trends .
Because Heikin Ashi provides averaged price information rather than real-time price and reacts slowly to volatility — not suitable for scalpers and high-frequency traders. I added HARSI indicator as a supportive signal because it is useful with using CORAL and SSL channel indicators. If you change your candle types to Heikin Ashi , your profit will change in good way but dont rely on it.
═════════════════════════════════════════════════════════════════════════
█ THANKS:
Special thanks to authors of the scripts that i used.
@LazyBear and @ErwinBeckers and @JayRogers and @ToFFF
═════════════════════════════════════════════════════════════════════════
█ DISCLAIMER
Any trade decisions you make are entirely your own responsibility.

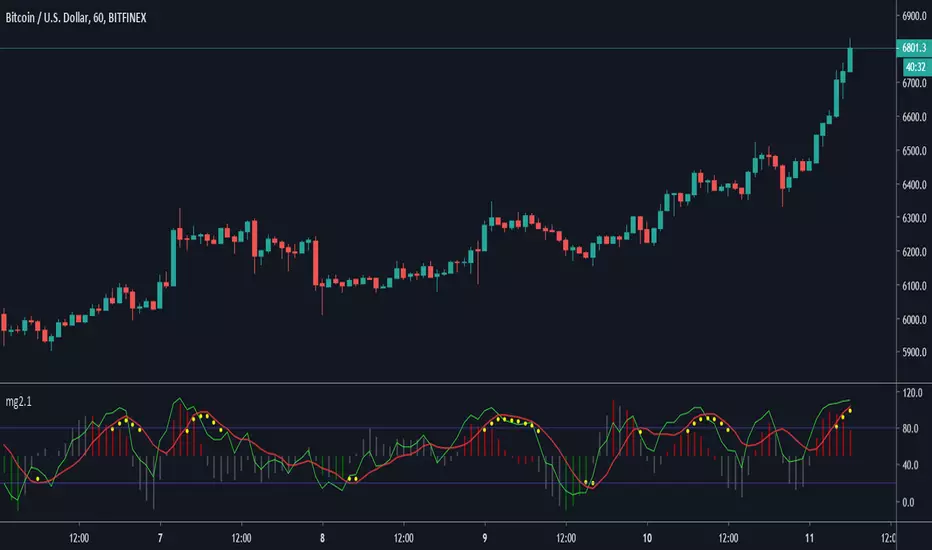
Minimal Godmode 2.1// Acknowledgments:
// Original Godmode Authors:
// @Legion, @LazyBear, @Ni6HTH4wK, @xSilas
// Drop a line if you use or modify this code.
// Godmode 3.1.4: @SNOW_CITY
// Godmode 3.2: @sco77m4r7in and @oh92
// Godmode3.2+LSMA: @scilentor
// Godmode 4.0.0-4.0.1: @chrysopoetics
// Jurik Moving Average: @everget
// Constance Brown Composite Index RSI: @LazyBear
// Wavetrend Oscillator: @fskrypt
// TTM Squeeze: @Greeny
// True TSI/RSI: @cI8DH and @chrysopoetics
// Laguerre RSI (Self-Adjusting Alpha with Fractals Energy): @everget
// RSI Shaded: @mortdiggiddy
// Minimal Godmode v2.0:
// 6 BTC pairs/exchanges (instead of 11) to reduce loading time from the pinescript security() function
// Volume Composite for engine calculation
// TTM Squeeze on Wavetrend Signal
// Constance Brown Composite Index RSI (CBCI)
// TrueTSI (Godmode 4.0.0 implementation)
// Laguerre RSI (LRSI)
// Minimal Godmode v2.1:
// Removed TTM Squeeze and Volume Composite
// EMA for Wavetrend Signal
// Multi-exchange for BTC no longer the default
// mg engine toggle for CBCI, Laguerre RSI, and TTSI
// Wavetrend Histogram component toggle
MLExtensionsLibrary "MLExtensions"
A set of extension methods for a novel implementation of a Approximate Nearest Neighbors (ANN) algorithm in Lorentzian space.
normalizeDeriv(src, quadraticMeanLength)
Returns the smoothed hyperbolic tangent of the input series.
Parameters:
src (float) : The input series (i.e., the first-order derivative for price).
quadraticMeanLength (int) : The length of the quadratic mean (RMS).
Returns: nDeriv The normalized derivative of the input series.
normalize(src, min, max)
Rescales a source value with an unbounded range to a target range.
Parameters:
src (float) : The input series
min (float) : The minimum value of the unbounded range
max (float) : The maximum value of the unbounded range
Returns: The normalized series
rescale(src, oldMin, oldMax, newMin, newMax)
Rescales a source value with a bounded range to anther bounded range
Parameters:
src (float) : The input series
oldMin (float) : The minimum value of the range to rescale from
oldMax (float) : The maximum value of the range to rescale from
newMin (float) : The minimum value of the range to rescale to
newMax (float) : The maximum value of the range to rescale to
Returns: The rescaled series
getColorShades(color)
Creates an array of colors with varying shades of the input color
Parameters:
color (color) : The color to create shades of
Returns: An array of colors with varying shades of the input color
getPredictionColor(prediction, neighborsCount, shadesArr)
Determines the color shade based on prediction percentile
Parameters:
prediction (float) : Value of the prediction
neighborsCount (int) : The number of neighbors used in a nearest neighbors classification
shadesArr (array) : An array of colors with varying shades of the input color
Returns: shade Color shade based on prediction percentile
color_green(prediction)
Assigns varying shades of the color green based on the KNN classification
Parameters:
prediction (float) : Value (int|float) of the prediction
Returns: color
color_red(prediction)
Assigns varying shades of the color red based on the KNN classification
Parameters:
prediction (float) : Value of the prediction
Returns: color
tanh(src)
Returns the the hyperbolic tangent of the input series. The sigmoid-like hyperbolic tangent function is used to compress the input to a value between -1 and 1.
Parameters:
src (float) : The input series (i.e., the normalized derivative).
Returns: tanh The hyperbolic tangent of the input series.
dualPoleFilter(src, lookback)
Returns the smoothed hyperbolic tangent of the input series.
Parameters:
src (float) : The input series (i.e., the hyperbolic tangent).
lookback (int) : The lookback window for the smoothing.
Returns: filter The smoothed hyperbolic tangent of the input series.
tanhTransform(src, smoothingFrequency, quadraticMeanLength)
Returns the tanh transform of the input series.
Parameters:
src (float) : The input series (i.e., the result of the tanh calculation).
smoothingFrequency (int)
quadraticMeanLength (int)
Returns: signal The smoothed hyperbolic tangent transform of the input series.
n_rsi(src, n1, n2)
Returns the normalized RSI ideal for use in ML algorithms.
Parameters:
src (float) : The input series (i.e., the result of the RSI calculation).
n1 (simple int) : The length of the RSI.
n2 (simple int) : The smoothing length of the RSI.
Returns: signal The normalized RSI.
n_cci(src, n1, n2)
Returns the normalized CCI ideal for use in ML algorithms.
Parameters:
src (float) : The input series (i.e., the result of the CCI calculation).
n1 (simple int) : The length of the CCI.
n2 (simple int) : The smoothing length of the CCI.
Returns: signal The normalized CCI.
n_wt(src, n1, n2)
Returns the normalized WaveTrend Classic series ideal for use in ML algorithms.
Parameters:
src (float) : The input series (i.e., the result of the WaveTrend Classic calculation).
n1 (simple int)
n2 (simple int)
Returns: signal The normalized WaveTrend Classic series.
n_adx(highSrc, lowSrc, closeSrc, n1)
Returns the normalized ADX ideal for use in ML algorithms.
Parameters:
highSrc (float) : The input series for the high price.
lowSrc (float) : The input series for the low price.
closeSrc (float) : The input series for the close price.
n1 (simple int) : The length of the ADX.
regime_filter(src, threshold, useRegimeFilter)
Parameters:
src (float)
threshold (float)
useRegimeFilter (bool)
filter_adx(src, length, adxThreshold, useAdxFilter)
filter_adx
Parameters:
src (float) : The source series.
length (simple int) : The length of the ADX.
adxThreshold (int) : The ADX threshold.
useAdxFilter (bool) : Whether to use the ADX filter.
Returns: The ADX.
filter_volatility(minLength, maxLength, useVolatilityFilter)
filter_volatility
Parameters:
minLength (simple int) : The minimum length of the ATR.
maxLength (simple int) : The maximum length of the ATR.
useVolatilityFilter (bool) : Whether to use the volatility filter.
Returns: Boolean indicating whether or not to let the signal pass through the filter.
backtest(high, low, open, startLongTrade, endLongTrade, startShortTrade, endShortTrade, isEarlySignalFlip, maxBarsBackIndex, thisBarIndex, src, useWorstCase)
Performs a basic backtest using the specified parameters and conditions.
Parameters:
high (float) : The input series for the high price.
low (float) : The input series for the low price.
open (float) : The input series for the open price.
startLongTrade (bool) : The series of conditions that indicate the start of a long trade.
endLongTrade (bool) : The series of conditions that indicate the end of a long trade.
startShortTrade (bool) : The series of conditions that indicate the start of a short trade.
endShortTrade (bool) : The series of conditions that indicate the end of a short trade.
isEarlySignalFlip (bool) : Whether or not the signal flip is early.
maxBarsBackIndex (int) : The maximum number of bars to go back in the backtest.
thisBarIndex (int) : The current bar index.
src (float) : The source series.
useWorstCase (bool) : Whether to use the worst case scenario for the backtest.
Returns: A tuple containing backtest values
init_table()
init_table()
Returns: tbl The backtest results.
update_table(tbl, tradeStatsHeader, totalTrades, totalWins, totalLosses, winLossRatio, winrate, earlySignalFlips)
update_table(tbl, tradeStats)
Parameters:
tbl (table) : The backtest results table.
tradeStatsHeader (string) : The trade stats header.
totalTrades (float) : The total number of trades.
totalWins (float) : The total number of wins.
totalLosses (float) : The total number of losses.
winLossRatio (float) : The win loss ratio.
winrate (float) : The winrate.
earlySignalFlips (float) : The total number of early signal flips.
Returns: Updated backtest results table.
