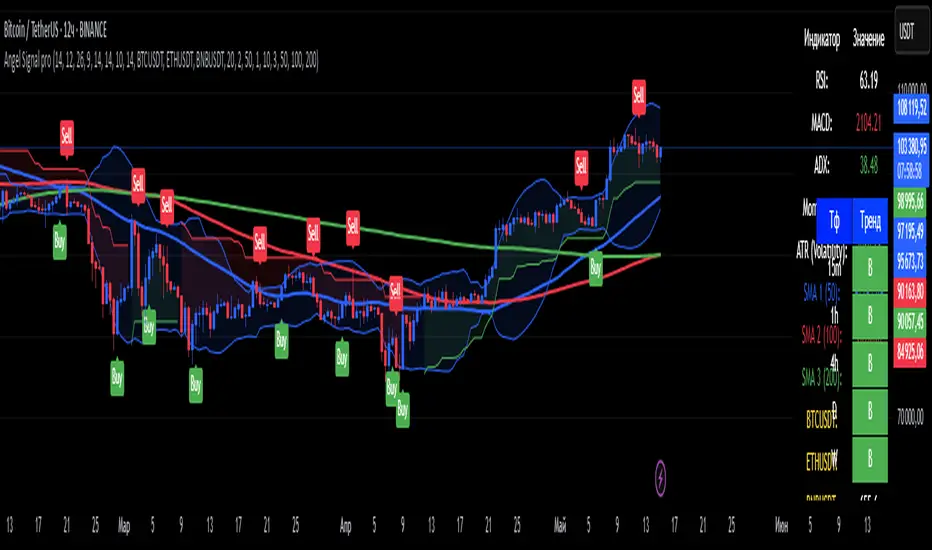
Angel Signal proAngel Signal Pro is a comprehensive technical analysis tool that integrates multiple indicators for a structured market assessment.
RSI, MACD, and ADX — evaluate trend strength and identify potential entry and exit points.
Momentum and ATR — measure price acceleration and volatility, assisting in risk management.
Stochastic Oscillator — detects overbought and oversold conditions.
SMA (50, 100, 200) — tracks key moving averages with the option to enable all at once.
Cryptocurrency price display — select and monitor real-time prices of any cryptocurrency available on the BINANCE exchange.
Automatic trend detection— classifies trends as bullish, bearish, or neutral based on RSI and MACD signals.
Customizable table — presents key indicator values in a structured and convenient format. The table also provides automatic trend detection across different timeframes (TF), allowing you to assess the current market situation more accurately on various levels.
Automatic gap detection — identifies market gaps, helping to spot potential trading opportunities.
Buy and sell signals — the system generates buy and sell signals based on the analysis of five key indicator values, allowing traders to respond quickly to market changes.
Bollinger Bands — helps assess market volatility and identify support and resistance levels, as well as potential reversal points, by detecting when prices move outside of normal volatility ranges.
Customization settings — in Angel Signal Pro, you can select which indicators and features you want to display. All elements can be turned on or off according to your preferences. There is also the ability to change colors and the appearance of each element, allowing you to tailor the interface to your personal preferences and make the tool more convenient to use.
Angel Signal Pro is suitable for traders of all experience levels and helps navigate market conditions with confidence.
29 мар.
Информация о релизе
Added Super Trend, improved the quality of buy and sell signals, and enhanced settings. Now, all toggle buttons for enabling and disabling indicators follow one another.
30 мар.
Информация о релизе
Fixed several errors in the settings and improved gap search.
Search in scripts for "adx"
nineLivesUtilLibLibrary "nineLivesUtilLib"
isDateInRange(currentTime, useTimeFilter, startDate, endDate)
Checks if the current time is within the specified date range.
Parameters:
currentTime (int) : The current bar's time (time).
useTimeFilter (bool) : Bool 📅: Enable the date range filter.
startDate (int) : Timestamp 📅: The start date for the filter.
endDate (int) : Timestamp 📅: The end date for the filter.
Returns: True if the current time is within the range or filtering is disabled, false otherwise.
@example
inDateRange = nineLivesUtilLib.isDateInRange(time, useTimeFilter, startDate, endDate)
if inDateRange
// Execute trading logic
checkVolumeCondition(currentVolume, useVolumeFilter, volumeThresholdMultiplier, volumeLength)
Checks if the current volume meets the threshold condition.
Parameters:
currentVolume (float) : The current bar's volume (volume).
useVolumeFilter (bool) : Bool 📊: Enable the volume filter.
volumeThresholdMultiplier (float) : Float 📊: Volume threshold relative to average (e.g., 1.5 for 1.5x average).
volumeLength (int) : Int 📊: Lookback length for the volume average.
Returns: True if the volume condition is met or filtering is disabled, false otherwise.
@example
volumeOk = nineLivesUtilLib.checkVolumeCondition(volume, useVolumeFilter, volumeThreshold, volumeLength)
if volumeOk
// Proceed with trading logic
checkMultiTimeframeCondition(currentClose, currentOpen, htfClose, htfOpen, useMultiTimeframe, alignment)
Checks alignment with higher timeframe direction.
Parameters:
currentClose (float) : Float: The current bar's closing price (close).
currentOpen (float) : Float: The current bar's opening price (open).
htfClose (float) : Float: The closing price from the higher timeframe (must be fetched by the calling script using request.security).
htfOpen (float) : Float: The opening price from the higher timeframe (must be fetched by the calling script using request.security).
useMultiTimeframe (bool) : Bool ⏱️: Enable multi-timeframe analysis.
alignment (string) : String ⏱️: Desired alignment ("same", "opposite", "any").
Returns: True if the timeframe alignment condition is met or analysis is disabled, false otherwise.
@example
// In the calling script:
= request.security(syminfo.tickerid, higherTimeframe, )
tfOk = nineLivesUtilLib.checkMultiTimeframeCondition(close, open, htfClose, htfOpen, useMultiTimeframe, tfAlignment)
if tfOk
// Proceed with trading logic
checkMarketRegime(useMarketRegime, regimeIndicator, regimeThreshold, regimeLength, regimeMode)
Detects the market regime (trending or ranging) and checks if trading is allowed.
Parameters:
useMarketRegime (bool) : Bool 🔍: Enable market regime detection.
regimeIndicator (string) : String 🔍: Indicator to use ("ADX" or "Volatility").
regimeThreshold (int) : Int 🔍: Threshold for trend strength/volatility.
regimeLength (simple int) : Int 🔍: Lookback length for the indicator.
regimeMode (string) : String 🔍: Trading mode based on regime ("trend_only", "range_only", "adaptive").
Returns: A tuple containing:
: conditionMet (bool) - True if trading is allowed based on the regime mode and detection, false otherwise.
: inTrendingRegime (bool) - True if the current regime is trending based on the indicator and threshold.
@example
= nineLivesUtilLib.checkMarketRegime(useMarketRegime, regimeIndicator, regimeThreshold, regimeLength, regimeMode)
if regimeOk
// Proceed with trading logic
applyCooldown(buySignal, sellSignal, cooldownBars)
Applies a cooldown period after a signal.
Parameters:
buySignal (bool) : Bool: Buy signal (potentially after primary entry logic).
sellSignal (bool) : Bool: Sell signal (potentially after primary entry logic).
cooldownBars (int) : Int ⏳: The number of bars to wait after a signal before allowing another.
Returns: A tuple containing:
: cooldownFilteredBuy (bool) - Buy signal after cooldown filter.
: cooldownFilteredSell (bool) - Sell signal after cooldown filter.
@example
= nineLivesUtilLib.applyCooldown(rawBuySignal, rawSellSignal, iCool)
applyAllFilters(rawBuy, rawSell, inDateRange, tradeDirection, volumeOk, tfOk, regimeOk, drawdownOk, cooldownOkBuy, cooldownOkSell)
Applies all filtering conditions to the buy and sell signals.
Parameters:
rawBuy (bool) : Bool: The initial buy signal candidate (from primary entry logic, e.g., after cooldown).
rawSell (bool) : Bool: The initial sell signal candidate (from primary entry logic, e.g., after cooldown).
inDateRange (bool) : Bool 📅: Result from isDateInRange.
tradeDirection (string) : String 🔄: Overall trade direction preference ("longs_only", "shorts_only", "both").
volumeOk (bool) : Bool 📊: Result from checkVolumeCondition.
tfOk (bool) : Bool ⏱️: Result from checkMultiTimeframeCondition.
regimeOk (bool) : Bool 🔍: Result from checkMarketRegime.
drawdownOk (bool) : Bool 📉: Result from checkDrawdownExceeded (or equivalent).
cooldownOkBuy (bool) : Bool ⏳: Result from applyCooldown for buy.
cooldownOkSell (bool) : Bool ⏳: Result from applyCooldown for sell.
Returns: A tuple containing:
: finalBuySignal (bool) - The final buy signal after all filters.
: finalSellSignal (bool) - The final sell signal after all filters.
@example
= nineLivesUtilLib.applyAllFilters(cooldownBuy, cooldownSell, inDateRange, tradeDirection, volumeOk, tfOk, regimeOk, !drawdownExceeded, cooldownBuy, cooldownSell)
NOTE: This function filters signals generated by your primary entry logic (e.g., EMA crossover).
checkDrawdownExceeded(currentEquity, useMaxDrawdown, maxDrawdownPercent)
Tracks maximum equity and checks if current drawdown exceeds a threshold.
Parameters:
currentEquity (float) : Float: The strategy's current equity (strategy.equity).
useMaxDrawdown (bool) : Bool 📉: Enable max drawdown protection.
maxDrawdownPercent (float) : Float 📉: The maximum allowed drawdown as a percentage.
Returns: True if drawdown protection is enabled and the current drawdown exceeds the threshold, false otherwise.
@example
drawdownExceeded = nineLivesUtilLib.checkDrawdownExceeded(strategy.equity, useMaxDrawdown, maxDrawdownPercent)
if drawdownExceeded
// Consider stopping entries or exiting positions in the strategy script
calculateExitPrice(positionAvgPrice, percentage, isStop, isLong)
Calculates a stop loss or take profit price based on a percentage from the average entry price.
Parameters:
positionAvgPrice (float) : Float: The average price of the current position (strategy.position_avg_price).
percentage (float) : Float: The stop loss or take profit percentage (e.g., 2.0 for 2%).
isStop (bool) : Bool: True if calculating a stop loss price, false if calculating a take profit price.
isLong (bool) : Bool: True if the position is long, false if short.
Returns: The calculated stop price or take profit price, or na if no position or percentage is invalid.
@example
longSL = nineLivesUtilLib.calculateExitPrice(strategy.position_avg_price, stopLossPercent, true, true)
shortTP = nineLivesUtilLib.calculateExitPrice(strategy.position_avg_price, takeProfitPercent, false, false)
calculateTrailingStopLevel(positionAvgPrice, trailOffsetPercent, trailPercent, currentHigh, currentLow, isLong)
Calculates the current trailing stop level for a position.
Parameters:
positionAvgPrice (float) : Float: The average price of the current position (strategy.position_avg_price).
trailOffsetPercent (float) : Float 🔄: The percentage price movement to activate the trailing stop.
trailPercent (float) : Float 🔄: The percentage distance the stop trails behind the price.
currentHigh (float) : Float: The current bar's high (high).
currentLow (float) : Float: The current bar's low (low).
isLong (bool) : Bool: True if the position is long, false if short.
Returns: The calculated trailing stop price if active, otherwise na.
@example
longTrailStop = nineLivesUtilLib.calculateTrailingStopLevel(strategy.position_avg_price, trailOffset, trailPercent, high, low, true)
shortTrailStop = nineLivesUtilLib.calculateTrailingStopLevel(strategy.position_avg_price, trailOffset, trailPercent, high, low, false)
if not na(longTrailStop)
strategy.exit("Long Trail", from_entry="Long", stop=longTrailStop)
Dskyz (DAFE) AI Adaptive Regime - Beginners VersionDskyz (DAFE) AI Adaptive Regime - Pro: Revolutionizing Trading for All
Introduction
In the fast-paced world of financial markets, traders need tools that can keep up with ever-changing conditions while remaining accessible. The Dskyz (DAFE) AI Adaptive Regime - Pro is a groundbreaking TradingView strategy that delivers advanced, AI-driven trading capabilities to everyday traders. Available on TradingView (TradingView Scripts), this Pine Script strategy combines sophisticated market analysis with user-friendly features, making it a standout choice for both novice and experienced traders.
Core Functionality
The strategy is built to adapt to different market regimes—trending, ranging, volatile, or quiet—using a robust set of technical indicators, including:
Moving Averages (MA): Fast and slow EMAs to detect trend direction.
Average True Range (ATR): For dynamic stop-loss and volatility assessment.
Relative Strength Index (RSI) and MACD: Multi-timeframe confirmation of momentum and trend.
Average Directional Index (ADX): To identify trending markets.
Bollinger Bands: For assessing volatility and range conditions.
Candlestick Patterns: Recognizes patterns like bullish engulfing, hammer, and double bottoms, confirmed by volume spikes.
It generates buy and sell signals based on a scoring system that weighs these indicators, ensuring trades align with the current market environment. The strategy also includes dynamic risk management with ATR-based stops and trailing stops, as well as performance tracking to optimize future trades.
What Sets It Apart
The Dskyz (DAFE) AI Adaptive Regime - Pro distinguishes itself from other TradingView strategies through several unique features, which we compare to common alternatives below:
| Feature | Dskyz (DAFE) | Typical TradingView Strategies|
|---------|-------------|------------------------------------------------------------|
| Regime Detection | Automatically identifies and adapts to **four** market regimes | Often static or limited to trend/range detection |
| Multi‑Timeframe Analysis | Uses higher‑timeframe RSI/MACD for confirmation | Rarely incorporates multi‑timeframe data |
| Pattern Recognition | Detects candlestick patterns **with volume confirmation** | Limited or no pattern recognition |
| Dynamic Risk Management | ATR‑based stops and trailing stops | Often uses fixed stops or basic risk rules |
| Performance Tracking | Adjusts thresholds based on past performance | Typically static parameters |
| Beginner‑Friendly Presets | Aggressive, Conservative, Optimized profiles | Requires manual parameter tuning |
| Visual Cues | Color‑coded backgrounds for regimes | Basic or no visual aids |
The Dskyz strategy’s ability to integrate regime detection, multi-timeframe analysis, and user-friendly presets makes it uniquely versatile and accessible, addressing the needs of everyday traders who want professional-grade tools without the complexity.
-Key Features and Benefits
[Why It’s Ideal for Everyday Traders
⚡The Dskyz (DAFE) AI Adaptive Regime - Pro democratizes advanced trading by offering professional-grade tools in an accessible package. Unlike many TradingView strategies that require deep technical knowledge or fail in changing market conditions, this strategy simplifies complex analysis while maintaining robustness. Its presets and visual aids make it easy for beginners to start, while its adaptive features and performance tracking appeal to advanced traders seeking an edge.
🔄Limitations and Considerations
Market Dependency: Performance varies by market and timeframe. Backtesting is essential to ensure compatibility with your trading style.
Learning Curve: While presets simplify use, understanding regimes and indicators enhances effectiveness.
No Guaranteed Profits: Like all strategies, success depends on market conditions and proper execution. The Reddit discussion highlights skepticism about TradingView strategies’ universal success (Reddit Discussion).
Instrument Specificity: Optimized for futures (e.g., ES, NQ) due to fixed tick values. Test on other instruments like stocks or forex to verify compatibility.
📌Conclusion
The Dskyz (DAFE) AI Adaptive Regime - Pro is a revolutionary TradingView strategy that empowers everyday traders with advanced, AI-driven tools. Its ability to adapt to market regimes, confirm signals across timeframes, and manage risk dynamically. sets it apart from typical strategies. By offering beginner-friendly presets and visual cues, it makes sophisticated trading accessible without sacrificing power. Whether you’re a novice looking to trade smarter or a pro seeking a competitive edge, this strategy is your ticket to mastering the markets. Add it to your chart, backtest it, and join the elite traders leveraging AI to dominate. Trade like a boss today! 🚀
Use it with discipline. Use it with clarity. Trade smarter.
**I will continue to release incredible strategies and indicators until I turn this into a brand or until someone offers me a contract.
-Dskyz

DI+/- Cross Strategy with ATR SL and 2% TPDI+/- Cross Strategy with ATR Stop Loss and 2% Take Profit
📝 Script Description for Publishing:
This strategy is based on the directional movement of the market using the Average Directional Index (ADX) components — DI+ and DI- — to generate entry signals, with clearly defined risk and reward targets using ATR-based Stop Loss and Fixed Percentage Take Profit.
🔍 How it works:
Buy Signal: When DI+ crosses above 40, signaling strong bullish momentum.
Sell Signal: When DI- crosses above 40, indicating strong bearish momentum.
Stop Loss: Dynamically calculated using ATR × 1.5, to account for market volatility.
Take Profit: Fixed at 2% above/below the entry price, for consistent reward targeting.
🧠 Why it’s useful:
Combines momentum breakout logic with volatility-based risk management.
Works well on trending assets, especially when combined with higher timeframe filters.
Clean BUY and SELL visual labels make it easy to interpret and backtest.
✅ Tips for Use:
Use on assets with clear trends (e.g., major forex pairs, trending stocks, crypto).
Best on 30m – 4H timeframes, but can be customized.
Consider combining with other filters (e.g., EMA trend direction or Bollinger Bands) for even better accuracy.

Trend Confirmation StrategyComprehensive Trend Confirmation System
Indicator Features (Professional Description):
Comprehensive Trend Confirmation System is a versatile indicator meticulously designed to identify and confirm trend-based trading opportunities with exceptional efficiency. By seamlessly integrating analysis from a suite of leading technical tools, it aims to provide superior accuracy and reliability for informed trading decisions.
Key Features:
Intelligent Trend Identification: A robust trend analysis system that considers:
Adjustable Moving Averages: Utilizes three customizable moving average periods (fast, medium, slow) with user-selectable lengths and types (SMA, EMA, WMA, VWMA) to accurately determine the prevailing trend across different timeframes.
In-depth Price Action Analysis: Examines the formation of Higher Highs/Higher Lows (uptrend) and Lower Highs/Lower Lows (downtrend) to validate price direction.
Average Directional Index (ADX) with Adjustable Threshold: Measures the strength of a trend and employs the comparison between +DI and -DI to pinpoint the dominant momentum, featuring a customizable threshold to filter out weak signals.
Multi-Factor Signal Confirmation System: Enhances the reliability of trading signals through verification from four distinct confirmation tools:
Volume Analysis with Average Reference: Assesses whether trading volume supports price movements by comparing it to historical averages.
Relative Strength Index (RSI) with Reference Levels: Measures price momentum and identifies overbought/oversold conditions to confirm trend strength.
Moving Average Convergence Divergence (MACD) Divergence and Crossovers: Detects shifts in momentum and potential trend changes through the relationship between the MACD line and the Signal line.
Stochastic Oscillator with Reference Levels: Measures the current price's position relative to its historical range to evaluate overbought/oversold conditions and potential reversal opportunities.
Intelligent Signal Generation Logic:
Buy Signal: Triggered when a strong uptrend is identified (meeting defined criteria) and confirmed by at least three out of the four confirmation tools.
Sell Signal: Triggered when a strong downtrend is identified (meeting defined criteria) and confirmed by at least three out of the four confirmation tools.
User-Friendly Visualizations:
Moving Averages (MA): Displays three MA lines on the chart with user-configurable colors (default: fast-blue, medium-orange, slow-red) for easy visual trend analysis.
Clear Buy and Sell Signal Symbols: Presents distinct green upward-pointing triangles for buy signals and red downward-pointing triangles for sell signals at the corresponding candlestick.
Dynamic Candlestick Color Coding: Candlesticks are dynamically colored green upon a buy signal and red upon a sell signal for quick identification of trading opportunities.
Highly Customizable Parameters: Users have extensive control over the indicator's parameters, including:
Lengths and types of Moving Averages.
Length and Threshold of the ADX.
Length of the RSI.
Parameters for the MACD (Fast Length, Slow Length, Signal Length).
Parameters for the Stochastic Oscillator (%K Length, %D Length, Smoothing).
Ideal For:
Traders seeking a robust tool to accurately identify and confirm market trends.
Individuals aiming to reduce false signals and enhance the precision of their trading decisions.
Traders employing trend-following strategies in markets with clear directional movement.
Important Note:
While Comprehensive Trend Confirmation System is engineered to improve trading accuracy, no indicator can guarantee 100% profitable trades. Users are advised to utilize this indicator in conjunction with relevant fundamental analysis and sound risk management practices for optimal trading outcomes.

Professional MSTI+ Trading Indicator"Professional MSTI+ Trading Indicator" is a comprehensive technical analysis tool that combines over 20 indicators to generate high-quality trading signals and assess market sentiment. The script integrates standard indicators (MACD, RSI, Bollinger Bands, Stochastic, Simple Moving Averages, and Volume Analysis) with advanced components (Squeeze Momentum, Fisher Transform, True Strength Index, Heikin-Ashi, Laguerre RSI, Hull MA) and further includes metrics such as ADX, Chaikin Money Flow, Williams %R, VWAP, and EMA for in-depth market analysis.
Key Features:
Multiple Presets for Different Trading Styles:
Choose from optimal configurations like Professional, Swing Trading, Day Trading, Scalping, or Reversal Hunter. Note that the presets may not work perfectly on all pairs, and manual calibration might be required. This flexibility allows you to fine-tune the settings to align with your unique strategies and signals.
Multi-Layered Signal Filtering:
Filters based on trend, volume, and volatility help eliminate false signals, enhancing the accuracy of market entries.
Comprehensive Fear & Greed Index:
The indicator aggregates data from RSI, volatility, momentum, trend, and volume to gauge overall market sentiment, providing an additional layer of market context.
Dynamic Information Panel:
Displays detailed status updates for each component (e.g., MACD, RSI, Laguerre RSI, TSI, Fisher Transform, Squeeze, Hull MA, etc.) along with a visual strength bar that represents the intensity of the trading signal.
Signal Generation:
Buy and sell signals are generated when a predefined number of conditions are met and confirmed over multiple bars. These signals are clearly displayed on the chart with arrows, making it easier to spot potential entry and exit points.
Alert Setup:
Built-in alert conditions allow you to receive real-time notifications when trading signals are generated, helping you stay on top of market movements.
"Professional MSTI+ Trading Indicator" is designed to enhance your trading strategy by providing a multi-faceted market analysis and an intuitive visual interface. While the presets offer a robust starting point, they may require manual calibration on certain pairs, giving you the flexibility to configure your own unique strategies and signals.

Multi-Anchored Linear Regression Channels [TANHEF]█ Overview:
The 'Multi-Anchored Linear Regression Channels ' plots multiple dynamic regression channels (or bands) with unique selectable calculation types for both regression and deviation. It leverages a variety of techniques, customizable anchor sources to determine regression lengths, and user-defined criteria to highlight potential opportunities.
Before getting started, it's worth exploring all sections, but make sure to review the Setup & Configuration section in particular. It covers key parameters like anchor type, regression length, bias, and signal criteria—essential for aligning the tool with your trading strategy.
█ Key Features:
⯁ Multi-Regression Capability:
Plot up to three distinct regression channels and/or bands simultaneously, each with customizable anchor types to define their length.
⯁ Regression & Deviation Methods:
Regressions Types:
Standard: Uses ordinary least squares to compute a simple linear trend by averaging the data and deriving a slope and endpoints over the lookback period.
Ridge: Introduces L2 regularization to stabilize the slope by penalizing large coefficients, which helps mitigate multicollinearity in the data.
Lasso: Uses L1 regularization through soft-thresholding to shrink less important coefficients, yielding a simpler model that highlights key trends.
Elastic Net: Combines L1 and L2 penalties to balance coefficient shrinkage and selection, producing a robust weighted slope that handles redundant predictors.
Huber: Implements the Huber loss with iteratively reweighted least squares (IRLS) and EMA-style weights to reduce the impact of outliers while estimating the slope.
Least Absolute Deviations (LAD): Reduces absolute errors using iteratively reweighted least squares (IRLS), yielding a slope less sensitive to outliers than squared-error methods.
Bayesian Linear: Merges prior beliefs with weighted data through Bayesian updating, balancing the prior slope with data evidence to derive a probabilistic trend.
Deviation Types:
Regressive Linear (Reverse): In reverse order (recent to oldest), compute weighted squared differences between the data and a line defined by a starting value and slope.
Progressive Linear (Forward): In forward order (oldest to recent), compute weighted squared differences between the data and a line defined by a starting value and slope.
Balanced Linear: In forward order (oldest to newest), compute regression, then pair to source data in reverse order (newest to oldest) to compute weighted squared differences.
Mean Absolute: Compute weighted absolute differences between each data point and its regression line value, then aggregate them to yield an average deviation.
Median Absolute: Determine the weighted median of the absolute differences between each data point and its regression line value to capture the central tendency of deviations.
Percent: Compute deviation as a percentage of a base value by multiplying that base by the specified percentage, yielding symmetric positive and negative deviations.
Fitted: Compare a regression line with high and low series values by computing weighted differences to determine the maximum upward and downward deviations.
Average True Range: Iteratively compute the weighted average of absolute differences between the data and its regression line to yield an ATR-style deviation measure.
Bias:
Bias: Applies EMA or inverse-EMA style weighting to both Regression and/or Deviation, emphasizing either recent or older data.
⯁ Customizable Regression Length via Anchors:
Anchor Types:
Fixed: Length.
Bar-Based: Bar Highest/Lowest, Volume Highest/Lowest, Spread Highest/Lowest.
Correlation: R Zero, R Highest, R Lowest, R Absolute.
Slope: Slope Zero, Slope Highest, Slope Lowest, Slope Absolute.
Indicator-Based: Indicators Highest/Lowest (ADX, ATR, BBW, CCI, MACD, RSI, Stoch).
Time-Based: Time (Day, Week, Month, Quarter, Year, Decade, Custom).
Session-Based: Session (Tokyo, London, New York, Sydney, Custom).
Event-Based: Earnings, Dividends, Splits.
External: Input Source Highest/Lowest.
Length Selection:
Maximum: The highest allowed regression length (also fixed value of “Length” anchor).
Minimum: The shortest allowed length, ensuring enough bars for a valid regression.
Step: The sampling interval (e.g., 1 checks every bar, 2 checks every other bar, etc.). Increasing the step reduces the loading time, most applicable to “Slope” and “R” anchors.
Adaptive lookback:
Adaptive Lookback: Enable to display regression regardless of too few historical bars.
⯁ Selecting Bias:
Bias applies separately to regression and deviation.
Positive values emphasize recent data (EMA-style), negative invert, and near-zero maintains balance. (e.g., a length 100, bias +1 gives the newest price ~7× more weight than the oldest).
It's best to apply bias to both (regression and deviation) or just the deviation. Biasing only regression may distort deviation visually, while biasing both keeps their relationship intuitive. Using bias only for deviation scales it without altering regression, offering unique analysis.
⯁ Scale Awareness:
Supports linear and logarithmic price scaling, the regression and deviations adjust accordingly.
⯁ Signal Generation & Alerts:
Customizable entry/exit signals and alerts, detailed in the dedicated section below.
⯁ Visual Enhancements & Real-World Examples:
Optional on-chart table display summarizing regression input criteria (display type, anchor type, source, regression type, regression bias, deviation type, deviation bias, deviation multiplier) and key calculated metrics (regression length, slope, Pearson’s R, percentage position within deviations, etc.) for quick reference.
█ Understanding R (Pearson Correlation Coefficient):
Pearson’s R gauges data alignment to a straight-line trend within the regression length:
Range: R varies between –1 and +1.
R = +1 → Perfect positive correlation (strong uptrend).
R = 0 → No linear relationship detected.
R = –1 → Perfect negative correlation (strong downtrend).
This script uses Pearson’s R as an anchor, adjusting regression length to target specific R traits. Strong R (±1) follows the regression channel, while weak R (0) shows inconsistency.
█ Understanding the Slope:
The slope is the direction and rate at which the regression line rises or falls per bar:
Positive Slope (>0): Uptrend – Steeper means faster increase.
Negative Slope (<0): Downtrend – Steeper means sharper drop.
Zero or Near-Zero Slope: Sideways – Indicating range-bound conditions.
This script uses highest and lowest slope as an anchor, where extremes highlight strong moves and trend lines, while values near zero indicate sideways action and possible support/resistance.
█ Setup & Configuration:
Whether you’re new to this script or want to quickly adjust all critical parameters, the panel below shows the main settings available. You can customize everything from the anchor type and maximum length to the bias, signal conditions, and more.
Scale (select Log Scale for logarithmic, otherwise linear scale).
Display (regression channel and/or bands).
Anchor (how regression length is determined).
Length (control bars analyzed):
• Max – Upper limit.
• Min – Prevents regression from becoming too short.
• Step – Controls scanning precision; increasing Step reduces load time.
Regression:
• Type – Calculation method.
• Bias – EMA-style emphasis (>0=new bars weighted more; <0=old bars weighted more).
Deviation:
• Type – Calculation method.
• Bias – EMA-style emphasis (>0=new bars weighted more; <0=old bars weighted more).
• Multiplier - Adjusts Upper and Lower Deviation.
Signal Criteria:
• % (Price vs Deviation) – (0% = lower deviation, 50% = regression, 100% = upper deviation).
• R – (0 = no correlation, ±1 = perfect correlation; >0 = +slope, <0 = -slope).
Table (analyze table of input settings, calculated results, and signal criteria).
Adaptive Lookback (display regression while too few historical bars).
Multiple Regressions (steps 2 to 7 apply to #1, #2, and #3 regressions).
█ Signal Generation & Alerts:
The script offers customizable entry and exit signals with flexible criteria and visual cues (background color, dots, or triangles). Alerts can also be triggered for these opportunities.
Percent Direction Criteria:
(0% = lower deviation, 50% = regression line, 100% = upper deviation)
Above %: Triggers if price is above a specified percent of the deviation channel.
Below %: Triggers if price is below a specified percent of the deviation channel.
(Blank): Ignores the percent‐based condition.
Pearson's R (Correlation) Direction Criteria:
(0 = no correlation, ±1 = perfect correlation; >0 = positive slope, <0 = negative slope)
Above R / Below R: Compares the correlation to a threshold.
Above│R│ / Below│R│: Uses absolute correlation to focus on strength, ignoring direction.
Zero to R: Checks if R is in the 0-to-threshold range.
(Blank): Ignores correlation-based conditions.
█ User Tips & Best Practices:
Choose an anchor type that suits your strategy, “Bar Highest/Lowest” automatically spots commonly used regression zones, while “│R│ Highest” targets strong linear trends.
Consider enabling or disabling the Adaptive Lookback feature to ensure you always have a plotted regression if your chart doesn’t meet the maximum-length requirement.
Use a small Step size (1) unless relying on R-correlation or slope-based anchors as the are time-consuming to calculate. Larger steps speed up calculations but reduce precision.
Fine-tune settings such as lookback periods, regression bias, and deviation multipliers, or trend strength. Small adjustments can significantly affect how channels and signals behave.
To reduce loading time , show only channels (not bands) and disable signals, this limits calculations to the last bar and supports more extreme criteria.
Use the table display to monitor anchor type, calculated length, slope, R value, and percent location at a glance—especially if you have multiple regressions visible simultaneously.
█ Conclusion:
With its blend of advanced regression techniques, flexible deviation options, and a wide range of anchor types, this indicator offers a highly adaptable linear regression channeling system. Whether you're anchoring to time, price extremes, correlation, slope, or external events, the tool can be shaped to fit a variety of strategies. Combined with customizable signals and alerts, it may help highlight areas of confluence and support a more structured approach to identifying potential opportunities.

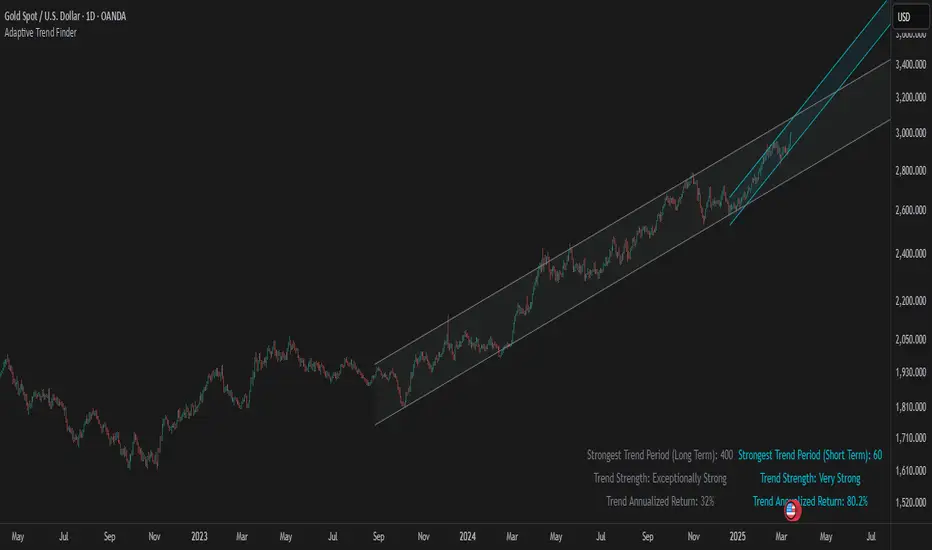
Adaptive Trend FinderAdaptive Trend Finder - The Ultimate Trend Detection Tool
Introducing Adaptive Trend Finder, the next evolution of trend analysis on TradingView. This powerful indicator is an enhanced and refined version of Adaptive Trend Finder (Log), designed to offer even greater flexibility, accuracy, and ease of use.
What’s New?
Unlike the previous version, Adaptive Trend Finder allows users to fully configure and adjust settings directly within the indicator menu, eliminating the need to modify chart settings manually. A major improvement is that users no longer need to adjust the chart's logarithmic scale manually in the chart settings; this can now be done directly within the indicator options, ensuring a smoother and more efficient experience. This makes it easier to switch between linear and logarithmic scaling without disrupting the analysis. This provides a seamless user experience where traders can instantly adapt the indicator to their needs without extra steps.
One of the most significant improvements is the complete code overhaul, which now enables simultaneous visualization of both long-term and short-term trend channels without needing to add the indicator twice. This not only improves workflow efficiency but also enhances chart readability by allowing traders to monitor multiple trend perspectives at once.
The interface has been entirely redesigned for a more intuitive user experience. Menus are now clearer, better structured, and offer more customization options, making it easier than ever to fine-tune the indicator to fit any trading strategy.
Key Features & Benefits
Automatic Trend Period Selection: The indicator dynamically identifies and applies the strongest trend period, ensuring optimal trend detection with no manual adjustments required. By analyzing historical price correlations, it selects the most statistically relevant trend duration automatically.
Dual Channel Display: Traders can view both long-term and short-term trend channels simultaneously, offering a broader perspective of market movements. This feature eliminates the need to apply the indicator twice, reducing screen clutter and improving efficiency.
Fully Adjustable Settings: Users can customize trend detection parameters directly within the indicator settings. No more switching chart settings – everything is accessible in one place.
Trend Strength & Confidence Metrics: The indicator calculates and displays a confidence score for each detected trend using Pearson correlation values. This helps traders gauge the reliability of a given trend before making decisions.
Midline & Channel Transparency Options: Users can fine-tune the visibility of trend channels, adjusting transparency levels to fit their personal charting style without overwhelming the price chart.
Annualized Return Calculation: For daily and weekly timeframes, the indicator provides an estimate of the trend’s performance over a year, helping traders evaluate potential long-term profitability.
Logarithmic Adjustment Support: Adaptive Trend Finder is compatible with both logarithmic and linear charts. Traders who analyze assets like cryptocurrencies, where log scaling is common, can enable this feature to refine trend calculations.
Intuitive & User-Friendly Interface: The updated menu structure is designed for ease of use, allowing quick and efficient modifications to settings, reducing the learning curve for new users.
Why is this the Best Trend Indicator?
Adaptive Trend Finder stands out as one of the most advanced trend analysis tools available on TradingView. Unlike conventional trend indicators, which rely on fixed parameters or lagging signals, Adaptive Trend Finder dynamically adjusts its settings based on real-time market conditions. By combining automatic trend detection, dual-channel visualization, real-time performance metrics, and an intuitive user interface, this indicator offers an unparalleled edge in trend identification and trading decision-making.
Traders no longer have to rely on guesswork or manually tweak settings to identify trends. Adaptive Trend Finder does the heavy lifting, ensuring that users are always working with the strongest and most reliable trends. The ability to simultaneously display both short-term and long-term trends allows for a more comprehensive market overview, making it ideal for scalpers, swing traders, and long-term investors alike.
With its state-of-the-art algorithms, fully customizable interface, and professional-grade accuracy, Adaptive Trend Finder is undoubtedly one of the most powerful trend indicators available.
Try it today and experience the future of trend analysis.
This indicator is a technical analysis tool designed to assist traders in identifying trends. It does not guarantee future performance or profitability. Users should conduct their own research and apply proper risk management before making trading decisions.
// Created by Julien Eche - @Julien_Eche
Market Trend Levels Non-Repainting [BigBeluga X PineIndicators]This strategy is based on the Market Trend Levels Detector developed by BigBeluga. Full credit for the concept and original indicator goes to BigBeluga.
The Market Trend Levels Detector Strategy is a non-repainting trend-following strategy that identifies market trend shifts using two Exponential Moving Averages (EMA). It also detects key price levels and allows traders to apply multiple filters to refine trade entries and exits.
This strategy is designed for trend trading and enables traders to:
Identify trend direction based on EMA crossovers.
Detect significant market levels using labeled trend lines.
Use multiple filter conditions to improve trade accuracy.
Avoid false signals through non-repainting calculations.
How the Market Trend Levels Detector Strategy Works
1. Core Trend Detection Using EMA Crossovers
The strategy detects trend shifts using two EMAs:
Fast EMA (default: 12 periods) – Reacts quickly to price movements.
Slow EMA (default: 25 periods) – Provides a smoother trend confirmation.
A bullish crossover (Fast EMA crosses above Slow EMA) signals an uptrend , while a bearish crossover (Fast EMA crosses below Slow EMA) signals a downtrend .
2. Market Level Detection & Visualization
Each time an EMA crossover occurs, a trend level line is drawn:
Bullish crossover → A green line is drawn at the low of the crossover candle.
Bearish crossover → A purple line is drawn at the high of the crossover candle.
Lines can be extended to act as support and resistance zones for future price action.
Additionally, a small label (●) appears at each crossover to mark the event on the chart.
3. Trade Entry & Exit Conditions
The strategy allows users to choose between three trading modes:
Long Only – Only enters long trades.
Short Only – Only enters short trades.
Long & Short – Trades in both directions.
Entry Conditions
Long Entry:
A bullish EMA crossover occurs.
The trade direction setting allows long trades.
Filter conditions (if enabled) confirm a valid long signal.
Short Entry:
A bearish EMA crossover occurs.
The trade direction setting allows short trades.
Filter conditions (if enabled) confirm a valid short signal.
Exit Conditions
Long Exit:
A bearish EMA crossover occurs.
Exit filters (if enabled) indicate an invalid long position.
Short Exit:
A bullish EMA crossover occurs.
Exit filters (if enabled) indicate an invalid short position.
Additional Trade Filters
To improve trade accuracy, the strategy allows traders to apply up to 7 additional filters:
RSI Filter: Only trades when RSI confirms a valid trend.
MACD Filter: Ensures MACD histogram supports the trade direction.
Stochastic Filter: Requires %K line to be above/below threshold values.
Bollinger Bands Filter: Confirms price position relative to the middle BB line.
ADX Filter: Ensures the trend strength is above a set threshold.
CCI Filter: Requires CCI to indicate momentum in the right direction.
Williams %R Filter: Ensures price momentum supports the trade.
Filters can be enabled or disabled individually based on trader preference.
Dynamic Level Extension Feature
The strategy provides an optional feature to extend trend lines until price interacts with them again:
Bullish support lines extend until price revisits them.
Bearish resistance lines extend until price revisits them.
If price breaks a line, the line turns into a dotted style , indicating it has been breached.
This helps traders identify key levels where trend shifts previously occurred, providing useful support and resistance insights.
Customization Options
The strategy includes several adjustable settings :
Trade Direction: Choose between Long Only, Short Only, or Long & Short.
Trend Lengths: Adjust the Fast & Slow EMA lengths.
Market Level Extension: Decide whether to extend support/resistance lines.
Filters for Trade Confirmation: Enable/disable individual filters.
Color Settings: Customize line colors for bullish and bearish trend shifts.
Maximum Displayed Lines: Limit the number of drawn support/resistance lines.
Considerations & Limitations
Trend Lag: As with any EMA-based strategy, signals may be slightly delayed compared to price action.
Sideways Markets: This strategy works best in trending conditions; frequent crossovers in sideways markets can produce false signals.
Filter Usage: Enabling multiple filters may reduce trade frequency, but can also improve trade quality.
Line Overlap: If many crossovers occur in a short period, the chart may become cluttered with multiple trend levels. Adjusting the "Display Last" setting can help.
Conclusion
The Market Trend Levels Detector Strategy is a non-repainting trend-following system that combines EMA crossovers, market level detection, and customizable filters to improve trade accuracy.
By identifying trend shifts and key price levels, this strategy can be used for:
Trend Confirmation – Using EMA crossovers and filters to confirm trend direction.
Support & Resistance Trading – Identifying dynamic levels where price reacts.
Momentum-Based Trading – Combining EMA crossovers with additional momentum filters.
This strategy is fully customizable and can be adapted to different trading styles, timeframes, and market conditions.
Full credit for the original concept and indicator goes to BigBeluga.

Squeeze Momentum Indicator Strategy [LazyBear + PineIndicators]The Squeeze Momentum Indicator Strategy (SQZMOM_LB Strategy) is an automated trading strategy based on the Squeeze Momentum Indicator developed by LazyBear, which itself is a modification of John Carter's "TTM Squeeze" concept from his book Mastering the Trade (Chapter 11). This strategy is designed to identify low-volatility phases in the market, which often precede explosive price movements, and to enter trades in the direction of the prevailing momentum.
Concept & Indicator Breakdown
The strategy employs a combination of Bollinger Bands (BB) and Keltner Channels (KC) to detect market squeezes:
Squeeze Condition:
When Bollinger Bands are inside the Keltner Channels (Black Crosses), volatility is low, signaling a potential upcoming price breakout.
When Bollinger Bands move outside Keltner Channels (Gray Crosses), the squeeze is released, indicating an expansion in volatility.
Momentum Calculation:
A linear regression-based momentum value is used instead of traditional momentum indicators.
The momentum histogram is color-coded to show strength and direction:
Lime/Green: Increasing bullish momentum
Red/Maroon: Increasing bearish momentum
Signal Colors:
Black: Market is in a squeeze (low volatility).
Gray: Squeeze is released, and volatility is expanding.
Blue: No squeeze condition is present.
Strategy Logic
The script uses historical volatility conditions and momentum trends to generate buy/sell signals and manage positions.
1. Entry Conditions
Long Position (Buy)
The squeeze just released (Gray Cross after Black Cross).
The momentum value is increasing and positive.
The momentum is at a local low compared to the past 100 bars.
The price is above the 100-period EMA.
The closing price is higher than the previous close.
Short Position (Sell)
The squeeze just released (Gray Cross after Black Cross).
The momentum value is decreasing and negative.
The momentum is at a local high compared to the past 100 bars.
The price is below the 100-period EMA.
The closing price is lower than the previous close.
2. Exit Conditions
Long Exit:
The momentum value starts decreasing (momentum lower than previous bar).
Short Exit:
The momentum value starts increasing (momentum higher than previous bar).
Position Sizing
Position size is dynamically adjusted based on 8% of strategy equity, divided by the current closing price, ensuring risk-adjusted trade sizes.
How to Use This Strategy
Apply on Suitable Markets:
Best for stocks, indices, and forex pairs with momentum-driven price action.
Works on multiple timeframes but is most effective on higher timeframes (1H, 4H, Daily).
Confirm Entries with Additional Indicators:
The author recommends ADX or WaveTrend to refine entries and avoid false signals.
Risk Management:
Since the strategy dynamically sizes positions, it's advised to use stop-losses or risk-based exits to avoid excessive drawdowns.
Final Thoughts
The Squeeze Momentum Indicator Strategy provides a systematic approach to trading volatility expansions, leveraging the classic TTM Squeeze principles with a unique linear regression-based momentum calculation. Originally inspired by John Carter’s method, LazyBear's version and this strategy offer a refined, adaptable tool for traders looking to capitalize on market momentum shifts.

DrawIndicatorOnTheChartLibrary "DrawIndicatorOnTheChart"
this library is used to show an indicator (such RSI, CCI, MOM etc) on the main chart with indicator's horizontal lines in a window. Location of the window is calculated dynamically by last price movemements
drawIndicator(enabled, indicatorName, indicator1, indicator2, indicator3, indicatorcolors, period, indimax_, indimin_, levels, precision, xlocation, lnwidth)
draws the realted indicator on the chart
Parameters:
enabled (bool) : if it's enabled to show
indicatorName (string) : is the indicator name as string such "RSI", "CCI" etc
indicator1 (float) : is first indicator you want to show, such rsi(close, 14), mom(close, 10) etc
indicator2 (float) : is second indicator you want to show, such -DI of DMI
indicator3 (float) : is third indicator you want to show, such ADX of DMI
indicatorcolors (array)
period (int) : is the length of the window to show
indimax_ (float) : is the maximum value of the indicator, for example for RSI it's 100.0, if the indicator (such CCI, MOM etc) doesn't have maximum value then use "na"
indimin_ (float) : is the minimum value of the indicator, for example for RSI it's 0.0, if the indicator (such CCI, MOM etc)doesn't have maximum value then use "na"
levels (array) : is the levels of the array for the horizontal lines. for example if you want horizontal lines at 30.0, and 70.0 then use array.from(30.0, 70.0). if no horizontal lines then use array.from(na)
precision (int) : is the precision/nuber of decimals that is used to show indicator values, for example for RSI set it 2
xlocation (int) : is end location of the indicator window, for example if xlocation = 0 window is created on the index of the last bar/candle
lnwidth (int) : is the line width of the indicator lines
Returns: none

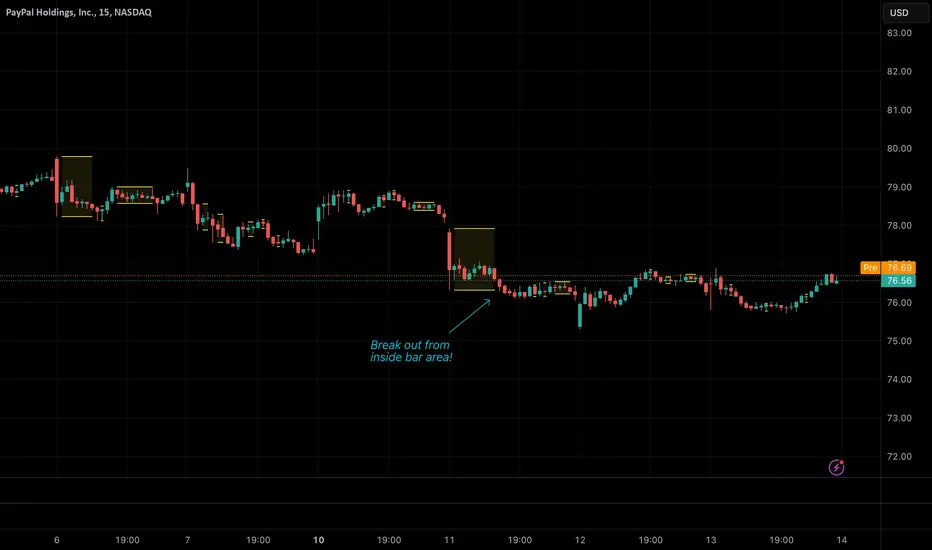
Inside BarsInside Bars Indicator
Description:
This indicator identifies and highlights price action patterns where a bar's high and low
are completely contained within the previous bar's range. Inside bars are significant
technical patterns that often signal a period of price consolidation or uncertainty,
potentially leading to a breakout in either direction.
Trading Literature & Theory:
Inside bars are well-documented in technical analysis literature:
- Steve Nison discusses them in "Japanese Candlestick Charting Techniques" as a form
of harami pattern, indicating potential trend reversals
- Thomas Bulkowski's "Encyclopedia of Chart Patterns" categorizes inside bars as
a consolidation pattern with statistical significance for breakout trading
- Alexander Elder references them in "Trading for a Living" as indicators of
decreasing volatility and potential energy build-up
- John Murphy's "Technical Analysis of the Financial Markets" includes inside bars
as part of price action analysis for market psychology understanding
The pattern is particularly significant because it represents:
1. Volatility Contraction: A narrowing of price range indicating potential energy build-up
2. Institutional Activity: Often shows large players absorbing or distributing positions
3. Decision Point: Market participants evaluating the previous bar's significance
Trading Applications:
1. Breakout Trading
- Watch for breaks above the parent bar's high (bullish signal)
- Monitor breaks below the parent bar's low (bearish signal)
- Multiple consecutive inside bars can indicate stronger breakout potential
2. Market Psychology
- Inside bars represent a period of equilibrium between buyers and sellers
- Shows market uncertainty and potential energy building up
- Often precedes significant price movements
Best Market Conditions:
- Trending markets approaching potential reversal points
- After strong momentum moves where the market needs to digest gains
- Near key support/resistance levels
- During pre-breakout consolidation phases
Complementary Indicators:
- Volume indicators to confirm breakout strength
- Trend indicators (Moving Averages, ADX) for context
- Momentum indicators (RSI, MACD) for additional confirmation
Risk Management:
- Use parent bar's range for stop loss placement
- Wait for breakout confirmation before entry
- Consider time-based exits if breakout doesn't occur
- More reliable on higher timeframes
Note: The indicator works best when combined with proper risk management
and overall market context analysis. Avoid trading every inside bar pattern
and always confirm with volume and other technical indicators.
Zerg range filter credit to Kivanc turkish pinecoder for base indicator i reworked with chatgpt and some common sense
this indicator similar to the ADX but i think its better visually to keep you out of market conditions that are unfavorable.
i made original indicator to work in a 0-100 enviroment (before it was a zero middle line oscillator) and added background coloring that has a lower and higher threshold setting. i also added a smoothing moving average. this will trigger threshold levels (not the core oscillator)
above higher level would indicate trending market conditions and its purple. these are the areas where you might want to buy low period moving average bounces like 10 or 21 ema
lower band will paint indicator background blue and its cold, meaning range bound trade ideas are likely play out better. selling resistance and buying horizontal supports for example.
you are encourage to play with lookback period and change thresholds until you find something that works for your trading.
on the picture above it illustrates how i intended its usage.
it also shows divergences which was not intended but also a function.
you can also observe as the oscillator likes to coil up into a tight range (horizontal or a wedge formation) and when these break their trendlines explosive moves are incoming usually.
if you have a trading system and can generate a lot of signals but want to filter out some loser trades this could be the indicator you were looking for.
i hope this will be inline with community guidelines. my other publishing got removed unfortunately

Arpeet MACDOverview
This strategy is based on the zero-lag version of the MACD (Moving Average Convergence Divergence) indicator, which captures short-term trends by quickly responding to price changes, enabling high-frequency trading. The strategy uses two moving averages with different periods (fast and slow lines) to construct the MACD indicator and introduces a zero-lag algorithm to eliminate the delay between the indicator and the price, improving the timeliness of signals. Additionally, the crossover of the signal line and the MACD line is used as buy and sell signals, and alerts are set up to help traders seize trading opportunities in a timely manner.
Strategy Principle
Calculate the EMA (Exponential Moving Average) or SMA (Simple Moving Average) of the fast line (default 12 periods) and slow line (default 26 periods).
Use the zero-lag algorithm to double-smooth the fast and slow lines, eliminating the delay between the indicator and the price.
The MACD line is formed by the difference between the zero-lag fast line and the zero-lag slow line.
The signal line is formed by the EMA (default 9 periods) or SMA of the MACD line.
The MACD histogram is formed by the difference between the MACD line and the signal line, with blue representing positive values and red representing negative values.
When the MACD line crosses the signal line from below and the crossover point is below the zero axis, a buy signal (blue dot) is generated.
When the MACD line crosses the signal line from above and the crossover point is above the zero axis, a sell signal (red dot) is generated.
The strategy automatically places orders based on the buy and sell signals and triggers corresponding alerts.
Advantage Analysis
The zero-lag algorithm effectively eliminates the delay between the indicator and the price, improving the timeliness and accuracy of signals.
The design of dual moving averages can better capture market trends and adapt to different market environments.
The MACD histogram intuitively reflects the comparison of bullish and bearish forces, assisting in trading decisions.
The automatic order placement and alert functions make it convenient for traders to seize trading opportunities in a timely manner, improving trading efficiency.
Risk Analysis
In volatile markets, frequent crossover signals may lead to overtrading and losses.
Improper parameter settings may cause signal distortion and affect strategy performance.
The strategy relies on historical data for calculations and has poor adaptability to sudden events and black swan events.
Optimization Direction
Introduce trend confirmation indicators, such as ADX, to filter out false signals in volatile markets.
Optimize parameters to find the best combination of fast and slow line periods and signal line periods, improving strategy stability.
Combine other technical indicators or fundamental factors to construct a multi-factor model, improving risk-adjusted returns of the strategy.
Introduce stop-loss and take-profit mechanisms to control single-trade risk.
Summary
The MACD Dual Crossover Zero Lag Trading Strategy achieves high-frequency trading by quickly responding to price changes and capturing short-term trends. The zero-lag algorithm and dual moving average design improve the timeliness and accuracy of signals. The strategy has certain advantages, such as intuitive signals and convenient operation, but also faces risks such as overtrading and parameter sensitivity. In the future, the strategy can be optimized by introducing trend confirmation indicators, parameter optimization, multi-factor models, etc., to improve the robustness and profitability of the strategy.

Advanced Trend and Volatility Indicator with Alerts by ZaimonThis script presents a comprehensive analytical tool that integrates multiple technical indicators to provide a holistic view of market trends and volatility. By uniquely combining Moving Averages (MA), Relative Strength Index (RSI), Stochastic Oscillator, Bollinger Bands, and Average True Range (ATR), it offers nuanced insights into price movements and helps identify potential trading opportunities.
---
### **Key Features and Integration:**
1. **Moving Averages (MA20 & MA50):**
- **Trend Identification:**
- **Methodology:** Calculates two Simple Moving Averages—MA20 (short-term) and MA50 (long-term).
- **Bullish Trend:** When MA20 crosses above MA50, indicating upward momentum.
- **Bearish Trend:** When MA20 crosses below MA50, signaling downward momentum.
- **Golden Cross & Death Cross Alerts:**
- **Golden Cross:** MA20 crossing above MA50 generates a bullish alert and visual symbol.
- **Death Cross:** MA20 crossing below MA50 triggers a bearish alert and visual symbol.
- **Integration:**
- Serves as the foundational trend indicator, influencing interpretations of other indicators within the script.
2. **Relative Strength Index (RSI):**
- **Momentum Measurement:**
- **Methodology:** Calculates RSI to assess the speed and change of price movements over a 14-period length.
- **Overbought/Oversold Conditions:** Customizable thresholds set at 70 (overbought) and 30 (oversold).
- **Alerts:**
- Generates alerts when RSI crosses above or below the specified thresholds.
- **Integration:**
- Confirms trend strength identified by MAs.
- Overbought/Oversold signals can precede potential trend reversals, especially when aligned with MA crossovers.
3. **Stochastic Oscillator:**
- **Momentum and Reversal Signals:**
- **Methodology:** Uses %K and %D lines to evaluate price momentum relative to high-low range over recent periods.
- **Bullish Signal:** %K crossing above %D in oversold territory (below 20).
- **Bearish Signal:** %K crossing below %D in overbought territory (above 80).
- **Alerts:**
- Provides alerts on bullish and bearish crossovers in extreme regions.
- **Integration:**
- Enhances RSI signals by providing additional momentum confirmation.
- When both RSI and Stochastic indicate overbought/oversold conditions, it strengthens the likelihood of a reversal.
4. **Bollinger Bands:**
- **Volatility Visualization:**
- **Methodology:** Plots upper and lower bands based on standard deviations from a moving average (BB Basis).
- **Dynamic Support/Resistance:** Prices touching or exceeding the bands may indicate potential reversals.
- **Integration:**
- Works with RSI and Stochastic to identify overextended price movements.
- Helps in assessing volatility alongside trend and momentum indicators.
5. **Average True Range (ATR):**
- **Volatility Assessment:**
- **Methodology:** Calculates ATR over a 14-period length to measure market volatility.
- **ATR Bands:** Plots upper and lower bands relative to the current price using an ATR multiplier.
- **Integration:**
- Assists in setting stop-loss and take-profit levels based on current volatility.
- Complements Bollinger Bands for a comprehensive volatility analysis.
6. **Information Table:**
- **Real-Time Data Display:**
- Shows current values of MA20, MA50, RSI, Stochastic %K and %D, BB Basis, ATR, and Trend Status.
- **Trend Status Indicator:**
- Displays "Bullish," "Bearish," or "Sideways" based on MA conditions.
- **Integration:**
- Provides a consolidated view for quick decision-making without analyzing individual indicators separately.
7. **Periodic Labels:**
- **Enhanced Visibility:**
- Adds labels every 50 bars showing RSI and Stochastic values.
- **Integration:**
- Helps track momentum changes over time and spot longer-term patterns.
---
### **How the Components Work Together:**
- **Synergistic Analysis:**
- **Trend Confirmation:** MA crossovers establish the primary trend, while RSI and Stochastic confirm momentum within that trend.
- **Volatility Context:** Bollinger Bands and ATR provide context on market volatility, refining entry and exit points suggested by trend and momentum indicators.
- **Signal Strength:** Concurrent signals from multiple indicators increase confidence in trading decisions.
---
### **Usage Guidelines:**
1. **Trend Analysis:**
- **Identify Trend Direction:**
- Observe MA20 and MA50 crossovers.
- Refer to the Trend Status in the information table.
- **Confirm with Momentum Indicators:**
- Ensure RSI and Stochastic support the identified trend.
2. **Entry and Exit Points:**
- **Overbought/Oversold Conditions:**
- Look for RSI and Stochastic reaching extreme levels.
- Consider entering positions when oversold in a bullish trend or overbought in a bearish trend.
- **Bollinger Band Interactions:**
- Use price interactions with Bollinger Bands to identify potential reversal zones.
3. **Risk Management:**
- **ATR-Based Levels:**
- Set stop-loss and take-profit levels using ATR bands to account for current volatility.
- **Adjusting to Volatility:**
- Modify position sizes and targets based on Bollinger Band width and ATR values.
4. **Alerts Setup:**
- **Customize Alert Thresholds:**
- Configure alerts for MA crossovers, RSI levels, and Stochastic crossovers according to your trading strategy.
- **Stay Informed:**
- Use alerts to monitor key events without constant chart observation.
---
### **Customization:**
- **Flexible Parameters:**
- All indicator lengths, thresholds, and settings are adjustable to suit different trading styles and timeframes.
- **Adjustable Visuals:**
- Modify plot colors, line styles, and label positions to enhance chart readability.
---
### **Originality and Value Addition:**
This script differentiates itself by:
- **Integrated Approach:**
- Seamlessly combining multiple indicators to provide a more comprehensive analysis than using each indicator separately.
- **Enhanced Visualization:**
- Utilizing plots, fills, labels, and an information table to present data intuitively.
- **User-Friendly Features:**
- Pre-configured alerts and real-time data displays reduce the need for manual monitoring.
By explaining how each component interacts and contributes to the overall analysis, the script adds substantial value to traders seeking a multi-faceted tool for market analysis.
---
### **Additional Notes:**
- **Learning Resource:**
- The script is well-commented, serving as an educational tool for those learning Pine Script and technical analysis integration.
- **Further Enhancements:**
- Opportunities exist to incorporate additional indicators like MACD or ADX, and to develop advanced alert logic, such as RSI or Stochastic divergences.
---
### **Disclaimer:**
- **Educational Purpose Only:**
- This script is provided for informational purposes and should not be construed as financial advice.
- **Risk Acknowledgment:**
- Trading involves significant risk; past performance is not indicative of future results.
- **Due Diligence:**
- Users should conduct their own analysis and consider consulting a financial professional before making trading decisions.
---
By providing detailed explanations of the methodologies and the synergistic use of multiple indicators, this script aligns with TradingView's guidelines for originality and usefulness. It offers traders a unique tool that enhances market analysis through the thoughtful integration of technical indicators.

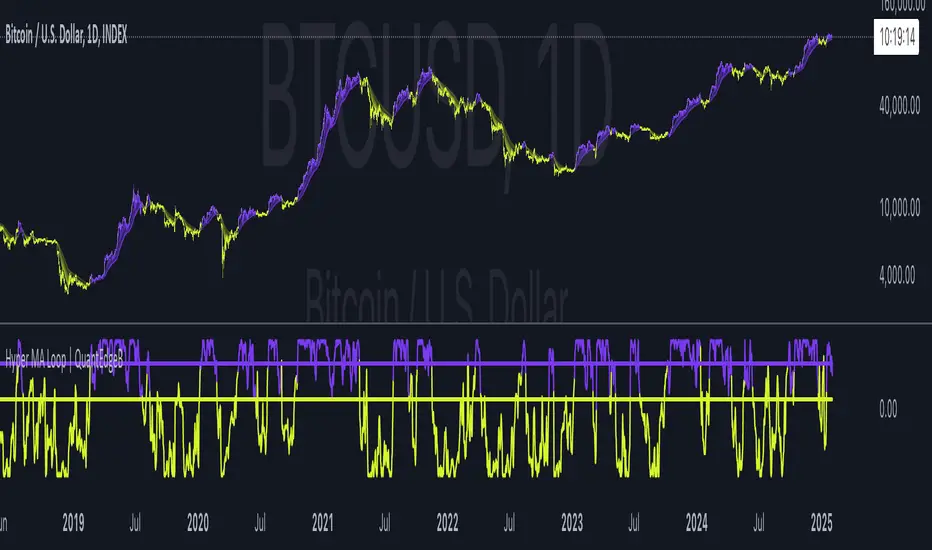
Hyper MA Loop | QuantEdgeBIntroducing Hyper MA Loop by QuantEdgeB
Hyper MA Loop | QuantEdgeB is an advanced trend-following indicator that leverages a custom Hyper Moving Average (HyMA) and an innovative loop-based scoring system to assess trend strength and direction. This tool is designed to provide a dynamic perspective on market momentum, allowing traders to capture trends effectively while filtering out market noise.
Key Features:
1. Hyper Moving Average (HyMA) 🟣
- A weighted moving average that enhances trend responsiveness by applying a custom
weight function.
- Ensures smoother trend detection while maintaining reactivity to price changes.
2. Loop-Based Trend Scoring 🔄
- Utilizes a for-loop function to analyze the movement of HyMA over a specified period.
- Compares current values to past values, generating a cumulative score indicating bullish or
bearish momentum.
- Dynamic thresholds adjust to market conditions for better trend filtering.
3. Threshold-Based Signal System ✅❌
- Long Signals: Triggered when the loop score exceeds the long threshold.
- Short Signals: Activated when the score falls below the short threshold.
- Avoids false signals by requiring sustained strength before confirming a trend.
4. Customizable Visualization & Colors 🎨
- Multiple color modes (Default, Solar, Warm, Cool, Classic) for tailored aesthetics.
- Extra plot options enhance visualization of market structure and volatility.
________
How It Works:
- HyMA Calculation : A unique moving average with a specialized weighting function to
smooth out price action.
- Loop Function : Iterates over past HyMA values, assessing whether price is consistently
higher or lower.
- Threshold Comparison : The loop score is compared against pre-set thresholds to
determine bullish or bearish conditions.
- Signal Generation :
1. Bullish (🔵): If the score crosses the long threshold
2. Bearish (🔴): If the score drops below the short threshold.
- Plotting & Styling : Dynamic candles and gradient overlays provide an intuitive
visualization of rend shifts.
________
Use Cases:
✅ Ideal for trend-following traders looking for solid trends confirmation.
✅ Helps filter out choppy market conditions by adjusting sensitivity dynamically.
✅ Works well with other indicators (e.g., ADX, volume-based filters) for added confirmation.
✅ Suitable for both short-term and long-term trend analysis.
________
Customization Options:
- Adjustable HyMA Length: Modify the responsiveness of the moving average. Default se to 2.
- For-Loop Parameters: Fine-tune how far back the trend analysis should consider. Default se to Start = 1 , End = -1.
- Thresholds for Long & Short: Control signal sensitivity to market fluctuations. Default set to Long = 40, Short = 8.
- Color Modes & Extra Plots: Personalize visualization for better clarity.
________
Conclusion:
The Hyper MA Loop | QuantEdgeB is a powerful, adaptive indicator that combines custom moving averages with loop-based trend analysis to deliver accurate, visually intuitive market signals. Whether you're looking to ride strong trends or filter out weak setups, this tool provides the precision and flexibility needed for effective decision-making. 🚀📈
🔹 Disclaimer: Past performance is not indicative of future results. No trading indicator can guarantee success in financial markets.
🔹 Strategic Consideration: As always, backtesting and strategic adjustments are essential to fully optimize this indicator for real-world trading. Traders should consider risk management practices and adapt settings to their specific market conditions and trading style.