Hidden Zone Detector AI - Crypto/Forex/StockHidden Zone Detector AI - Crypto Forex Stock
Hidden Zone Detector AI is a professional TradingView indicator designed to find hidden supply and demand zones across markets — crypto, forex and stocks — and surface high-probability areas earlier than classical pivot-only methods. It combines price structure analysis, volatility/ATR sizing, volume profiling and multi-mode AI heuristics (Fast / Balanced / Accurate) to generate prediction zones, highlight tested areas, and visually mark zone breakouts. Built with practical trader workflow in mind: configurable anti-repaint options, adaptable Light/Dark UI, clear labels, and candle-coloring for immediate visual context.
How it works
• Detects hidden zones by scanning pivot formations and finding internal “hidden” bars that represent real institutional activity (not just visible swing points).
• Scores zones by size (ATR-relative), volume, and touch characteristics to produce a strength percentage (Weak/Medium/Strong).
• AI heuristics aggregate price, momentum, moving averages, RSI/MACD signals and volume patterns to propose prediction zones — adjustable for speed vs. accuracy.
• Zones are drawn as persistent boxes with optional midlines, labels, and tailored styling when broken or tested.
Main advantages
• Early edge: finds hidden zones that often act before obvious pivots.
• Actionable visuals: labeled zones, color-coded candles, and breakout styling speed decision-making.
• Flexible AI modes: choose Fast for responsiveness, Balanced for day-to-day use, or Accurate for stricter signals.
• Anti-repaint controls: require confirmed bars for predictions to improve signal reliability.
• Multi-market ready: tuned for crypto, forex and stock chart behavior.
• Light/Dark friendly: UI color handling ensures labels remain readable on any chart background.
• Open & reusable: released under Mozilla Public License 2.0 (MPL-2.0) — use and adapt freely with attribution.
Best practices & tips
• Start with Balanced mode and sensitivity ~5; increase sensitivity for earlier but noisier predictions.
• Use prediction confirmation (Require AI Prediction Confirmation) for lower repaint risk.
• Combine zone reads with higher-timeframe context and orderflow/volume tools for stronger entries.
• Adjust max active zones and opacity to keep charts clean on lower timeframes.
License & author
Mozilla Public License 2.0 (MPL-2.0).
Author: a_jabbaroff — created with care for the TradingView community and fellow traders.
Search in scripts for "ai"

MBAND 200 4H BTC/USDT - By MGS-TradingMBAND 200 4H BTC/USDT with RSI and Volume by MGS-Trading: A Neural Network-Inspired Indicator
Introduction:
The MBAND 200 4H BTC/USDT with RSI and Volume represents a groundbreaking achievement in the integration of artificial intelligence (AI) into cryptocurrency market analysis. Developed by MGS-Trading, this indicator is the culmination of extensive research and development efforts aimed at leveraging AI's power to enhance trading strategies. By synthesizing neural network concepts with traditional technical analysis, the MBAND indicator offers a dynamic, multi-dimensional view of the market, providing traders with unparalleled insights and actionable signals.
Innovative Approach:
Our journey to create the MBAND indicator began with a simple question: How can we mimic the decision-making prowess of a neural network in a trading indicator? The answer lay in the weighted aggregation of Exponential Moving Averages (EMAs) from multiple timeframes, each serving as a unique input akin to a neuron in a neural network. These weights are not arbitrary; they were painstakingly optimized through backtesting across various market conditions to ensure they reflect the significance of each timeframe’s contribution to overall market dynamics.
Core Features:
Neural Network-Inspired Weights: The heart of the MBAND indicator lies in its AI-inspired weighting system, which treats each timeframe’s EMA as an input node in a neural network. This allows the indicator to process complex market data in a nuanced and sophisticated manner, leading to more refined and informed trading signals.
Multi-Timeframe EMA Analysis: By analyzing EMAs from 15 minutes to 3 days, the MBAND indicator captures a comprehensive snapshot of market trends, enabling traders to make informed decisions based on a broad spectrum of data.
RSI and Volume Integration: The inclusion of the Relative Strength Index (RSI) and volume data adds layers of confirmation to the signals generated by the EMA bands. This multi-indicator approach helps in identifying high-probability setups, reinforcing the neural network’s concept of leveraging multiple data points for decision-making.
Usage Guidelines:
Signal Interpretation: The MBAND bands provide a visual representation of the market’s momentum and direction. A price moving above the upper band signals strength and potential continuation of an uptrend, while a move below the lower band suggests weakness and a possible downtrend.
Overbought/Oversold Conditions: The RSI component identifies when the asset is potentially overbought (>70) or oversold (<30). Traders should watch for these conditions near the MBAND levels for potential reversal opportunities.
Volume Confirmation: An increase in volume accompanying a price move towards or beyond an MBAND level serves as confirmation of the strength behind the move. This can indicate whether a breakout is likely to sustain or if a reversal has substantial backing.
Strategic Entry and Exit Points: Combine the MBAND readings with RSI and volume indicators to pinpoint strategic entry and exit points. For example, consider entering a long position when the price is near the lower MBAND, RSI indicates oversold conditions, and there is a notable volume increase.
About MGS-Trading:
At MGS-Trading, we are passionate about harnessing the transformative power of AI to revolutionize cryptocurrency trading. Our indicators and tools are designed to provide traders with advanced analytics and insights, drawing on the latest AI techniques and methodologies. The MBAND 200 4H BTC/USDT with RSI and Volume indicator is a prime example of our commitment to innovation, offering traders a sophisticated, AI-enhanced tool for navigating the complexities of the cryptocurrency markets.
Disclaimer:
The MBAND indicator is provided for informational purposes only and does not constitute investment advice. Trading cryptocurrencies involves significant risk and can result in the loss of your investment. We recommend conducting your own research and consulting with a qualified financial advisor before making any trading decisions.

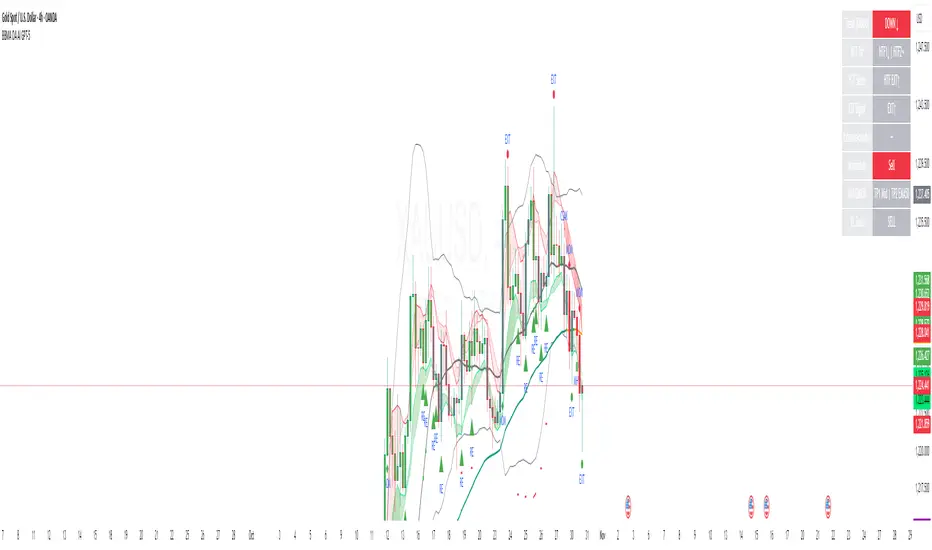
Execution Heatmap v4.1 — AI EnhancedThis indicator is an AI‑style execution dashboard that compresses structure, momentum, volume, volatility, and risk into a compact heatmap panel plus BUY/SELL signals on the chart. It is specifically tuned for gold and silver, automatically adapting its thresholds to the volatility profile of XAU/GC and XAG/SI symbols.
Core architecture
The system builds a multi‑factor model in layers:
Adaptive structure engine: Tracks dynamic higher‑high / lower‑low progression using rolling reference highs and lows, classifying price as structural UP, DOWN, or NEUTRAL.
Precision VWAP bias: Uses VWAP with a small threshold band to filter out noise and label price as ABOVE, BELOW, or neutral relative to value.
Impulse & angle: Combines short‑term rate of change and normalized slope (price vs ATR over 5 bars) to detect directional thrust, then clamps values into
for stable scoring.
Volume, wicks, and patterns
Adaptive volume tiers: Uses a 20‑bar volume average with gold/silver‑specific multipliers to tag candles as SURGE, HIGH, NORMAL, or LOW volume, with distinct coloring for extremes.
Wick analytics: Measures upper/lower wick size vs total range to detect demand/supply style rejections and encode them as bullish or bearish wick signals.
AI pattern score: Blends structure, VWAP, impulse, wicks, and angle into a normalized pattern score, then classifies it as STRONG↑, NEU↑, NEU, NEU↓, or STRONG↓ with color‑coded emphasis.
AI scoring and prediction layer
Predictive engine: Uses a neural‑network‑style weighted sum of structure, VWAP, impulse, wicks, angle, volume, and pattern to generate a prediction score in
, then converts it into a percentage and arrow (↑, ↑↑, ↓, ↓↓, →) for intuitive directional bias.
Execution score: Aggregates key factors into an EXEC score (0–200+ style scale), color‑graded from weak (red) through medium (orange) to strong (green) execution context.
Uncertainty & risk: Separately models uncertainty (low impulse/angle or low conviction) and risk (fake breaks, VWAP position, uncertainty tier, low volume), then feeds them into a combined confidence calculation.
Final signal & confidence
Final classification:
BUY: High exec score, high confidence, and controlled risk.
SELL: Very low exec score, low confidence in upside, and acceptable risk.
WAIT: All other conditions where edge or clarity is insufficient.
Confidence bar: A textual mini‑bar (🟩 blocks) plus percentage shows how strong the current signal environment is, making it easy to visually gauge setup quality at a glance.
Professional heatmap panel
A two‑column table in the top‑right of the chart organizes the logic into layers:
Base layer: STRUCT, VWAP, IMPULSE, VOLUME.
AI layer: FAKE, REGIME (Trend/Pullback/Reverse/Chop), ANGLE.
Decision layer: PATTERN, PREDICT, EXEC, RISK, CONF, and FINAL direction.

Flux AI PullBack System (Hybrid Pro)Flux AI PullBack System (Hybrid Pro)
//Session-Aware | Adaptive Confluence | Grace Confirm Logic//
Overview:
The Flux AI PullBack System (Hybrid Pro v5) is an adaptive, session-aware pullback indicator designed to identify high-probability continuation setups within trending markets. It automatically adjusts between “Classic” and “Enhanced” logic modes based on volatility, volume, and ATR slope, allowing it to perform seamlessly across different market sessions (Asian, London, and New York).
Core Features:
Hybrid Auto Mode — Dynamically switches between Classic (fast-moving) and Enhanced (strict) modes.
Session-Aware Context — Optimized for intraday trading in ES, NQ, and SPY.
Grace Confirmation Logic — Validates pullbacks with a follow-through condition to reduce noise.
Adaptive EMA Zone (38/62) — Highlights pullback areas with dynamic aqua fill and transparency linked to trend strength.
Noise Suppression Filter — Prevents false pullbacks during EMA crossovers or unstable transitions.
Weighted Confluence Model — Combines trend, ATR, volume, and swing structure for confirmation strength.
Pine v6 Compliant Alerts — Constant-string safe, ready for webhooks and automation.
Visual Elements:
Aqua EMA Zone: Displays the “breathing” pullback band (tightens during volatility spikes).
PB↑ / PB↓ Markers: Confirmed pullbacks with subtle transparency and fixed label size.
Bar Highlights: Yellow for pullbacks; ice-blue for confirmed continuation.
Use Cases
Perfect for:
Intraday trend traders
0DTE SPX / ES scalpers
Futures traders (NQ, MNQ, MES)
Algorithmic strategy builders using webhooks
Recommended Timeframes:
1–15 minute charts (scalping / intraday)
Higher timeframes for swing confirmations.
Attribution:
This open-source script was inspired by Chris Moody’s “CM Slingshot System” and JustUncleL’s Pullback Tools, but it was built from scratch using AI-assisted code refinement (ChatGPT).
All logic and enhancements are original, not derived from proprietary software.
License: MIT (Open Source)
© 2025 Ken Anderson — You may modify, use, or redistribute with credit.
Keywords:
Pullback, Reversal, AI Trading, EMA Zone, Session Aware, Futures Trading, SPX, ES, NQ, ATR Filter, Volume Confirmation, Flux System, Pine Script v6, Non-Repainting, Adaptive Trading Indicator.

Chainbey Ai - Swing High/Low Range📈 Chainbey Ai – Swing High / Swing Low Range
Chainbey Ai – Swing High / Swing Low Range is a clean and powerful market-structure indicator designed to automatically identify key swing levels and visualize the active price range on any chart.
This tool helps traders clearly see where price is reacting, consolidating, or preparing for a breakout.
🔹 What This Indicator Does
✔ Automatically detects the latest confirmed Swing High
✔ Automatically detects the latest confirmed Swing Low
✔ Draws horizontal levels for both swings
✔ Labels levels clearly as “Swing High” and “Swing Low”
✔ Highlights the range between swings using a background fill
✔ Updates dynamically as new market structure forms
🔹 Why It’s Useful
Identify support & resistance without manual drawing
Visualize consolidation zones instantly
Spot breakout and fake-out areas faster
Ideal for range trading, breakout trading, and trend confirmation
Works perfectly with price action, volume, and order-flow concepts
🔹 Best Use Cases
Crypto (Spot & Futures)
Forex
Indices
Commodities (Gold, Silver, Oil)
Timeframes: Works on all timeframes (especially strong on 15M, 30M, 1H)
🔹 How to Trade With It
Buy bias when price holds above Swing Low inside the range
Sell bias when price rejects from Swing High
Breakout confirmation when price closes strongly outside the range
Combine with volume, momentum, or liquidity concepts for higher accuracy
🔹 Customization
Adjust Swing Length to control sensitivity
Enable/disable range background fill
Customize colors and transparency
Extend swing levels to the right for forward guidance
⚠️ Disclaimer
This indicator is a technical analysis tool, not financial advice.
Always manage risk and confirm signals with your own strategy.
🔗 Built by Chainbey Ai
Smart Structure • Clean Levels • Clear Ranges 🚀

SuperTrend AI Oscillator StrategySuperTrend AI Oscillator Strategy
Overview
This strategy is a trend-following approach that combines the SuperTrend indicator with oscillator-based filtering.
By identifying market trends while utilizing oscillator-based momentum analysis, it aims to improve entry precision.
Additionally, it incorporates a trailing stop to strengthen risk management while maximizing profits.
This strategy can be applied to various markets, including Forex, Crypto, and Stocks, as well as different timeframes. However, its effectiveness varies depending on market conditions, so thorough testing is required.
Features
1️⃣ Trend Identification Using SuperTrend
The SuperTrend indicator (a volatility-adjusted trend indicator based on ATR) is used to determine trend direction.
A long entry is considered when SuperTrend turns bullish.
A short entry is considered when SuperTrend turns bearish.
The goal is to capture clear trend reversals and avoid unnecessary trades in ranging markets.
2️⃣ Entry Filtering with an Oscillator
The Super Oscillator is used to filter entry signals.
If the oscillator exceeds 50, it strengthens long entries (indicating strong bullish momentum).
If the oscillator drops below 50, it strengthens short entries (indicating strong bearish momentum).
This filter helps reduce trades in uncertain market conditions and improves entry accuracy.
3️⃣ Risk Management with a Trailing Stop
Instead of a fixed stop loss, a SuperTrend-based trailing stop is implemented.
The stop level adjusts automatically based on market volatility.
This allows profits to run while managing downside risk effectively.
4️⃣ Adjustable Risk-Reward Ratio
The default risk-reward ratio is set at 1:2.
Example: A 1% stop loss corresponds to a 2% take profit target.
The ratio can be customized according to the trader’s risk tolerance.
5️⃣ Clear Trade Signals & Visual Support
Green "BUY" labels indicate long entry signals.
Red "SELL" labels indicate short entry signals.
The Super Oscillator is plotted in a separate subwindow to visually assess trend strength.
A real-time trailing stop is displayed to support exit strategies.
These visual aids make it easier to identify entry and exit points.
Trading Parameters & Considerations
Initial Account Balance: Default is $7,000 (adjustable).
Base Currency: USD
Order Size: 10,000 USD
Pyramiding: 1
Trading Fees: $0.94 per trade
Long Position Margin: 50%
Short Position Margin: 50%
Total Trades (M5 Timeframe): 1,032
Visual Aids for Clarity
This strategy includes clear visual trade signals to enhance decision-making:
Green "BUY" labels for long entries
Red "SELL" labels for short entries
Super Oscillator plotted in a subwindow with a 50 midline
Dynamic trailing stop displayed for real-time trend tracking
These visual aids allow traders to quickly identify trade setups and manage positions with greater confidence.
Summary
The SuperTrend AI Oscillator Strategy is developed based on indicators from Black Cat and LuxAlgo.
By integrating high-precision trend analysis with AI-based oscillator filtering, it provides a strong risk-managed trading approach.
Important Notes
This strategy does not guarantee profits—performance varies based on market conditions.
Past performance does not guarantee future results. Markets are constantly changing.
Always test extensively with backtesting and demo trading before using it in live markets.
Risk management, position sizing, and market conditions should always be considered when trading.
Conclusion
This strategy combines trend analysis with momentum filtering, enhancing risk management in trading.
By following market trends carefully, making precise entries, and using trailing stops, it seeks to reduce risk while maximizing potential profits.
Before using this strategy, be sure to test it thoroughly via backtesting and demo trading, and adjust the settings to match your trading style.

Chainbey AI - Pattern Memory Table (v2)Chainbey AI – Pattern Memory & Market Outcome Table
Chainbey AI Pattern Memory is an advanced market behavior reference indicator designed to help traders understand how the current price structure compares with historical market patterns.
Instead of repainting signals or forcing trades, this tool focuses on context awareness:
It analyzes the current price pattern range
Matches it against selected historical price structures
Displays how price reacted after similar patterns in the past
Shows an estimated directional outcome and momentum strength
All results are presented in a lightweight on-chart table, keeping the chart clean and readable.
🔍 What this indicator shows
📅 Matched historical date & time
📈 Expected direction (UP / DOWN / FLAT)
📊 Historical move percentage
⚡ Estimated momentum strength
🧠 Similarity score (lower = closer pattern match)
🎯 How traders use it
Confirm bias before entering a trade
Understand historical reactions at similar market structures
Avoid emotional decisions by referencing past behavior
Combine with support/resistance, volume, RSI, or trend tools
⚠️ This indicator does NOT generate buy/sell signals.
It is a decision-support & market insight tool, best used alongside your own strategy.
🧩 Best use cases
Crypto, Forex, Commodities, Indices
Intraday & swing trading
Market structure and pattern-based strategies
Bias confirmation before entries
⚠️ Disclaimer
This indicator is for educational and analytical purposes only.
It does not guarantee future performance and should not be considered financial advice.

BBMA OA - AI GPT-5This indicator is an AI-assisted implementation of the BBMA OA (Bollinger Bands + Moving Average) trading strategy, originally introduced by Malaysian trader Oma Ally. The code was generated and optimized using the GPT-5 AI model to ensure clean Pine Script v6 structure and compatibility.
The system combines Bollinger Bands (20, 2) with EMA50, EMA200, and MA5/10 High-Low to identify the four main BBMA OA patterns:
Extreme
Market Hilang Volume (MHV)
Candle Arah Kukuh (CSAK)
Re-entry (RRE, REE, REM)
Features:
Multi Time Frame confirmation for higher accuracy
Automatic signal detection with visual markers
Trend ribbon and candle coloring
Optimized Pine Script v6, free from errors/warnings
⚠ This is an adaptation of Oma Ally’s concept for educational purposes, not an official version. Past performance does not guarantee future results.
ZoneShift+StochZ+LRO + AI Breakout Bands [Combined]This composite Pine Script brings together four powerful trend and momentum tools into a single, easy-to-read overlay:
ZoneShift
Computes a dynamic “zone” around price via an EMA/HMA midpoint ± average high-low range.
Flags flips when price closes convincingly above or below that zone, coloring candles and drawing the zone lines in bullish or bearish hues.
Stochastic Z-Score
Converts your chosen price series into a statistical Z-score, then runs a Stochastic oscillator on it and HMA-smooths the result.
Marks momentum flips in extreme over-sold (below –2) or over-bought (above +2) territory.
Linear Regression Oscillator (LRO)
Builds a bar-indexed linear regression, normalizes it to standard deviations, and shows area-style up/down coloring.
Highlights local reversals when the oscillator crosses its own look-back values, and optionally plots LRO-colored candles on price.
AI Breakout Bands (Kalman + KNN)
Applies a Kalman filter to price, smooths it further with a KNN-weighted average, then measures mean-absolute-error bands around that smoothed line.
Colors the Kalman trend line and bands for bullish/bearish breaks, giving you a data-driven channel to trade.
Composite Signals & Alerts
Whenever the ZoneShift flip, Stoch Z-Score flip, and LRO reversal all agree and price breaks the AI bands in the same direction, the script plots a clear ▲ (bull) or ▼ (bear) on the chart and fires an alert. This triple-confirmation approach helps you zero in on high-probability reversal points, filtering out noise and combining trend, momentum, and statistical breakout criteria into one unified signal.

Auto Intelligence Selective Moving Average(AI/MA)# 🤖 Auto Intelligence Moving Average Strategy (AI/MA)
**AI/MA** is a state-adaptive moving average crossover strategy designed to **maximize returns from golden cross / death cross logic** by intelligently switching between different MA types and parameters based on market conditions.
---
## 🎯 Objective
To build a moving average crossover strategy that:
- **Adapts dynamically** to market regimes (trend vs range, rising vs falling)
- **Switches intelligently** between SMA, EMA, RMA, and HMA
- **Maximizes cumulative return** under realistic backtesting
---
## 🧪 materials amd methods
- **MA Types Considered**: SMA, EMA, RMA, HMA
- **Parameter Ranges**: Periods from 5 to 40
- **Market Conditions Classification**:
- Based on the slope of a central SMA(20) line
- And the relative position of price to the central line
- Resulting in 4 regimes: A (Bull), B (Pullback), C (Rebound), D (Bear)
- **Optimization Dataset**:
- **Bybit BTCUSDT.P**
- **1-hour candles**
- **2024 full-year**
- **Search Process**:
- **Random search**: 200 parameter combinations
- Evaluated by:
- `Cumulative PnL`
- `Sharpe Ratio`
- `Max Drawdown`
- `R² of linear regression on cumulative PnL`
- **Implementation**:
- Optimization performed in **Python (Pandas + Matplotlib + Optuna-like logic)**
- Final parameters ported to **Pine Script (v5)** for TradingView backtesting
---
## 📈 Performance Highlights (on optimization set)
| Timeframe | Return (%) | Notes |
|-----------|------------|----------------------------|
| 6H | +1731% | Strongest performance |
| 1D | +1691% | Excellent trend capture |
| 12H | +1438% | Balance of trend/range |
| 5min | +27.3% | Even survives scalping |
| 1min | +9.34% | Robust against noise |
- Leverage: 100x
- Position size: 100%
- Fees: 0.055%
- Margin calls: **none** 🎯
---
## 🛠 Technology Stack
- `Python` for data handling and optimization
- `Pine Script v5` for implementation and visualization
- Fully state-aware strategy, modular and extendable
---
## ✨ Final Words
This strategy is **not curve-fitted**, **not over-parameterized**, and has been validated across multiple timeframes. If you're a fan of dynamic, intelligent technical systems, feel free to use and expand it.
💡 The future of simple-yet-smart trading begins here.

Machine Learning Moving Average [LuxAlgo]The Machine Learning Moving Average (MLMA) is a responsive moving average making use of the weighting function obtained Gaussian Process Regression method. Characteristic such as responsiveness and smoothness can be adjusted by the user from the settings.
The moving average also includes bands, used to highlight possible reversals.
🔶 USAGE
The Machine Learning Moving Average smooths out noisy variations from the price, directly estimating the underlying trend in the price.
A higher "Window" setting will return a longer-term moving average while increasing the "Forecast" setting will affect the responsiveness and smoothness of the moving average, with higher positive values returning a more responsive moving average and negative values returning a smoother but less responsive moving average.
Do note that an excessively high "Forecast" setting will result in overshoots, with the moving average having a poor fit with the price.
The moving average color is determined according to the estimated trend direction based on the bands described below, shifting to blue (default) in an uptrend and fushia (default) in downtrends.
The upper and lower extremities represent the range within which price movements likely fluctuate.
Signals are generated when the price crosses above or below the band extremities, with turning points being highlighted by colored circles on the chart.
🔶 SETTINGS
Window: Calculation period of the moving average. Higher values yield a smoother average, emphasizing long-term trends and filtering out short-term fluctuations.
Forecast: Sets the projection horizon for Gaussian Process Regression. Higher values create a more responsive moving average but will result in more overshoots, potentially worsening the fit with the price. Negative values will result in a smoother moving average.
Sigma: Controls the standard deviation of the Gaussian kernel, influencing weight distribution. Higher Sigma values return a longer-term moving average.
Multiplicative Factor: Adjusts the upper and lower extremity bounds, with higher values widening the bands and lowering the amount of returned turning points.
🔶 RELATED SCRIPTS
Machine-Learning-Gaussian-Process-Regression
SuperTrend-AI-Clustering

Multi-TF AI SuperTrend with ADX - Strategy [PresentTrading]
## █ Introduction and How it is Different
The trading strategy in question is an enhanced version of the SuperTrend indicator, combined with AI elements and an ADX filter. It's a multi-timeframe strategy that incorporates two SuperTrends from different timeframes and utilizes a k-nearest neighbors (KNN) algorithm for trend prediction. It's different from traditional SuperTrend indicators because of its AI-based predictive capabilities and the addition of the ADX filter for trend strength.
BTC 8hr Performance
ETH 8hr Performance
## █ Strategy, How it Works: Detailed Explanation (Revised)
### Multi-Timeframe Approach
The strategy leverages the power of multiple timeframes by incorporating two SuperTrend indicators, each calculated on a different timeframe. This multi-timeframe approach provides a holistic view of the market's trend. For example, a 8-hour timeframe might capture the medium-term trend, while a daily timeframe could capture the longer-term trend. When both SuperTrends align, the strategy confirms a more robust trend.
### K-Nearest Neighbors (KNN)
The KNN algorithm is used to classify the direction of the trend based on historical SuperTrend values. It uses weighted voting of the 'k' nearest data points. For each point, it looks at its 'k' closest neighbors and takes a weighted average of their labels to predict the current label. The KNN algorithm is applied separately to each timeframe's SuperTrend data.
### SuperTrend Indicators
Two SuperTrend indicators are used, each from a different timeframe. They are calculated using different moving averages and ATR lengths as per user settings. The SuperTrend values are then smoothed to make them suitable for KNN-based prediction.
### ADX and DMI Filters
The ADX filter is used to eliminate weak trends. Only when the ADX is above 20 and the directional movement index (DMI) confirms the trend direction, does the strategy signal a buy or sell.
### Combining Elements
A trade signal is generated only when both SuperTrends and the ADX filter confirm the trend direction. This multi-timeframe, multi-indicator approach reduces false positives and increases the robustness of the strategy.
By considering multiple timeframes and using machine learning for trend classification, the strategy aims to provide more accurate and reliable trade signals.
BTC 8hr Performance (Zoom-in)
## █ Trade Direction
The strategy allows users to specify the trade direction as 'Long', 'Short', or 'Both'. This is useful for traders who have a specific market bias. For instance, in a bullish market, one might choose to only take 'Long' trades.
## █ Usage
Parameters: Adjust the number of neighbors, data points, and moving averages according to the asset and market conditions.
Trade Direction: Choose your preferred trading direction based on your market outlook.
ADX Filter: Optionally, enable the ADX filter to avoid trading in a sideways market.
Risk Management: Use the trailing stop-loss feature to manage risks.
## █ Default Settings
Neighbors (K): 3
Data points for KNN: 12
SuperTrend Length: 10 and 5 for the two different SuperTrends
ATR Multiplier: 3.0 for both
ADX Length: 21
ADX Time Frame: 240
Default trading direction: Both
By customizing these settings, traders can tailor the strategy to fit various trading styles and assets.

Double AI Super Trend Trading - Strategy [PresentTrading]█ Introduction and How It is Different
The Double AI Super Trend Trading Strategy is a cutting-edge approach that leverages the power of not one, but two AI algorithms, in tandem with the SuperTrend technical indicator. The strategy aims to provide traders with enhanced precision in market entry and exit points. It is designed to adapt to market conditions dynamically, offering the flexibility to trade in both bullish and bearish markets.
*The KNN part is mainly referred from @Zeiierman.
BTCUSD 8hr performance
ETHUSD 8hr performance
█ Strategy, How It Works: Detailed Explanation
1. SuperTrend Calculation
The SuperTrend is a popular indicator that captures market trends through a combination of the Volume-Weighted Moving Average (VWMA) and the Average True Range (ATR). This strategy utilizes two sets of SuperTrend calculations with varying lengths and factors to capture both short-term and long-term market trends.
2. KNN Algorithm
The strategy employs k-Nearest Neighbors (KNN) algorithms, which are supervised machine learning models. Two sets of KNN algorithms are used, each focused on different lengths of historical data and number of neighbors. The KNN algorithms classify the current SuperTrend data point as bullish or bearish based on the weighted sum of the labels of the k closest historical data points.
3. Signal Generation
Based on the KNN classifications and the SuperTrend indicator, the strategy generates signals for the start of a new trend and the continuation of an existing trend.
4. Trading Logic
The strategy uses these signals to enter long or short positions. It also incorporates dynamic trailing stops for exit conditions.
Local picture
█ Trade Direction
The strategy allows traders to specify their trading direction: long, short, or both. This enables the strategy to be versatile and adapt to various market conditions.
█ Usage
ToolTips: Comprehensive tooltips are provided for each parameter to guide the user through the customization process.
Inputs: Traders can customize numerous parameters including the number of neighbors in KNN, ATR multiplier, and types of moving averages.
Plotting: The strategy also provides visual cues on the chart to indicate bullish or bearish trends.
Order Execution: Based on the generated signals, the strategy will execute buy or sell orders automatically.
█ Default Settings
The default settings are configured to offer a balanced approach suitable for most scenarios:
Initial Capital: $10,000
Default Quantity Type: 10% of equity
Commission: 0.1%
Slippage: 1
Currency: USD
These settings can be modified to suit various trading styles and asset classes.

Chainbey Ai - Liquidity Zones (Pivot Sweeps) - Chain Style📌 Indicator Description
Chainbey Ai – Liquidity Zones (Pivot Sweeps) – Chain Style
This indicator automatically identifies and visualizes liquidity zones on the chart based on confirmed swing highs and lows, helping traders spot areas where stop-loss clusters, institutional interest, and liquidity grabs are likely to occur.
Unlike simple pivot markers, this script draws true liquidity zones (price areas, not single lines) and tracks when price sweeps those zones — a common behavior before strong reversals or continuations.
The indicator is designed to stay stable when switching pairs or timeframes, using time-anchored zones for reliable positioning across all markets.
🔍 Key Features
Buy-Side Liquidity Zones
Marked above swing highs (potential stop-loss pools)
Sell-Side Liquidity Zones
Marked below swing lows
Liquidity Sweep Detection
Highlights when price grabs liquidity using wick or close
Zone Strength Filters
ATR-based swing size filtering
Optional volume confirmation
Cooldown logic to reduce clutter
Time-Anchored Zones
Zones remain aligned when switching symbols or timeframes
Highly Customizable
Control pivot strength, zone size, filters, and visibility
Works on All Markets
Crypto, Forex, Indices, Commodities, Stocks
🧠 How to Use
Trend Continuation
Look for price to sweep liquidity and continue in trend direction
Reversal Setup
Liquidity sweep + rejection can signal potential reversals
Confluence Tool
Combine with trend, RSI, MACD, structure, or volume analysis
Risk Management
Liquidity zones can act as logical SL/TP reference areas
⚠️ This is a market structure & liquidity tool, not a buy/sell signal generator.
Always use confirmation before entering trades.
⚙️ Recommended Settings (BTC 30m)
Pivot Length: 9–12
Min Swing Size (ATR): 1.5 – 2.5
Cooldown Bars: 30 – 50
Max Active Zones: 15 – 20
Volume Filter: Optional (1.2 – 1.4x)

Chainbey Ai - HTF Trend Matrix (Clean)Chainbey Ai – HTF Trend Matrix is a professional, higher-timeframe trend detection indicator designed to give traders a clean, reliable market bias, regardless of the chart timeframe they are trading on.
This indicator automatically analyzes multiple higher timeframes (HTFs) and combines:
EMA trend direction
Trend strength (ADX)
Market structure (trend vs range)
Trend disagreement across HTFs
Reversal probability estimation
All results are displayed in a compact table at the bottom-right, making it perfect for scalpers, day traders, and swing traders who need fast, decision-ready information.
🧠 What This Indicator Solves
❌ No more guessing the higher-timeframe trend
❌ No more trading against the main market bias
❌ No more confusion between trend vs range
✅ Clear BULLISH / BEARISH / RANGE bias
✅ Strength score to avoid weak trends
✅ Reversal probability to manage risk
📊 How to Read the Table (User Manual)
🔹 FINAL Row
Example:
FINAL | BEARISH TREND | -46
Text (BEARISH / BULLISH / RANGE) → Overall market bias
Number (-46) → Trend Strength Score
Trend Score Guide:
Score Meaning
0 to ±20 No trend / Choppy
±20 to ±40 Weak trend
±40 to ±70 Healthy trend
±70+ Very strong / extended trend
📌 Negative = Bearish
📌 Positive = Bullish
🔹 REVERSAL – Possibility (%)
Example:
REVERSAL | Possibility | 45%
This shows the chance of trend exhaustion or reversal.
Reversal % Meaning
0–30% Strong trend continuation
30–50% Normal pullback risk
50%+ High reversal probability
70%+ Dangerous to chase trades
📌 Use this to avoid late entries.
🔹 HTF Rows (60 / 240 / D)
Each row shows:
DIR / STRUCT
Direction from EMA trend
Market structure (TREND / RANGE)
ADX
Trend strength
STRONG / MEDIUM / CHOP
📌 If multiple HTFs agree → higher confidence
📌 If HTFs conflict → reduce position size or wait
🛠 Recommended Trading Usage
✅ Best Practices
Trade in the direction of FINAL trend
Enter on pullbacks, not breakouts
Use lower timeframes only for entries
❌ Avoid
Trading against FINAL bias
Chasing trades when reversal % is high
Over-leveraging in CHOP conditions
🎯 Ideal For
Crypto traders (Spot & Futures)
Forex traders
Gold / Commodity traders
Scalping, Intraday & Swing trading
⚠️ Disclaimer
This indicator is a decision-support tool, not financial advice. Always combine it with proper risk management, confirmations, and your trading plan.

Chainbey Ai - Previous Day High & Low📌 Chainbey Ai – Previous Day High & Low (Source Candle)
This indicator automatically plots the Previous Day High (PDH) and Previous Day Low (PDL) on any intraday chart, starting from the exact candle where those levels were formed — not from the new day open. This removes visual gaps and gives a more accurate market structure view.
🔹 Key Features
✅ Accurate PDH & PDL levels based on the full previous trading day
🎯 Lines start from the actual high/low candle (no artificial gap)
🏷️ Optional PDH / PDL labels placed directly on source candles
🟦 Optional range background fill between PDH and PDL
📊 Works perfectly on 5m, 15m, 30m, 1H intraday charts
⚡ Lightweight, clean, and repaint-safe
🧠 Best Use Cases
Liquidity sweep & stop-hunt detection
Breakout vs fake-breakout analysis
Support / resistance from prior session
London & New York session bias confirmation
⚠️ Notes
Levels are calculated using the broker’s daily session
Designed for intraday trading, not daily/weekly charts

Elite Federal Reserve AIThe Elite Federal Reserve AI indicator provides an analytical framework focused on monitoring economic and market conditions that influence Federal Reserve policy decisions. The indicator examines key relationships and rate-of-change metrics across multiple proxies for monetary policy drivers.
The indicator tracks and analyzes:
• Yield curve dynamics through rate-of-change measurements in short and intermediate-term Treasury yields
• Inflation expectations via TIPS breakeven rate momentum
• Dollar strength and its rate of change over specified periods
• Financial market stress indicators including volatility and sector performance metrics
• Breadth measures through small capitalization stock performance
The indicator calculates momentum and rate-of-change values across these variables to identify shifts in the economic and financial conditions that serve as primary inputs to Federal Reserve decision-making. By monitoring the velocity of change in these key relationships, the indicator provides insight into the changing balance between inflationary pressures, growth expectations, financial stability concerns, and currency dynamics.
This approach focuses on the observable market-based indicators that reflect the underlying economic conditions the Federal Reserve considers in its policy formulation, enabling users to assess the prevailing policy environment through the lens of these critical market relationships and their momentum characteristics.

Elite Correlation Matrix AIThe Elite Correlation Matrix AI indicator provides comprehensive real-time correlation analysis across multiple asset classes, displaying the interrelationships between equities, bonds, commodities, currencies, and volatility instruments.
The indicator calculates and displays correlation coefficients between a predefined set of major market indices and instruments, including:
• Major equity indices (SPY, QQQ, IWM)
• Long-term Treasury bonds (TLT)
• Gold (GLD)
• Crude oil (USO)
• Volatility (VIX)
• US Dollar Index (DXY)
• Bitcoin (BTCUSD)
Key features include:
• Rolling correlation calculations across user-defined periods to identify both short-term and longer-term relationships
• Visual correlation heat map showing the strength and direction of relationships between all tracked instruments
• Detection of correlation breakdowns, which often precede significant market regime shifts
• Dashboard display providing summary metrics of prevailing correlation patterns
The indicator enables users to monitor the current state of market relationships and identify when traditional correlations begin to break down, which frequently serves as an early warning of impending changes in market behavior. By tracking the degree of connectedness between different asset classes, the indicator provides insight into the current risk environment and the potential for diversification effectiveness.
This analysis is particularly valuable for understanding periods of market stress when asset relationships deviate from their normal patterns, as well as identifying environments where traditional correlations hold and where they are undergoing structural changes.

Elite Commodities AIThe Elite Commodities AI indicator provides a comprehensive analytical framework designed specifically for commodities trading. It combines multiple technical components to assess price action within the unique characteristics of commodity markets.
The indicator incorporates the following key elements:
Multi-timeframe RSI analysis across the primary timeframe, 4-hour, and daily periods
Multiple exponential moving averages (fast, slow, and trend) to establish directional context
Volume rate analysis measuring current volume relative to recent average volume
Bollinger Band width analysis to identify periods of volatility contraction
True Range volatility expressed as a percentage of price
The indicator evaluates the interaction between momentum, trend structure, volume participation, and volatility dynamics, which are particularly significant in commodities markets due to their sensitivity to changes in supply-demand fundamentals and large institutional order flow.
By combining these analytical components, the indicator provides a layered assessment of price behavior that captures the interplay between trend development, momentum characteristics, participation levels, and volatility compression—key factors that drive commodity market movements.
This approach enables traders to identify significant price action within the context of prevailing market structure, making it suitable for analyzing both directional trends and consolidation periods that are common in commodity price behavior.2.2s

Elite Bond Market AIDescription:
The Elite Bond Market AI indicator provides a comprehensive analytical framework specifically designed for bond market price action. The indicator combines multiple technical components including multi-timeframe RSI analysis, moving average relationships, volume dynamics, and volatility measurements to identify significant price behavior within the unique characteristics of bond market trading.
The indicator incorporates:
Multi-timeframe RSI evaluation across primary, 4-hour, and daily timeframes
Fast, slow, and trend exponential moving averages for directional context
Volume rate analysis relative to recent average volume
Bollinger Band width measurement for volatility contraction assessment
True Range volatility normalized as a percentage of price
This combination provides a layered analytical approach that captures the interplay between momentum, trend structure, participation levels, and volatility compression—key factors in bond market price discovery and directional moves.


Auto AI Trendlines [TradingFinder] Clustering & Filtering Trends🔵 Introduction
Auto AI trendlines Clustering & Filtering Trends Indicator, draws a variety of trendlines. This auto plotting trendline indicator plots precise trendlines and regression lines, capturing trend dynamics.
Trendline trading is the strongest strategy in the financial market.
Regression lines, unlike trendlines, use statistical fitting to smooth price data, revealing trend slopes. Trendlines connect confirmed pivots, ensuring structural accuracy. Regression lines adapt dynamically.
The indicator’s ascending trendlines mark bullish pivots, while descending ones signal bearish trends. Regression lines extend in steps, reflecting momentum shifts. As the trend is your friend, this tool aligns traders with market flow.
Pivot-based trendlines remain fixed once confirmed, offering reliable support and resistance zones. Regression lines, adjusting to price changes, highlight short-term trend paths. Both are vital for traders across asset classes.
🔵 How to Use
There are four line types that are seen in the image below; Precise uptrend (green) and downtrend (red) lines connect exact price extremes, while Pivot-based uptrend and downtrend lines use significant swing points, both remaining static once formed.
🟣 Precise Trendlines
Trendlines only form after pivot points are confirmed, ensuring reliability. This reduces false signals in choppy markets. Regression lines complement with real-time updates.
The indicator always draws two precise trendlines on confirmed pivot points, one ascending and one descending. These are colored distinctly to mark bullish and bearish trends. They remain fixed, serving as structural anchors.
🟣 Dynamic Regression Lines
Regression lines, adjusting dynamically with price, reflect the latest trend slope for real-time analysis. Use these to identify trend direction and potential reversals.
Regression lines, updated dynamically, reflect real-time price trends and extend in steps. Ascending lines are green, descending ones orange, with shades differing from trendlines. This aids visual distinction.
🟣 Bearish Chart
A Bullish State emerges when uptrend lines outweigh or match downtrend lines, with recent upward momentum signaling a potential rise. Check the trend count in the state table to confirm, using it to plan long positions.
🟣 Bullish Chart
A Bearish State is indicated when downtrend lines dominate or equal uptrend lines, with recent downward moves suggesting a potential drop. Review the state table’s trend count to verify, guiding short position entries. The indicator reflects this shift for strategic planning.
🟣 Alarm
Set alerts for state changes to stay informed of Bullish or Bearish shifts without constant monitoring. For example, a transition to Bullish State may signal a buying opportunity. Toggle alerts On or Off in the settings.
🟣 Market Status
A table summarizes the chart’s status, showing counts of ascending and descending lines. This real-time overview simplifies trend monitoring. Check it to assess market bias instantly.
Monitor the table to track line counts and trend dominance.
A higher count of ascending lines suggests bullish bias. This helps traders align with the prevailing trend.
🔵 Settings
Number of Trendlines : Sets total lines (max 10, min 3), balancing chart clarity and trend coverage.
Max Look Back : Defines historical bars (min 50) for pivot detection, ensuring robust trendlines.
Pivot Range : Sets pivot sensitivity (min 2), adjusting trendline precision to market volatility.
Show Table Checkbox : Toggles display of a table showing ascending/descending line counts.
Alarm : Enable or Disable the alert.
🔵 Conclusion
The multi slopes indicator, blending pivot-based trendlines and dynamic regression lines, maps market trends with precision. Its dual approach captures both structural and short-term momentum.
Customizable settings, like trendline count and pivot range, adapt to diverse trading styles. The real-time table simplifies trend monitoring, enhancing efficiency. It suits forex, stocks, and crypto markets.
While trendlines anchor long-term trends, regression lines track intraday shifts, offering versatility. Contextual analysis, like price action, boosts signal reliability. This indicator empowers data-driven trading decisions.
