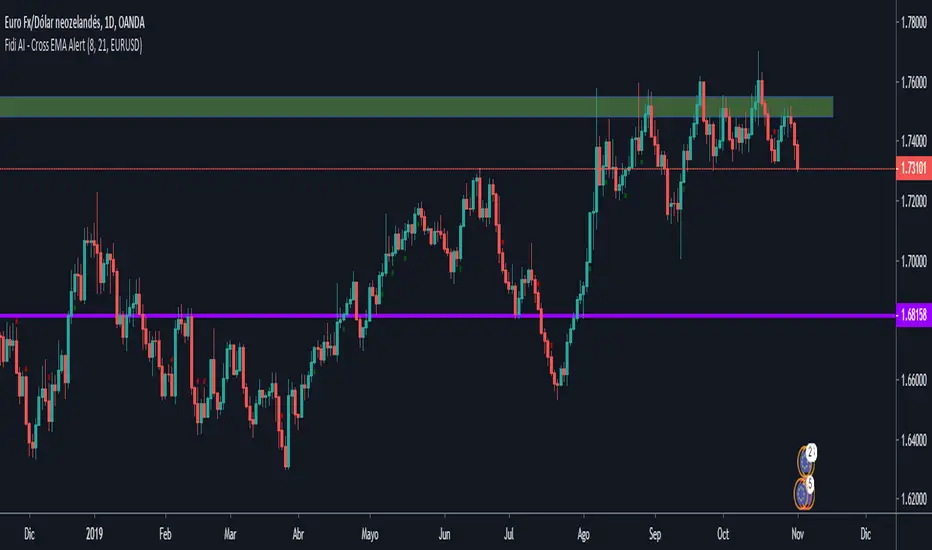
Ema Cross, 10 /21 / 55Ema Cross tool using Ema 10 / Ema 21 / Ema 55
I have found these settings very useful for catching breakouts on Alt coins.
Alerts Added,
Breakout = Ema 10 crossing above Ema 21
Breakdown = Ema 10 crossing under Ema 21
Ema 55 added as a useful area to catch dips when price is trending
Search in scripts for "alert"

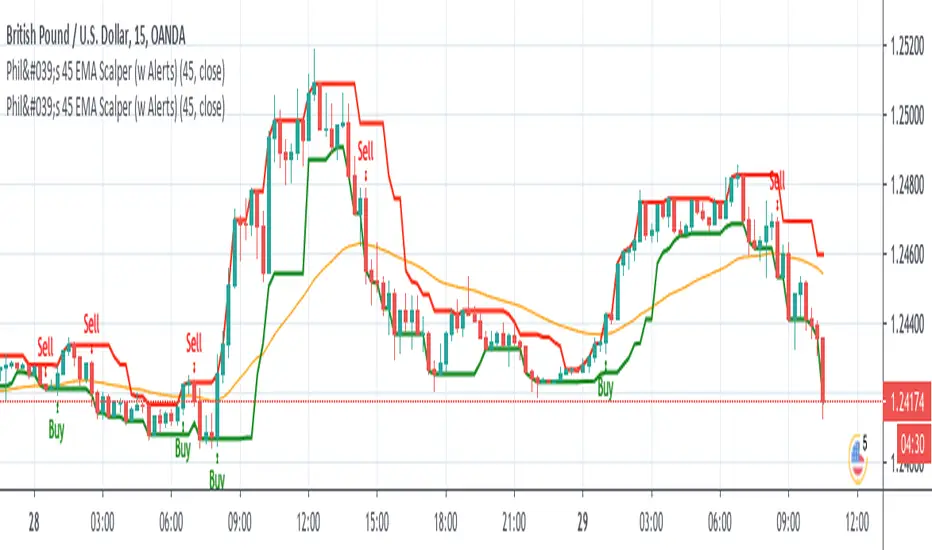
Phil's 45 EMA Scalper - Buy / Sell with Alertsgives buy / sell alert when candle closes above or below 45 EMA respectively.
Ichimoku Kinko Hyo Cloud - no offset - no repaint - strategyIchimoku Kinko Hyo Cloud - no offset - no repaint - RSI filter - strategy
The indicator contains both the standard Ichimoku Cloud , as well as the one without the visual offset.
The Strategy Tester indicates good backtest results when the Ichimoku Cloud is paired with the RSI .
However, it seems it likes to work more as a standalone system.
The indicator can be easily converted to the study() mode by commenting/uncommenting a few lines,
then the alarms can be configured.
There are entry and exit signals ready to be used by the alert system.
The coloring of the cloud without offset contains all 3 conditions: Uptrend , Downtrend , Transition .

Early/Delayed Signal FunctionEarly/Delayed Signal Function (before the bar close or after)
Usually, signals are considered to be valid at the bar close .
Some traders may prefer to have a chance to enter earlier .
It is of great risk , and the Strategy Tester is unable to provide consistent backtest data with regards to this.
But for those who want to integrate such a choice in their strategies, here is the Early Signal Function .
The function takes 2 parameters
- the signal that is considered valid at the bar close , of type bool
- the early time value in seconds, the time before the signal is valid, of type int
it returns a value of type bool - a New Entry Signal
The resulting conditions used for alerts would be:
- newLongCondition = earlySignal_f(myLongSignal, earlyTime)
- newShrtCondition = earlySignal_f(myShrtSignal, earlyTime)
Note: the signals can also be delayed - use a negative value for early time


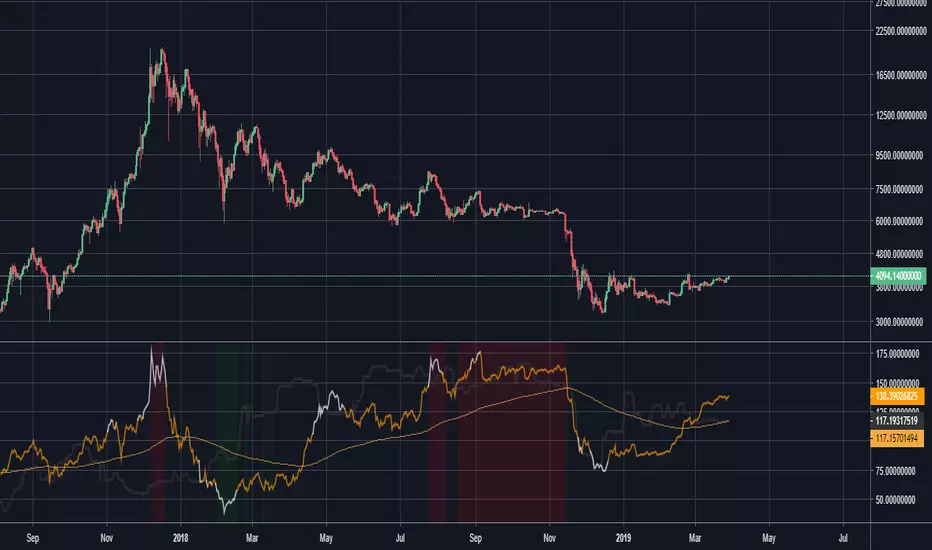
NVT Signal with RMA and thresholds [alertable]NVT Signal, or NVTS, is an indicator that compares the market cap of Bitcoin to the aggregate USD value of daily transactions on the Bitcoin blockchain. It is a value indicator that shows a multiple of Bitcoin price against the actual usage of its blockchain. When the NVTS is low, it suggests Bitcoin price is low relative to the amount of utility the network provides, and vice versa.
For more information on NVTS, visit medium.com
This indicator aims to provide the following:
1. An open-source implementation of NVTS on Tradingview, as the most popular one currently is closed-source.
2. To provide two simple ways to define and visualize "overbought" or "oversold" conditions using the NVTS. Here, we have absolute value of NVTS & deviation from a long-term moving average.
3. Crude integration into Tradingview's alert system.
What this indicator CANNOT do:
1. Timeframes below 1d.
2. Signals based on statistical analyses, such as seen in Bollinger Bands et al. (However, with the appropriate type of account, you can add BBands on top of this indicator.)
I would like to express my gratitude to Willy Woo, Chris Burniske and Dimitry Kalichkin for their work on NVT Ratio and NVT Signal, without which my indicator would not have been created.
Feel free to fork & improve, or experiment with settings. I hope this indicator will be useful to someone.
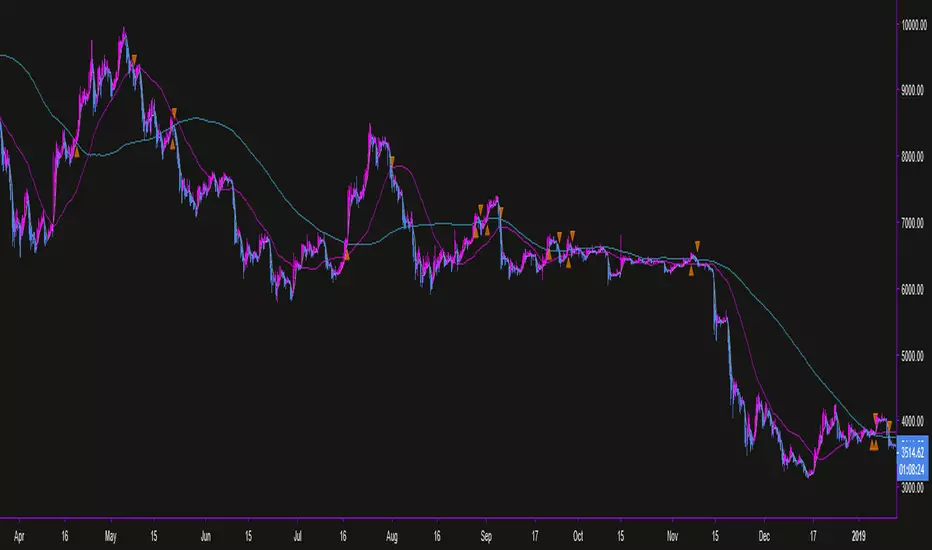
Divergences for many indicators v2.0A gift from me to all.
This script is developed to find Divergences for many indicators. it analyses divergences and then draws line on the graph. red for negatif, lime for positive divergences.
Currently script checks divergence for RSI, MACD, MACD Histogram, Stochastic, CCI, Momentum, OBV, Diosc, VWMACD and CMF indicators. You can use some or all of these indicators to check divergences as you wish by choosing them on the menu. Also you can add/remove many other indicators to the script to check if there is divergence.
The script first calculates tops/bottoms by using higher time frame zig zag and then finds divergences.
Higher Time Frames are
if currend period 1 min => HTF = 5 mins
if currend period 3 mins => HTF = 15 mins
if currend period 5 mins => HTF = 15 mins
if currend period 15 mins => HTF = 1 hour
if currend period 30 mins => HTF = 1 hour
if currend period 45 mins => HTF = 1 hour
if currend period 1 hour => HTF = 4 hours
if currend period 2 hours => HTF = 4 hours
if currend period 3 hours => HTF = 4 hours
if currend period 4 hours => HTF = 1 day
if currend period 1 day => HTF = 1 week
if currend period 1 week => HTF = 1 week
future plan : script finds regular divergences, soon I will add hidden divergences and also I plan to add alert ;)

Simple Moving Averages Alert Scriptcan set alerts on 3 moving averages (crossovers) , experiment with different moving average lengths in the input settings menu, there is also a toggle switch which turns off the 3rd moving average being used as a stop.
will add a backtesting version at some point
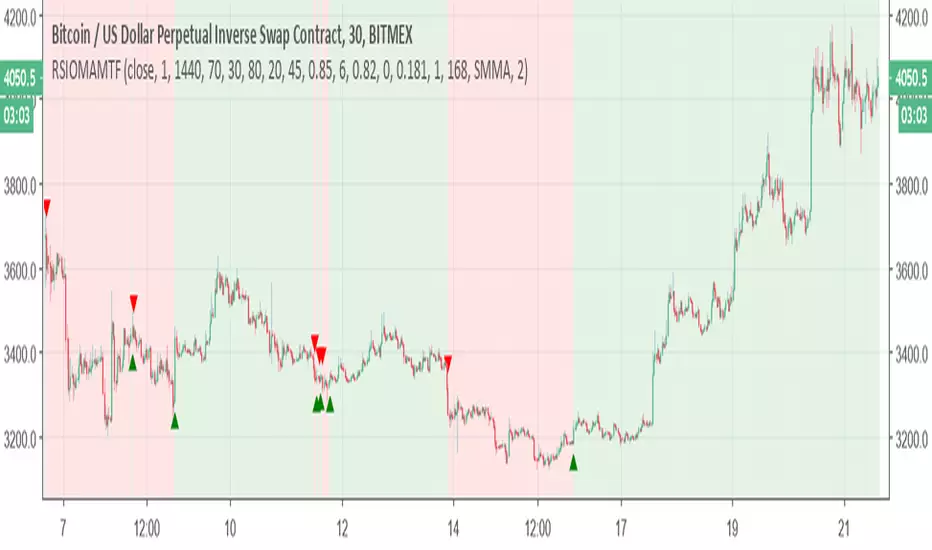
Relative Strength Index of Moving Average MTF alertsAll credit to this study is for chris jhoncic , this is MTF version with alert of his study
basic idea is hybrid of RSI and different MA
You can choose which MA from the following list:
Tillson Moving Average (T3)
Double Exponential Moving Average ( DEMA )
Arnaud Legoux Moving Average ( ALMA )
Least Squares Moving Average ( LSMA )
Simple Moving Average ( SMA )
Exponential Moving Average ( EMA )
Weighted Moving Average ( WMA )
Smoothed Moving Average ( SMMA )
Triple Exponential Moving Average ( TEMA )
Hull Moving Average ( HMA )
Adaptive moving average (AMA)
Fractal Adaptive Moving Average (FAMA)
Variable Index Dynamic Average ( VIDYA )
Triangular Moving Average (TRIMA)
to change the time frame change int2 to what you desire
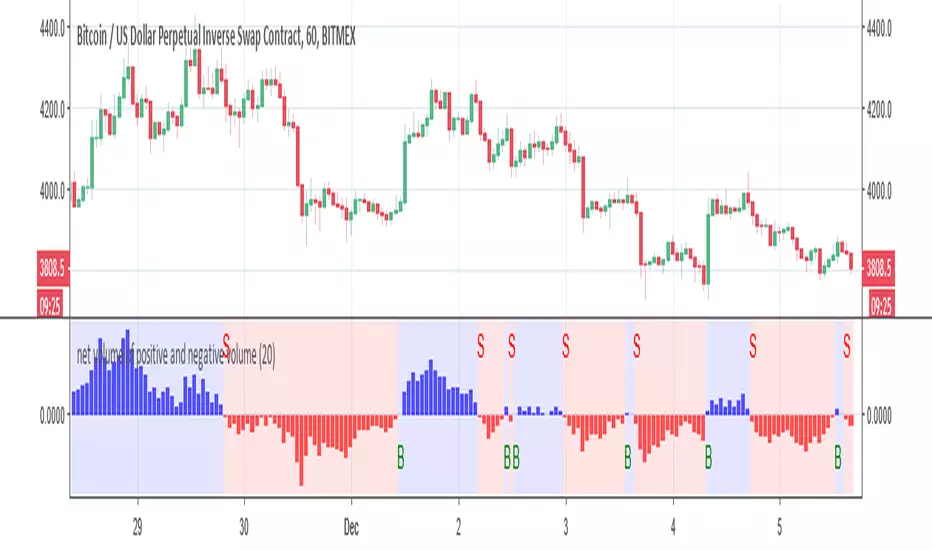
net volume of positive and negative volume buy and sell alertThis indicator try to give the mean number of bars in regarding to net volumes
This signal is produce by either cross up the 0 =buy or crossdown the 0 =sell
alerts inside
you can play with length to make optimization
[STRATEGY] MA Cross ElevenThis script is a crossing of eleven different MA, with alerts and SL and TP.
The simplest is what works best...
SMA --> Simple
EMA --> Exponential
WMA --> Weighted
VWMA --> Volume Weighted
SMMA --> Smoothed
DEMA --> Double Exponential
TEMA --> Triple Exponential
HMA --> Hull
TMA --> Triangular
SSMA --> SuperSmoother filter
ZEMA --> Zero Lag Exponential
Using "once per bar close" repaint is 0%, but if you like risk can choose "once per bar", better profit.
Thanks to JustUncleL and his amazing sripts.
Enjoy!
www.tradingview.com
"Note: When using non-standard (Renko, Kagi, Line Break, Point and Figure, Heikin Ashi, Spread Charts) types of chart as a basis for strategy, you need to realize that the result will be different. The orders will be executed at the prices of this chart (e.g.for Heikin Ashi it’ll take Heikin Ashi prices (the average ones) not the real market prices). Therefore we highly recommend you to use standard chart type for strategies."

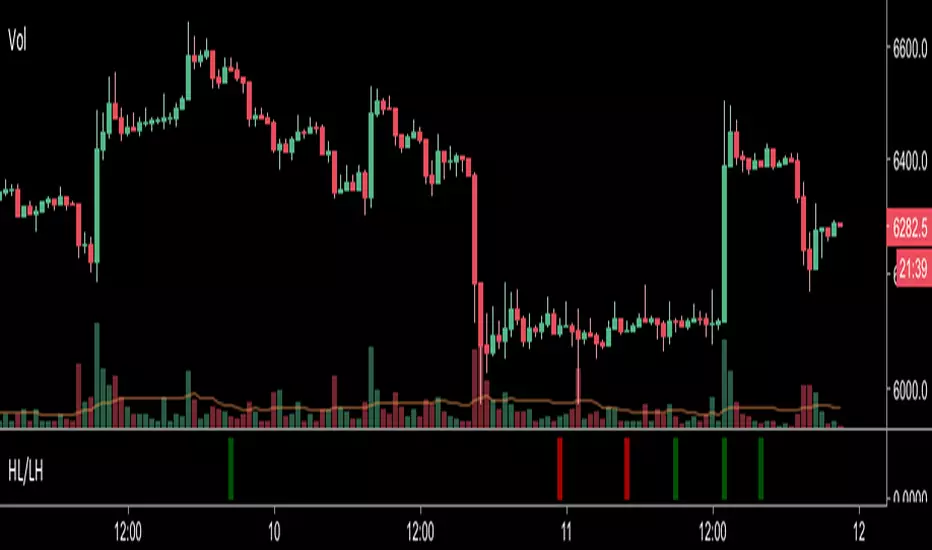
Higher Lows / Lower Highs AlertsSet an alert with this indicator for greater than 0.99 which will notify you of when a higher low or lower high is printed on the chart
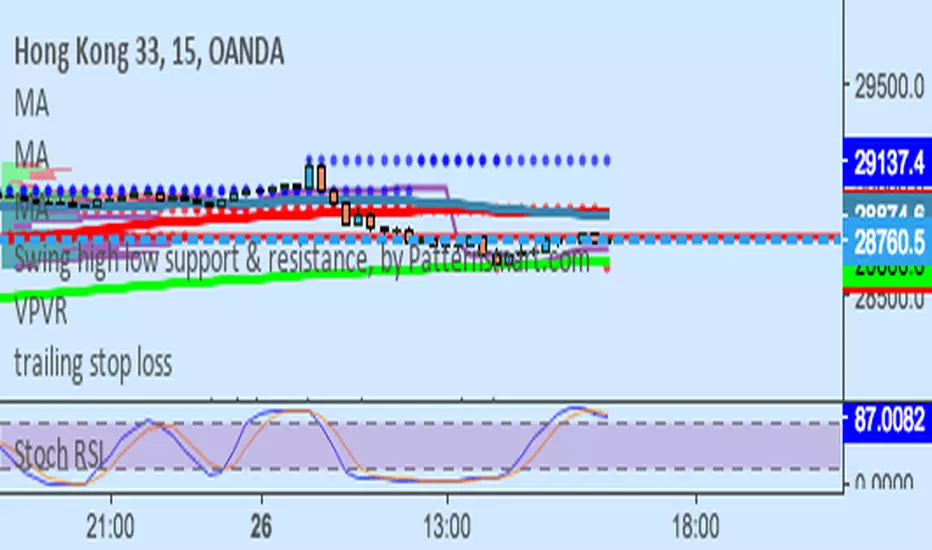
Stochastic RSI Alertscreate alert based on Stochastic RSI when k is greater than 80 or less than 20.

PIP COLLECTOR - REPAINT FIX w/ ALERTSThis fixes the repaint issue in LazyBear's Pip collector and adds alert capability. This strips away much of the original indicator, but it is a clear signal for longing and shorting, good to base off for live trading. As always, find a good entry and have an exit plan.

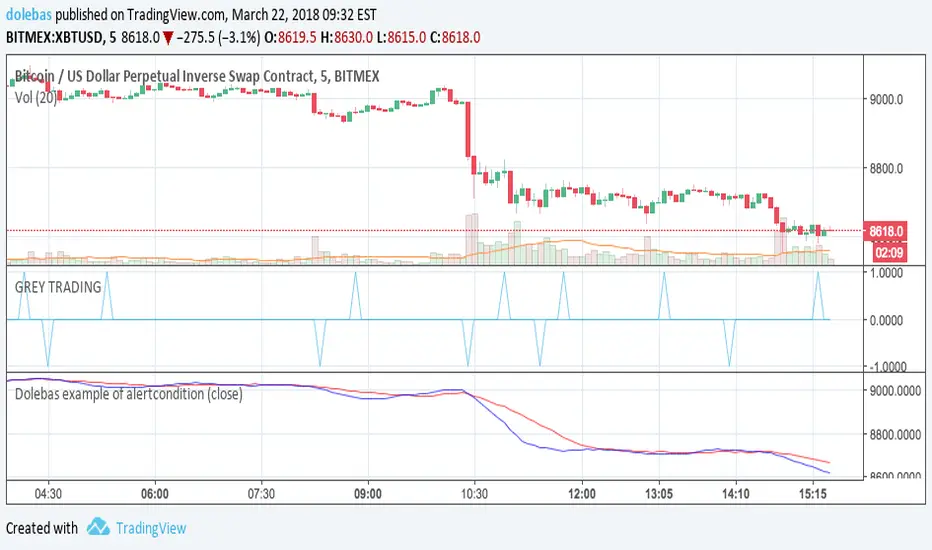
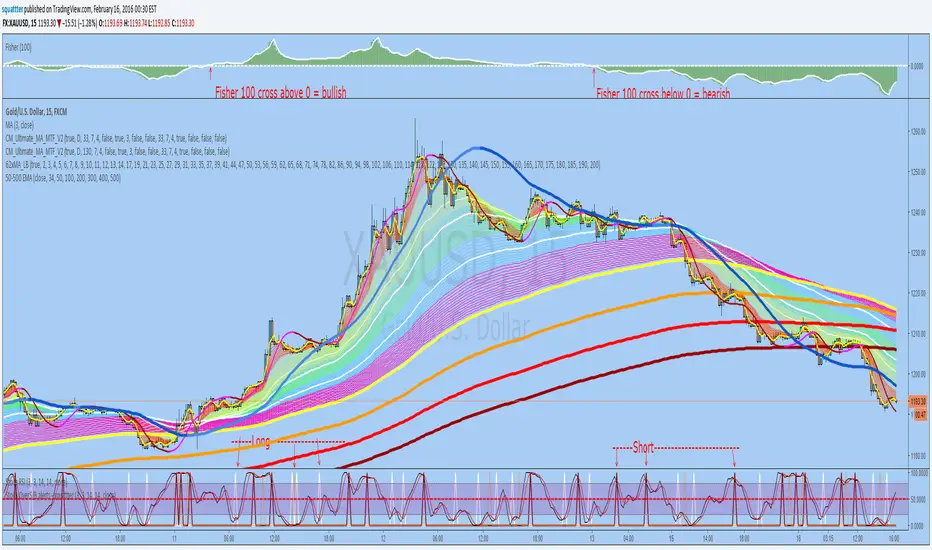
StochRSI overSold/Bought alerts - by squattterDepending on the new trend - Fisher 100 crossing 0;
Set an alert on each Long/Short "crossing down", 0.8 (or anything below 0.99), "on condition"
4All-Alerts Script for an easier setupThis is the alert script for
People have requested this so they can simply favorite and add it to a chart rather then cut and paste. That plus some of the code got converted to ticker data due to simply being in the description.
Happy Trading :)

SMA Dow-Flow MTF (SAXO Logical Alert)This script is an advanced MTF (multi-timeframe) monitor that combines the concepts of Dow Theory and SMA (Single Moving Average) to capture the moment when trends align across multiple timeframes. It is particularly focused on visualizing when lower timeframes synchronize with the direction of higher timeframes, without being distracted by short-term noise. 1. Trend Determination Mechanism (Core Logic): Rather than the usual simple determination of whether a price is above or below a moving average, this is based on updates of "low lows and highs." Pivot Detection: Points where the SMA moves in a "V" or "inverted V" shape are recorded as reversal candidates ($lastH$, $lastL$). Trend Reversal Conditions: Uptrend: When the price clearly breaks above the most recent SMA high ($lastH$). Downtrend: When the price clearly breaks below the most recent SMA low ($lastL$). 2. Indicator Features ① Sync Hierarchy: This script counts the degree to which the direction of each time period matches that of the higher time period, starting from the lower time period. The 5-minute time period forms a trend. The 15-minute time period follows the same direction as the 5-minute time period. The 1-hour time period follows the same direction as the 15-minute time period... (continues up to the daily time period). This ensures that an alert is sent out when the larger trend (daily or 4-hourly) swallows up the smaller trend (5-minute or 15-minute). ② Set Selection: You can switch between the "Yen Set (AUDJPY, EURJPY, etc.)" and the "Dollar Set (EURUSD, GBPUSD, etc.)." This allows you to grasp the strength or weakness of a specific currency (e.g., a weak yen or a strong dollar) at a glance.
This script's alert function does not simply sound when the trends match, but is designed to pinpoint the moment when the number of trend synchronizations increases (i.e., when momentum increases).
Below, we will explain in detail how it works and the meaning of the notifications.
1. Alert Conditions
An alert will only be triggered when all three of the following conditions are met.
Increase in Sync Count: For example, if only two time frames, the 5-minute and 15-minute ones, were aligned (Sync: 2), and the 1-hour one also aligns in the same direction (Sync: 3), the alert will be triggered.
Above the set minimum count (alert_min): The default setting is "3." In this case, a notification will be triggered the moment three, four, or five time frames are synchronized.
Selected Set Only: If the "Yen Set" is displayed, an alert will not be triggered even if a currency pair in the Dollar Set is synchronized.
2. How to Read the Alert Message
When you receive a notification, the following message will be displayed.
USDJPY: 4-Bar Synchronization (Upward)
USDJPY: A Currency Pair Gaining Momentum
4-Bar Synchronization: Indicates that the direction of the four timeframes (5-minute, 15-minute, 1-hour, and 4-hour) is consistent, starting with the lowest timeframe.
Upward/Downward: The direction of the synchronization.
このスクリプトは、「ダウ理論」と「移動平均線(SMA)」の考え方を組み合わせ、複数の時間足でトレンドが揃った瞬間を捉えるための高度なMTF(マルチタイムフレーム)モニターです。特に、短期的なノイズに惑わされず、上位足の方向に下位足が同期したタイミングを視覚化することに特化しています。1. トレンド判断の仕組み(コアロジック)通常の「移動平均線より上か下か」という単純な判定ではなく、「押し安値・戻り高値」の更新をベースにしています。ピボットの検知: SMAが「V字」または「逆V字」に動いた地点を、反転の候補($lastH$, $lastL$)として記録します。トレンド転換の条件:上昇トレンド: 価格が直近のSMA高値($lastH$)を明確に上抜けたとき。下落トレンド: 価格が直近のSMA安値($lastL$)を明確に下抜けたとき。2. インジケーターの特徴① 同期(Sync)の階層構造このスクリプトは、下位足から順に「どれだけ上位足と方向が一致しているか」をカウントします。5分足がトレンドを形成。15分足が5分足と同じ方向。1時間足が15分足と同じ方向……(日足まで続く)これにより、「大きな流れ(日足・4時間足)に、小さな流れ(5分・15分)が飲み込まれた瞬間」を逃さずアラート通知します。② セット選択機能「円セット(AUDJPY, EURJPYなど)」と「ドルセット(EURUSD, GBPUSDなど)」を切り替えて表示できます。これにより、特定の通貨の強弱(円安・ドル高など)を一目で把握できるのが強みです。
このスクリプトのアラート機能は、単に「トレンドが一致した」ときに鳴るのではなく、**「トレンドの同期数が増加した瞬間(=勢いが増した瞬間)」**をピンポイントで通知するように設計されています。
以下に、その仕組みと通知内容の意味を詳しく解説します。
1. アラートが発生する条件
アラートは、以下の3つの条件がすべて揃った時にのみ発信されます。
同期数(Sync Count)の増加: 例えば、それまで「5分足と15分足」の2つしか揃っていなかった(Sync: 2)のが、新しく「1時間足」も同じ方向に揃った(Sync: 3)という変化の瞬間に鳴ります。
設定した最小数以上 (alert_min): 初期設定では「3」になっています。この場合、3つ、4つ、または5つの時間足が同期した瞬間に通知が飛びます。
選択中のセットのみ: 「円セット」を表示している時は、ドルセットの通貨ペアが同期してもアラートは鳴りません。
2. アラートメッセージの読み方
通知が来ると、以下のようなメッセージが表示されます。
USDJPY: 4足同期 (上昇)
USDJPY: 勢いが出た通貨ペア
4足同期: 下位足から順に「5分・15分・1時間・4時間」の4つの時間足で方向が一致したことを示します。
上昇 / 下落: その同期している方向です。

teril Second Candle Cross Alert (Intrabar)teril Second Candle Cross Alert
teril Second Candle Cross Alert teril Second Candle Cross Alert teril Second Candle Cross Alert
teril Second Candle Cross Alert

Teril Second Candle Cross Alert (Intrabar)Teril Second Candle Cross Alert
Teril Second Candle Cross Alert
Teril Second Candle Cross Alert
Teril Second Candle Cross Alert

teril final Second Candle Cross Alert (Intrabar) before closeteril final Second Candle Cross Alert (Intrabar) before close
teril final Second Candle Cross Alert (Intrabar) before close
teril final Second Candle Cross Alert (Intrabar) before close
teril final Second Candle Cross Alert (Intrabar) before close
