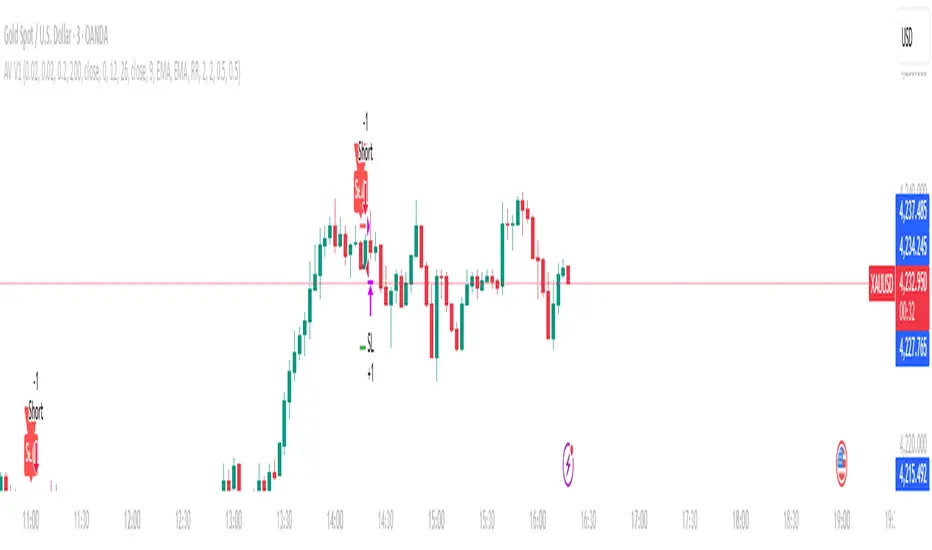
AV V1⚡ AV V1 — Advanced Algo Vortex Signal System
Description:
AV V1 (Algo Vortex Version 1) is a next-generation auto signal system that blends the power of trend momentum, volatility flow, and vortex logic into one clean visual tool.
Designed for traders who want clarity and confidence, AV V1 helps identify early trend shifts, perfect entry zones, and potential reversals — without cluttering your chart.
🚀 Key Highlights
🔹 Auto Buy & Sell Signals – Generated using smart vortex and volatility filters.
🔹 Trend Confirmation Line – Smooth directional bias for better trade timing.
🔹 Dynamic Zone Coloring – Instantly shows bullish/bearish momentum strength.
🔹 Works Across Markets – Stocks, Crypto, Forex, Indices, and Commodities.
🔹 Non-Repainting Logic – Signals are confirmed after candle close for reliability.
🧠 Core Concept
AV V1 tracks vortex energy flow between buyers and sellers.
When bullish energy dominates → Buy Signal (Green)
When bearish energy dominates → Sell Signal (Red)
It automatically adapts to market volatility, helping you stay in strong trends and avoid false signals in choppy zones.
⚠️ Disclaimer
This indicator is for educational and research purposes only.
It does not guarantee profits — always backtest before live trading and use proper risk management.
Search in scripts for "algo"

dhruv private 91400//@version=5
//
VERSION = '7.9-X'// 2024.3.20
strategy(
'LE VAN DO® - Swing Signals & Overlays Private™ 7.9-X',
shorttitle = 'LE VAN DO® - Swing Signals & Overlays Private™ 7.9-X' + VERSION,
overlay = true,
explicit_plot_zorder = true,
pyramiding = 0,
default_qty_type = strategy.percent_of_equity,
default_qty_value = 50,
calc_on_every_tick = false,
process_orders_on_close = true,
max_bars_back = 500,
initial_capital = 5000,
commission_type = strategy.commission.percent,
commission_value = 0.02,
max_lines_count = 500
)
//Truncate Function
truncate(number, decimals) =>
factor = math.pow(10, decimals)
int(number * factor) / factor
//
// === INPUTS ===
TPSType = input.string('Trailing', 'What TPS should be taken : ', options = )
setupType = input.string('Open/Close', title='What Trading Setup should be taken : ', options= )
scolor = input(true, title='Show coloured Bars to indicate Trend?')
almaRibbon = input(false, title='Enable Ribbon?')
//tradeType = input.string('BOTH', title='What trades should be taken : ', options= )
// === /INPUTS ===
// Display the probabilities in a table
//text01_ = str.tostring(timeframe.multiplier * intRes, '####')
//t = timenow + math.round(ta.change(time) * 25)
//var label lab01 = na
//label.delete(lab01)
//lab01 := label.new(t, close, text=text01_, style=label.style_label_left, yloc=yloc.price, xloc=xloc.bar_time, textalign=text.align_left, textcolor=color.white)
// Constants colours that include fully non-transparent option.
green100 = #008000FF
lime100 = #66bb6a
red100 = #f7525f
blue100 = #0000FFFF
aqua100 = #00FFFFFF
darkred100 = #8B0000FF
gray100 = #808080FF
/////////////////////////////////////////////
// Create non-repainting security function
rp_security(_symbol, _res, _src) =>
request.security(_symbol, _res, _src )
//
f_tfInMinutes() =>
_tfInMinutes = timeframe.period == '1' ? '3' : timeframe.period == '3' ? '5' : timeframe.period == '5' ? '15' : timeframe.period == '15' ? '30' : timeframe.period == '30' ? '60' : timeframe.period == '60' ? '240' : 'D'
_tfInMinutes
my_time1 = f_tfInMinutes()
tfmult = 18 //input.int(18, "Input Timeframe Multiplier")
f_resInMinutes() =>
_resInMinutes = timeframe.multiplier * (
timeframe.isseconds ? 1. / 60. :
timeframe.isminutes ? 1. :
timeframe.isdaily ? 1440. :
timeframe.isweekly ? 10080. :
timeframe.ismonthly ? 43800. : na)
my_time = str.tostring(f_resInMinutes()*tfmult)
useSource = close //input.string('Close', 'What Source to be used?', options = )
enableFilter = input(true, "Enable Backtesting Range Filtering")
fromDate = input.time(timestamp("01 Jan 2023 00:00 +0300"), "Start Date")
toDate = input.time(timestamp("31 Dec 2099 00:00 +0300"), "End Date")
tradeDateIsAllowed = not enableFilter or (time >= fromDate and time <= toDate)
filter1 = 'Filter with Atr'
filter2 = 'Filter with RSI'
filter3 = 'Atr or RSI'
filter4 = 'Atr and RSI'
filter5 = 'No Filtering'
filter6 = 'Entry Only in sideways market(By ATR or RSI)'
filter7 = 'Entry Only in sideways market(By ATR and RSI)'
typefilter = input.string(filter5, title='Sideways Filtering Input', options= , group='Strategy Options')
RSI = truncate(ta.rsi(close, input.int(7, group='RSI Filterring')), 2)
toplimitrsi = input.int(45, title='TOP Limit', group='RSI Filterring')
botlimitrsi = input.int(10, title='BOT Limit', group='RSI Filterring')
//ST = input.bool(true, title='Show Supertrend?', group='Supertrend Indicator')
//period = input.int(1440, group='Supertrend Indicator')
//mult = input.float(2.612, group='Supertrend Indicator')
atrfiltLen = 5 //input.int(5, minval=1, title='atr Length', group='Sideways Filtering Input')
atrMaType = 'EMA' //input.string('EMA', options= , group='Sideways Filtering Input', title='atr Moving Average Type')
atrMaLen = 5 //input.int(5, minval=1, title='atr MA Length', group='Sideways Filtering Input')
//filtering
atra = request.security(syminfo.tickerid, '', ta.atr(atrfiltLen))
atrMa = atrMaType == 'EM' ? ta.ema(atra, atrMaLen) : ta.sma(atra, atrMaLen)
updm = ta.change(high)
downdm = -ta.change(low)
plusdm = na(updm) ? na : updm > downdm and updm > 0 ? updm : 0
minusdm = na(downdm) ? na : downdm > updm and downdm > 0 ? downdm : 0
cndSidwayss1 = atra >= atrMa
cndSidwayss2 = RSI > toplimitrsi or RSI < botlimitrsi
cndSidways = cndSidwayss1 or cndSidwayss2
cndSidways1 = cndSidwayss1 and cndSidwayss2
Sidwayss1 = atra <= atrMa
Sidwayss2 = RSI < toplimitrsi and RSI > botlimitrsi
Sidways = Sidwayss1 or Sidwayss2
Sidways1 = Sidwayss1 and Sidwayss2
trendType = typefilter == filter1 ? cndSidwayss1 : typefilter == filter2 ? cndSidwayss2 : typefilter == filter3 ? cndSidways : typefilter == filter4 ? cndSidways1 : typefilter == filter5 ? RSI > 0 : typefilter == filter6 ? Sidways : typefilter == filter7 ? Sidways1 : na
// === /INPUTS ===
tf = my_time //input('15')
r = ticker.heikinashi(syminfo.tickerid)
openSeriesAlt = request.security(r, tf, open, lookahead=barmerge.lookahead_on)
closeSeriesAlt = request.security(r, tf, close, lookahead=barmerge.lookahead_on)
//openP = plot(almaRibbon ? openSeriesAlt : na, color=color.new(color.lime, 0), linewidth=3)
//closeP = plot(almaRibbon ? closeSeriesAlt : na, color=color.new(color.red, 0), linewidth=3)
BUYOC = ta.crossover(closeSeriesAlt, openSeriesAlt) and setupType == "Open/Close" and trendType
SELLOC = ta.crossunder(closeSeriesAlt, openSeriesAlt) and setupType == "Open/Close" and trendType
//strategy.entry('sell', direction=strategy.short, qty=trade_size, comment='sell', when=sel_entry)
//strategy.entry('buy', direction=strategy.long, qty=trade_size, comment='buy', when=buy_entry)
//trendColour = closeSeriesAlt > openSeriesAlt ? color.green : color.red
//bcolour = closeSeriesAlt > openSeriesAlt ? lime100 : red100
//barcolor(scolor ? bcolour : na, title='Bar Colours')
//closeP = plot(almaRibbon ? closeSeriesAlt : na, title='Close Series', color=color.new(trendColour, 20), linewidth=2, style=plot.style_line)
//openP = plot(almaRibbon ? openSeriesAlt : na, title='Open Series', color=color.new(trendColour, 20), linewidth=2, style=plot.style_line)
//fill(closeP, openP, color=color.new(trendColour, 80))
//
//rt = input(true, title="ATR Based REnko is the Default, UnCheck to use Traditional ATR?")
atrLen = 3 //input.int(3, title="RENKO_ATR", group = "Renko Settings")
isATR = true //input.bool(true, title="RENKO_USE_RENKO_ATR", group = "Renko Settings")
tradLen1 = 1000 //input.int(1000, title="RENKO_TRADITIONAL", group = "Renko Settings")
//Code to be implemented in V2
//mul = input(1, "Number Of minticks")
//value = mul * syminfo.mintick
tradLen = tradLen1 * 1
param = isATR ? ticker.renko(syminfo.tickerid, "ATR", atrLen) : ticker.renko(syminfo.tickerid, "Traditional", tradLen)
renko_close = request.security(param, my_time, close, lookahead=barmerge.lookahead_on)
renko_open = request.security(param, my_time, open, lookahead=barmerge.lookahead_on)
//============================================
//Sniper------------------------------------------------------------------------------------------------------------------------------------- // Signal 2
//============================================
//============================================
//EMA_CROSS-------------------------------------------------------------------------------------------------------------------------------- // Signal 4
//============================================
EMA1_length=input.int(2, "EMA1_length", group = "Renko Settings")
EMA2_length=input.int(10, "EMA2_length", group = "Renko Settings")
a = ta.ema(renko_close, EMA1_length)
b = ta.ema(renko_close, EMA2_length)
//BUY = ta.cross(a, b) and a > b and renko_open < renko_close
//SELL = ta.cross(a, b) and a < b and renko_close < renko_open
///////////////////////////////
// Determine long and short conditions
BUYR = ta.crossover(a, b) and setupType == "Renko" and trendType
SELLR = ta.crossunder(a, b) and setupType == "Renko" and trendType
sel_color = setupType == "Open/Close" ? closeSeriesAlt < openSeriesAlt : setupType == "Renko" ? renko_close < renko_open : na
buy_color = setupType == "Open/Close" ? closeSeriesAlt > openSeriesAlt : setupType == "Renko" ? renko_close > renko_open : na
sel_entry = setupType == "Open/Close" ? SELLOC : setupType == "Renko" ? SELLR : na
buy_entry = setupType == "Open/Close" ? BUYOC : setupType == "Renko" ? BUYR : na
trendColour = buy_color ? color.green : color.red
bcolour = buy_color ? lime100 : red100
barcolor(scolor ? bcolour : na, title='Bar Colours')
p11=plot(almaRibbon and setupType == "Open/Close" ? closeSeriesAlt : almaRibbon and setupType == "Renko" ? renko_close : na, style=plot.style_circles, linewidth=1, color=color.new(trendColour, 80), title="RENKO_1")
p22=plot(almaRibbon and setupType == "Open/Close" ? openSeriesAlt : almaRibbon and setupType == "Renko" ? renko_open : na, style=plot.style_circles, linewidth=1, color=color.new(trendColour, 80), title="RENKO_2")
fill(p11, p22, color=color.new(trendColour, 50), title="RENKO_fill")
//
lxTrigger = false
sxTrigger = false
leTrigger = buy_entry
seTrigger = sel_entry
// === /ALERT conditions.
buy = leTrigger //ta.crossover(closeSeriesAlt, openSeriesAlt)
sell = seTrigger //ta.crossunder(closeSeriesAlt, openSeriesAlt)
varip wasLong = false
varip wasShort = false
if barstate.isconfirmed
wasLong := false
else
if buy
wasLong := true
if barstate.isconfirmed
wasShort := false
else
if sell
wasShort := true
plotshape(wasLong, color = color.yellow)
plotshape(wasShort, color = color.yellow)
//plotshape(almaRibbon ? buy : na, title = "Buy", text = 'Buy', style = shape.labelup, location = location.belowbar, color= #39ff14, textcolor = #FFFFFF, size = size.tiny)
//plotshape(almaRibbon ? sell : na, title = "Exit", text = 'Exit', style = shape.labeldown, location = location.abovebar, color= #ff1100, textcolor = #FFFFFF, size = size.tiny)
// === STRATEGY ===
i_alert_txt_entry_long = "Short Exit" //input.text_area(defval = "Short Exit", title = "Long Entry Message", group = "Alerts")
i_alert_txt_exit_long = "Long Exit" //input.text_area(defval = "Long Exit", title = "Long Exit Message", group = "Alerts")
i_alert_txt_entry_short = "Go Short" //input.text_area(defval = "Go Short", title = "Short Entry Message", group = "Alerts")
i_alert_txt_exit_short = "Go Long" //input.text_area(defval = "Go Long", title = "Short Exit Message", group = "Alerts")
// Entries and Exits with TP/SL
//tradeType
if buy and TPSType == "Trailing" and tradeDateIsAllowed
strategy.close("Short" , alert_message = i_alert_txt_exit_short)
strategy.entry("Long" , strategy.long , alert_message = i_alert_txt_entry_long)
if sell and TPSType == "Trailing" and tradeDateIsAllowed
strategy.close("Long" , alert_message = i_alert_txt_exit_long)
strategy.entry("Short" , strategy.short, alert_message = i_alert_txt_entry_short)
//tradeType
if buy and TPSType == "Options" and tradeDateIsAllowed
// strategy.close("Short" , alert_message = i_alert_txt_exit_short)
strategy.entry("Long" , strategy.long , alert_message = i_alert_txt_entry_long)
if sell and TPSType == "Options" and tradeDateIsAllowed
strategy.close("Long" , alert_message = i_alert_txt_exit_long)
// strategy.entry("Short" , strategy.short, alert_message = i_alert_txt_entry_short)
G_RISK = '■ ' + 'Risk Management'
//#region ———— <↓↓↓ G_RISK ↓↓↓> {
//ATR SL Settings
atrLength = 20 //input.int(20, minval=1, title='ATR Length')
profitFactor = 2.5 //input(2.5, title='Take Profit Factor')
stopFactor = 1 //input(1.0, title='Stop Loss Factor')
// Calculate ATR
tpatrValue = ta.atr(atrLength)
// Calculate take profit and stop loss levels for buy signals
takeProfit1_buy = 1 * profitFactor * tpatrValue //close + profitFactor * atrValue
takeProfit2_buy = 2 * profitFactor * tpatrValue //close + 2 * profitFactor * atrValue
takeProfit3_buy = 3 * profitFactor * tpatrValue //close + 3 * profitFactor * atrValue
stopLoss_buy = close - takeProfit1_buy //stopFactor * tpatrValue
// Calculate take profit and stop loss levels for sell signals
takeProfit1_sell = 1 * profitFactor * tpatrValue //close - profitFactor * atrValue
takeProfit2_sell = 2 * profitFactor * tpatrValue //close - 2 * profitFactor * atrValue
takeProfit3_sell = 3 * profitFactor * tpatrValue //close - 3 * profitFactor * atrValue
stopLoss_sell = close + takeProfit1_sell //stopFactor * tpatrValue
// ———————————
//Tooltip
T_LVL = '(%) Exit Level'
T_QTY = '(%) Adjust trade exit volume'
T_MSG = 'Paste JSON message for your bot'
//Webhook Message
O_LEMSG = 'Long Entry'
O_LXMSGSL = 'Long SL'
O_LXMSGTP1 = 'Long TP1'
O_LXMSGTP2 = 'Long TP2'
O_LXMSGTP3 = 'Long TP3'
O_LXMSG = 'Long Exit'
O_SEMSG = 'Short Entry'
O_SXMSGSL = 'Short SL'
O_SXMSGA = 'Short TP1'
O_SXMSGB = 'Short TP2'
O_SXMSGC = 'Short TP3'
O_SXMSGX = 'Short Exit'
// on whole pips) for forex currency pairs.
pip_size = syminfo.mintick * (syminfo.type == "forex" ? 10 : 1)
// On the last historical bar, show the instrument's pip size
//if barstate.islastconfirmedhistory
// label.new(x=bar_index + 2, y=close, style=label.style_label_left,
// color=color.navy, textcolor=color.white, size=size.large,
// text=syminfo.ticker + "'s pip size is:\n" +
// str.tostring(pip_size))
// ——————————— | | | Line length guide |
i_lxLvlTP1 = leTrigger ? takeProfit1_buy : seTrigger ? takeProfit1_sell : na //input.float (1, 'Level TP1' , group = G_RISK, tooltip = T_LVL)
i_lxQtyTP1 = input.float (50, 'Qty TP1' , group = G_RISK, tooltip = T_QTY)
i_lxLvlTP2 = leTrigger ? takeProfit2_buy : seTrigger ? takeProfit2_sell : na //input.float (1.5, 'Level TP2' , group = G_RISK, tooltip = T_LVL)
i_lxQtyTP2 = input.float (30, 'Qty TP2' , group = G_RISK, tooltip = T_QTY)
i_lxLvlTP3 = leTrigger ? takeProfit3_buy : seTrigger ? takeProfit3_sell : na //input.float (2, 'Level TP3' , group = G_RISK, tooltip = T_LVL)
i_lxQtyTP3 = input.float (20, 'Qty TP3' , group = G_RISK, tooltip = T_QTY)
i_lxLvlSL = leTrigger ? takeProfit1_buy : seTrigger ? takeProfit1_sell : na //input.float (0.5, 'Stop Loss' , group = G_RISK, tooltip = T_LVL)
i_sxLvlTP1 = i_lxLvlTP1
i_sxQtyTP1 = i_lxQtyTP1
i_sxLvlTP2 = i_lxLvlTP2
i_sxQtyTP2 = i_lxQtyTP2
i_sxLvlTP3 = i_lxLvlTP3
i_sxQtyTP3 = i_lxQtyTP3
i_sxLvlSL = i_lxLvlSL
G_MSG = '■ ' + 'Webhook Message'
i_leMsg = O_LEMSG //input.string (O_LEMSG ,'Long Entry' , group = G_MSG, tooltip = T_MSG)
i_lxMsgSL = O_LXMSGSL //input.string (O_LXMSGSL ,'Long SL' , group = G_MSG, tooltip = T_MSG)
i_lxMsgTP1 = O_LXMSGTP1 //input.string (O_LXMSGTP1,'Long TP1' , group = G_MSG, tooltip = T_MSG)
i_lxMsgTP2 = O_LXMSGTP2 //input.string (O_LXMSGTP2,'Long TP2' , group = G_MSG, tooltip = T_MSG)
i_lxMsgTP3 = O_LXMSGTP3 //input.string (O_LXMSGTP3,'Long TP3' , group = G_MSG, tooltip = T_MSG)
i_lxMsg = O_LXMSG //input.string (O_LXMSG ,'Long Exit' , group = G_MSG, tooltip = T_MSG)
i_seMsg = O_SEMSG //input.string (O_SEMSG ,'Short Entry' , group = G_MSG, tooltip = T_MSG)
i_sxMsgSL = O_SXMSGSL //input.string (O_SXMSGSL ,'Short SL' , group = G_MSG, tooltip = T_MSG)
i_sxMsgTP1 = O_SXMSGA //input.string (O_SXMSGA ,'Short TP1' , group = G_MSG, tooltip = T_MSG)
i_sxMsgTP2 = O_SXMSGB //input.string (O_SXMSGB ,'Short TP2' , group = G_MSG, tooltip = T_MSG)
i_sxMsgTP3 = O_SXMSGC //input.string (O_SXMSGC ,'Short TP3' , group = G_MSG, tooltip = T_MSG)
i_sxMsg = O_SXMSGX //input.string (O_SXMSGX ,'Short Exit' , group = G_MSG, tooltip = T_MSG)
i_src = close
G_DISPLAY = 'Display'
//
i_alertOn = true //input.bool (true, 'Alert Labels On/Off' , group = G_DISPLAY)
i_barColOn = true //input.bool (true, 'Bar Color On/Off' , group = G_DISPLAY)
// ———————————
// @function Calculate the Take Profit line, and the crossover or crossunder
f_tp(_condition, _conditionValue, _leTrigger, _seTrigger, _src, _lxLvlTP, _sxLvlTP)=>
var float _tpLine = 0.0
_topLvl = _src + _lxLvlTP //TPSType == "Fixed %" ? _src + (_src * (_lxLvlTP / 100)) : _src + _lxLvlTP
_botLvl = _src - _lxLvlTP //TPSType == "Fixed %" ? _src - (_src * (_sxLvlTP / 100)) : _src - _sxLvlTP
_tpLine := _condition != _conditionValue and _leTrigger ? _topLvl :
_condition != -_conditionValue and _seTrigger ? _botLvl :
nz(_tpLine )
// @function Similar to "ta.crossover" or "ta.crossunder"
f_cross(_scr1, _scr2, _over)=>
_cross = _over ? _scr1 > _scr2 and _scr1 < _scr2 :
_scr1 < _scr2 and _scr1 > _scr2
// ———————————
//
var float condition = 0.0
var float slLine = 0.0
var float entryLine = 0.0
//
entryLine := leTrigger and condition <= 0.0 ? close :
seTrigger and condition >= 0.0 ? close : nz(entryLine )
//
slTopLvl = TPSType == "Fixed %" ? i_src + (i_src * (i_lxLvlSL / 100)) : i_src + i_lxLvlSL
slBotLvl = TPSType == "Fixed %" ? i_src - (i_src * (i_sxLvlSL / 100)) : i_src - i_lxLvlSL
slLine := condition <= 0.0 and leTrigger ? slBotLvl :
condition >= 0.0 and seTrigger ? slTopLvl : nz(slLine )
slLong = f_cross(low, slLine, false)
slShort = f_cross(high, slLine, true )
//
= f_tp(condition, 1.2,leTrigger, seTrigger, i_src, i_lxLvlTP3, i_sxLvlTP3)
= f_tp(condition, 1.1,leTrigger, seTrigger, i_src, i_lxLvlTP2, i_sxLvlTP2)
= f_tp(condition, 1.0,leTrigger, seTrigger, i_src, i_lxLvlTP1, i_sxLvlTP1)
tp3Long = f_cross(high, tp3Line, true )
tp3Short = f_cross(low, tp3Line, false)
tp2Long = f_cross(high, tp2Line, true )
tp2Short = f_cross(low, tp2Line, false)
tp1Long = f_cross(high, tp1Line, true )
tp1Short = f_cross(low, tp1Line, false)
switch
leTrigger and condition <= 0.0 => condition := 1.0
seTrigger and condition >= 0.0 => condition := -1.0
tp3Long and condition == 1.2 => condition := 1.3
tp3Short and condition == -1.2 => condition := -1.3
tp2Long and condition == 1.1 => condition := 1.2
tp2Short and condition == -1.1 => condition := -1.2
tp1Long and condition == 1.0 => condition := 1.1
tp1Short and condition == -1.0 => condition := -1.1
slLong and condition >= 1.0 => condition := 0.0
slShort and condition <= -1.0 => condition := 0.0
lxTrigger and condition >= 1.0 => condition := 0.0
sxTrigger and condition <= -1.0 => condition := 0.0
longE = leTrigger and condition <= 0.0 and condition == 1.0
shortE = seTrigger and condition >= 0.0 and condition == -1.0
longX = lxTrigger and condition >= 1.0 and condition == 0.0
shortX = sxTrigger and condition <= -1.0 and condition == 0.0
longSL = slLong and condition >= 1.0 and condition == 0.0
shortSL = slShort and condition <= -1.0 and condition == 0.0
longTP3 = tp3Long and condition == 1.2 and condition == 1.3
shortTP3 = tp3Short and condition == -1.2 and condition == -1.3
longTP2 = tp2Long and condition == 1.1 and condition == 1.2
shortTP2 = tp2Short and condition == -1.1 and condition == -1.2
longTP1 = tp1Long and condition == 1.0 and condition == 1.1
shortTP1 = tp1Short and condition == -1.0 and condition == -1.1
// ——————————— {
//
if strategy.position_size <= 0 and longE and TPSType == "ATR" and tradeDateIsAllowed
strategy.entry( 'Long', strategy.long, alert_message = i_leMsg, comment = 'LE')
if strategy.position_size > 0 and condition == 1.0 and TPSType == "ATR" and tradeDateIsAllowed
strategy.exit( id = 'LXTP1', from_entry = 'Long', qty_percent = i_lxQtyTP1, limit = tp1Line, stop = slLine, comment_profit = 'LXTP1', comment_loss = 'SL', alert_profit = i_lxMsgTP1, alert_loss = i_lxMsgSL)
if strategy.position_size > 0 and condition == 1.1 and TPSType == "ATR" and tradeDateIsAllowed
strategy.exit( id = 'LXTP2', from_entry = 'Long', qty_percent = i_lxQtyTP2, limit = tp2Line, stop = slLine, comment_profit = 'LXTP2', comment_loss = 'SL', alert_profit = i_lxMsgTP2, alert_loss = i_lxMsgSL)
if strategy.position_size > 0 and condition == 1.2 and TPSType == "ATR" and tradeDateIsAllowed
strategy.exit( id = 'LXTP3', from_entry = 'Long', qty_percent = i_lxQtyTP3, limit = tp3Line, stop = slLine, comment_profit = 'LXTP3', comment_loss = 'SL', alert_profit = i_lxMsgTP3, alert_loss = i_lxMsgSL)
if longX and tradeDateIsAllowed
strategy.close( 'Long', alert_message = i_lxMsg, comment = 'LX')
//
if strategy.position_size >= 0 and shortE and TPSType == "ATR" and tradeDateIsAllowed
strategy.entry( 'Short', strategy.short, alert_message = i_leMsg, comment = 'SE')
if strategy.position_size < 0 and condition == -1.0 and TPSType == "ATR" and tradeDateIsAllowed
strategy.exit( id = 'SXTP1', from_entry = 'Short', qty_percent = i_sxQtyTP1, limit = tp1Line, stop = slLine, comment_profit = 'SXTP1', comment_loss = 'SL', alert_profit = i_sxMsgTP1, alert_loss = i_sxMsgSL)
if strategy.position_size < 0 and condition == -1.1 and TPSType == "ATR" and tradeDateIsAllowed
strategy.exit( id = 'SXTP2', from_entry = 'Short', qty_percent = i_sxQtyTP2, limit = tp2Line, stop = slLine, comment_profit = 'SXTP2', comment_loss = 'SL', alert_profit = i_sxMsgTP2, alert_loss = i_sxMsgSL)
if strategy.position_size < 0 and condition == -1.2 and TPSType == "ATR" and tradeDateIsAllowed
strategy.exit( id = 'SXTP3', from_entry = 'Short', qty_percent = i_sxQtyTP3, limit = tp3Line, stop = slLine, comment_profit = 'SXTP3', comment_loss = 'SL', alert_profit = i_sxMsgTP3, alert_loss = i_sxMsgSL)
if shortX and tradeDateIsAllowed
strategy.close( 'Short', alert_message = i_sxMsg, comment = 'SX')
// ———————————
c_tp = leTrigger or seTrigger ? na :
condition == 0.0 ? na : color.green
c_entry = leTrigger or seTrigger ? na :
condition == 0.0 ? na : color.blue
c_sl = leTrigger or seTrigger ? na :
condition == 0.0 ? na : color.red
p_tp1Line = plot ( condition == 1.0 or condition == -1.0 ? tp1Line : na, title = "TP Line 1", color = c_tp, linewidth = 1, style = plot.style_linebr)
p_tp2Line = plot ( condition == 1.0 or condition == -1.0 or condition == 1.1 or condition == -1.1 ? tp2Line : na, title = "TP Line 2", color = c_tp, linewidth = 1, style = plot.style_linebr)
p_tp3Line = plot ( condition == 1.0 or condition == -1.0 or condition == 1.1 or condition == -1.1 or condition == 1.2 or condition == -1.2 ? tp3Line : na, title = "TP Line 3", color = c_tp, linewidth = 1, style = plot.style_linebr)
p_entryLine = plot ( condition >= 1.0 or condition <= -1.0 ? entryLine : na, title = "Entry Line", color = c_entry, linewidth = 1, style = plot.style_linebr)
p_slLine = plot ( condition == 1.0 or condition == -1.0 or condition == 1.1 or condition == -1.1 or condition == 1.2 or condition == -1.2 ? slLine : na, title = "SL Line", color = c_sl, linewidth = 1, style = plot.style_linebr)
//fill( p_tp3Line, p_entryLine, color = leTrigger or seTrigger ? na :color.new(color.green, 90))
fill( p_entryLine, p_slLine, color = leTrigger or seTrigger ? na :color.new(color.red, 90))
//
plotshape( i_alertOn and longE, title = 'Long', text = 'Long', textcolor = color.white, color = color.green, style = shape.labelup, size = size.tiny, location = location.belowbar)
plotshape( i_alertOn and shortE, title = 'Short', text = 'Short', textcolor = color.white, color = color.red, style = shape.labeldown, size = size.tiny, location = location.abovebar)
plotshape( i_alertOn and (longX or shortX) ? close : na, title = 'Close', text = 'Close', textcolor = color.white, color = color.gray, style = shape.labelup, size = size.tiny, location = location.absolute)
l_tp = i_alertOn and (longTP1 or shortTP1) ? close : na
plotshape( l_tp, title = "TP1 Cross", text = "TP1", textcolor = color.white, color = #ec407a, style = shape.labelup, size = size.tiny, location = location.absolute)
plotshape( i_alertOn and (longTP2 or shortTP2) ? close : na, title = "TP2 Cross", text = "TP2", textcolor = color.white, color = #ec407a, style = shape.labelup, size = size.tiny, location = location.absolute)
plotshape( i_alertOn and (longTP3 or shortTP3) ? close : na, title = "TP3 Cross", text = "TP3", textcolor = color.white, color = #ec407a, style = shape.labelup, size = size.tiny, location = location.absolute)
plotshape( i_alertOn and (longSL or shortSL) ? close : na, title = "SL Cross", text = "SL", textcolor = color.white, color = color.maroon, style = shape.labelup, size = size.tiny, location = location.absolute)
//
plot( na, title = "─── ───", editable = false, display = display.data_window)
plot( condition, title = "condition", editable = false, display = display.data_window)
plot( strategy.position_size * 100, title = ".position_size", editable = false, display = display.data_window)
//#endregion }
// ——————————— <↑↑↑ G_RISK ↑↑↑>
//#region ———— <↓↓↓ G_SCRIPT02 ↓↓↓> {
// @function Queues a new element in an array and de-queues its first element.
f_qDq(_array, _val) =>
array.push(_array, _val)
_return = array.shift(_array)
_return
var line a_slLine = array.new_line(1)
var line a_entryLine = array.new_line(1)
var line a_tp3Line = array.new_line(1)
var line a_tp2Line = array.new_line(1)
var line a_tp1Line = array.new_line(1)
var label a_slLabel = array.new_label(1)
var label a_tp3label = array.new_label(1)
var label a_tp2label = array.new_label(1)
var label a_tp1label = array.new_label(1)
var label a_entryLabel = array.new_label(1)
newEntry = longE or shortE
entryIndex = 1
entryIndex := newEntry ? bar_index : nz(entryIndex )
lasTrade = bar_index >= entryIndex
l_right = 10
if TPSType == "ATR"
line.delete( f_qDq(a_slLine, line.new( entryIndex, slLine, last_bar_index + l_right, slLine, style = line.style_solid, color = c_sl)))
if TPSType == "ATR"
line.delete( f_qDq(a_entryLine, line.new( entryIndex, entryLine, last_bar_index + l_right, entryLine, style = line.style_solid, color = color.blue)))
if TPSType == "ATR"
line.delete( f_qDq(a_tp3Line, line.new( entryIndex, tp3Line, last_bar_index + l_right, tp3Line, style = line.style_solid, color = c_tp)))
if TPSType == "ATR"
line.delete( f_qDq(a_tp2Line, line.new( entryIndex, tp2Line, last_bar_index + l_right, tp2Line, style = line.style_solid, color = c_tp)))
if TPSType == "ATR"
line.delete( f_qDq(a_tp1Line, line.new( entryIndex, tp1Line, last_bar_index + l_right, tp1Line, style = line.style_solid, color = c_tp)))
if TPSType == "ATR"
label.delete( f_qDq(a_slLabel, label.new( last_bar_index + l_right, slLine, 'SL: ' + str.tostring(slLine, '##.###'), style = label.style_label_left, textcolor = color.white, color = c_sl)))
if TPSType == "ATR"
label.delete( f_qDq(a_entryLabel, label.new( last_bar_index + l_right, entryLine, 'Entry: ' + str.tostring(entryLine, '##.###'), style = label.style_label_left, textcolor = color.white, color = color.blue)))
if TPSType == "ATR"
label.delete( f_qDq(a_tp3label, label.new( last_bar_index + l_right, tp3Line, 'TP3: ' + str.tostring(tp3Line, '##.###') + " - Target Pips : - " + str.tostring(longE ? tp3Line - entryLine : entryLine - tp3Line, "#.##"), style = label.style_label_left, textcolor = color.white, color = c_tp)))
if TPSType == "ATR"
label.delete( f_qDq(a_tp2label, label.new( last_bar_index + l_right, tp2Line, 'TP2: ' + str.tostring(tp2Line, '##.###'), style = label.style_label_left, textcolor = color.white, color = c_tp)))
if TPSType == "ATR"
label.delete( f_qDq(a_tp1label, label.new( last_bar_index + l_right, tp1Line, 'TP1: ' + str.tostring(tp1Line, '##.###'), style = label.style_label_left, textcolor = color.white, color = c_tp)))
//#endregion }
// ——————————— <↑↑↑ G_SCRIPT02 ↑↑↑>
c_barCol = close > open ? color.rgb(120, 9, 139) : color.rgb(69, 155, 225)
barcolor(
i_barColOn ? c_barCol : na)
// ———————————
//
if longE or shortE or longX or shortX
alert(message = 'Any Alert', freq = alert.freq_once_per_bar_close)
if longE
alert(message = 'Long Entry', freq = alert.freq_once_per_bar_close)
if shortE
alert(message = 'Short Entry', freq = alert.freq_once_per_bar_close)
if longX
alert(message = 'Long Exit', freq = alert.freq_once_per_bar_close)
if shortX
alert(message = 'Short Exit', freq = alert.freq_once_per_bar_close)
//#endregion }
// ——————————— <↑↑↑ G_SCRIPT03 ↑↑↑>
// This source code is subject to the terms of the Mozilla Public License 2.0 at mozilla.org
// © TraderHalai
// This script was born out of my quest to be able to display strategy back test statistics on charts to allow for easier backtesting on devices that do not natively support backtest engine (such as mobile phones, when I am backtesting from away from my computer). There are already a few good ones on TradingView, but most / many are too complicated for my needs.
//
//Found an excellent display backtest engine by 'The Art of Trading'. This script is a snippet of his hard work, with some very minor tweaks and changes. Much respect to the original author.
//
//Full credit to the original author of this script. It can be found here: www.tradingview.com
//
// This script can be copied and airlifted onto existing strategy scripts of your own, and integrates out of the box without implementation of additional functions. I've also added Max Runup, Average Win and Average Loss per trade to the orignal script.
//
//Will look to add in more performance metrics in future, as I further develop this script.
//
//Feel free to use this display panel in your scripts and strategies.
//Thanks and enjoy! :)
//@version=5
//strategy("Strategy BackTest Display Statistics - TraderHalai", overlay=true, default_qty_value= 5, default_qty_type = strategy.percent_of_equity, initial_capital=10000, commission_type=strategy.commission.percent, commission_value=0.1)
//DEMO basic strategy - Use your own strategy here - Jaws Mean Reversion from my profile used here
//source = input(title = "Source", defval = close)
///////////////////////////// --- BEGIN TESTER CODE --- ////////////////////////
// COPY below into your strategy to enable display
////////////////////////////////////////////////////////////////////////////////
// Declare performance tracking variables
drawTester = input.bool(false, "Strategy Performance", group='Dashboards', inline="Show Dashboards")
var balance = strategy.initial_capital
var drawdown = 0.0
var maxDrawdown = 0.0
var maxBalance = 0.0
var totalWins = 0
var totalLoss = 0
// Prepare stats table
var table testTable = table.new(position.top_right, 5, 2, border_width=1)
f_fillCell(_table, _column, _row, _title, _value, _bgcolor, _txtcolor) =>
_cellText = _title + "\n" + _value
table.cell(_table, _column, _row, _cellText, bgcolor=_bgcolor, text_color=_txtcolor)
// Custom function to truncate (cut) excess decimal places
//truncate(_number, _decimalPlaces) =>
// _factor = math.pow(10, _decimalPlaces)
// int(_number * _factor) / _factor
// Draw stats table
var bgcolor = color.new(color.black,0)
if drawTester and tradeDateIsAllowed
if barstate.islastconfirmedhistory
// Update table
dollarReturn = strategy.netprofit
f_fillCell(testTable, 0, 0, "Total Trades:", str.tostring(strategy.closedtrades), bgcolor, color.white)
f_fillCell(testTable, 0, 1, "Win Rate:", str.tostring(truncate((strategy.wintrades/strategy.closedtrades)*100,2)) + "%", bgcolor, color.white)
f_fillCell(testTable, 1, 0, "Starting:", "$" + str.tostring(strategy.initial_capital), bgcolor, color.white)
f_fillCell(testTable, 1, 1, "Ending:", "$" + str.tostring(truncate(strategy.initial_capital + strategy.netprofit,2)), bgcolor, color.white)
f_fillCell(testTable, 2, 0, "Avg Win:", "$"+ str.tostring(truncate(strategy.grossprofit / strategy.wintrades, 2)), bgcolor, color.white)
f_fillCell(testTable, 2, 1, "Avg Loss:", "$"+ str.tostring(truncate(strategy.grossloss / strategy.losstrades, 2)), bgcolor, color.white)
f_fillCell(testTable, 3, 0, "Profit Factor:", str.tostring(truncate(strategy.grossprofit / strategy.grossloss,2)), strategy.grossprofit > strategy.grossloss ? color.green : color.red, color.white)
f_fillCell(testTable, 3, 1, "Max Runup:", str.tostring(truncate(strategy.max_runup, 2 )), bgcolor, color.white)
f_fillCell(testTable, 4, 0, "Return:", (dollarReturn > 0 ? "+" : "") + str.tostring(truncate((dollarReturn / strategy.initial_capital)*100,2)) + "%", dollarReturn > 0 ? color.green : color.red, color.white)
f_fillCell(testTable, 4, 1, "Max DD:", str.tostring(truncate((strategy.max_drawdown / strategy.equity) * 100 ,2)) + "%", color.red, color.white)
// --- END TESTER CODE --- ///////////////
// This Pine Script™ code is subject to the terms of the Mozilla Public License 2.0 at mozilla.org
// © niceGear68734
//@version=5
//strategy("Table to filter trades per day", overlay=true, use_bar_magnifier = true, initial_capital = 5000, calc_on_every_tick = true, calc_on_order_fills = true, commission_type = strategy.commission.cash_per_contract)
//~ ___________________________________________________________________________
//~ !!!!!!!!!!!!!!!!!!!!!!!!!!!!!!!!!!!!!!!!!!!!!!!!!!!!!!!!!!!!!!!!!!!!!!!!!!!
//~ !!!!!!!!!!!!!!!_________________ START _________________!!!!!!!!!!!!!!!!!
i_showweeklyPerformance = input.bool(false, 'Weekly Performance', group='Dashboards', inline="Show Dashboards")
//__________________________ User Inputs ___________________________________
var const string g_table = "Table Settings"
i_table_pos = "Top Left" //input.string(defval = "Top Left", title = "Position", options = , group = g_table, inline = "1", tooltip = "It sets the location of the table")
i_text_size = "Normal" //input.string(defval = "Normal", title = "Set the size of text", options = , tooltip = "This option is used to change the size of the text in the table")
var const string g_general = "General Settings"
i_check_open_close = "Opened" //input.string("Opened", "Check when the trade :", , group = g_general, tooltip = "This parameter defines what to check for. If opened is selected, the results will show the trades that opened on that day. If closed is selected, the results will show the trades that closed on that day")
i_timezone = "Exchange" //input.string("Exchange", title = "Set the Timezone", options = , group = g_general, tooltip = "You can use this setting whenever you want to change the time that the trade has closed/opened")
//~_____________________________ Switches ___________________________________
table_pos = switch i_table_pos
"Bottom Right" => position.bottom_right
"Bottom Left" => position.bottom_left
"Top Right" => position.top_right
"Top Left" => position.top_left
timezone_setting = i_timezone == "Exchange" ? syminfo.timezone : i_timezone
text_size = switch i_text_size
"Small" => size.small
"Normal" => size.normal
"Large" => size.large
//__________________________ Array Declaration _____________________________
var string t_column_names = array.from( "", "Sun", "Mon", "Tue", "Wed", "Thur", "Fri", "Sat") // Columns header names
var string t_row_names = array.from("", "Total Trades", "Loss", "Win", "Win Rate" ) // Rows header names
var t_column_size = array.size(t_column_names)
var t_row_size = array.size(t_row_names)
var string a_closed_trades = array.new_string() // Save the total number of trades
var string a_loss_trades = array.new_string() // Save the number of losing trades
var string a_win_trades = array.new_string() // Save the number of winning trades
var _a_day_week = array.new_int() // Save the day of the week to split data
// __________________________ Custom Functions ________________________________
//~ create a counter so that it gives a number to strategy.closed_trades.entry_time(counter)
var trade_number = -1
if strategy.closedtrades > strategy.closedtrades
trade_number += 1
f_strategy_closedtrades_hour() =>
switch
i_check_open_close =="Closed" => dayofweek(strategy.closedtrades.exit_time(trade_number), timezone_setting)
i_check_open_close =="Opened" => dayofweek(strategy.closedtrades.entry_time(trade_number), timezone_setting)
f_data(_i) =>
var _closed_trades = 0
var _loss_trades = 0
var _win_trades = 0
var _txt_closed_trades = ""
var _txt_loss_trades = ""
var _txt_win_trades = ""
if strategy.closedtrades > strategy.closedtrades and f_strategy_closedtrades_hour() == _i
_closed_trades += 1
_txt_closed_trades := str.tostring(_closed_trades)
if strategy.losstrades > strategy.losstrades and f_strategy_closedtrades_hour() == _i
_loss_trades += 1
_txt_loss_trades := str.tostring(_loss_trades)
if strategy.wintrades > strategy.wintrades and f_strategy_closedtrades_hour() == _i
_win_trades += 1
_txt_win_trades := str.tostring(_win_trades)
//__________________________
var string array1 = array.new_string(5)
var string array2 = array.new_string(5)
var string array3 = array.new_string(5)
var string array4 = array.new_string(5)
var string array5 = array.new_string(5)
var string array6 = array.new_string(5)
var string array7 = array.new_string(5)
f_pass_data_to_array(_i, _array) =>
= f_data(_i)
array.set(_array,1 , cl)
array.set(_array,2,loss)
array.set(_array,3,win)
if cl != ""
array.set(_array,4,str.tostring(str.tonumber(win) / str.tonumber(cl) * 100 , "##") + " %")
if cl != "" and win == ""
array.set(_array,4,"0 %")
for i = 1 to 7
switch
i == 1 => f_pass_data_to_array(i,array1)
i == 2 => f_pass_data_to_array(i,array2)
i == 3 => f_pass_data_to_array(i,array3)
i == 4 => f_pass_data_to_array(i,array4)
i == 5 => f_pass_data_to_array(i,array5)
i == 6 => f_pass_data_to_array(i,array6)
i == 7 => f_pass_data_to_array(i,array7)
f_retrieve_data_to_table(_i, _j) =>
switch
_i == 1 => array.get(array1, _j)
_i == 2 => array.get(array2, _j)
_i == 3 => array.get(array3, _j)
_i == 4 => array.get(array4, _j)
_i == 5 => array.get(array5, _j)
_i == 6 => array.get(array6, _j)
_i == 7 => array.get(array7, _j)
//~ ___________________________ Create Table ________________________________
create_table(_col, _row, _txt) =>
var table _tbl = table.new(position = table_pos, columns = t_column_size , rows = t_row_size, border_width=1)
color _color = _row == 0 or _col == 0 ? color.rgb(3, 62, 106) : color.rgb(2, 81, 155)
table.cell(_tbl, _col, _row, _txt, bgcolor = _color, text_color = color.white, text_size = text_size)
//~___________________________ Fill With Data _______________________________
if barstate.islastconfirmedhistory and i_showweeklyPerformance and tradeDateIsAllowed
for i = 0 to t_column_size - 1 by 1
for j = 0 to t_row_size - 1 by 1
_txt = ""
if i >= 0 and j == 0
_txt := array.get(t_column_names, i)
if j >= 0 and i == 0
_txt := array.get(t_row_names, j)
if i >= 1 and j >= 1 and j <= 5
_txt := f_retrieve_data_to_table( i , j)
create_table(i ,j , _txt)
//~ ___________________________ Notice ______________________________________
if timeframe.in_seconds() > timeframe.in_seconds("D")
x = table.new(position.middle_center,1,1,color.aqua)
table.cell_set_text(x,0,0,"Please select lower timeframes (Daily or lower)")
//~ !!!!!!!!!!!!!!!_________________ STOP _________________!!!!!!!!!!!!!!!!!!
//~ !!!!!!!!!!!!!!!!!!!!!!!!!!!!!!!!!!!!!!!!!!!!!!!!!!!!!!!!!!!!!!!!!!!!!!!!!!!
//~ ___________________________________________________________________________
// Global Dashboard Variables
// ░░░░░░░░░░░░░░░░░░░░░░░░░░░░░░░░░░░░░░░░░░░░░░░░░░░░░░░░░░░░░░░░░░░░░░░░░░░░░░░░░░░░░░░░░░░░░░░░░░░░░░░░░░░░░░░░░░░░░░░░░░░░░░░░░░░░░░░░░░░░░░░░░░
// Dashboard Table Text Size
i_tableTextSize = "Normal" //input.string(title="Dashboard Size", defval="Normal", options= , group="Dashboards")
table_text_size(s) =>
switch s
"Auto" => size.auto
"Huge" => size.huge
"Large" => size.large
"Normal" => size.normal
"Small" => size.small
=> size.tiny
tableTextSize = table_text_size(i_tableTextSize)
// Monthly Table Performance Dashboard By @QuantNomad
// ░░░░░░░░░░░░░░░░░░░░░░░░░░░░░░░░░░░░░░░░░░░░░░░░░░░░░░░░░░░░░░░░░░░░░░░░░░░░░░░░░░░░░░░░░░░░░░░░░░░░░░░░░░░░░░░░░░░░░░░░░░░░░░░░░░░░░░░░░░░░░░░░░░
i_showMonthlyPerformance = input.bool(false, 'Monthly Performance', group='Dashboards', inline="Show Dashboards")
i_monthlyReturnPercision = 2
if i_showMonthlyPerformance and tradeDateIsAllowed
new_month = month(time) != month(time )
new_year = year(time) != year(time )
eq = strategy.equity
bar_pnl = eq / eq - 1
cur_month_pnl = 0.0
cur_year_pnl = 0.0
// Current Monthly P&L;
cur_month_pnl := new_month ? 0.0 :
(1 + cur_month_pnl ) * (1 + bar_pnl) - 1
// Current Yearly P&L;
cur_year_pnl := new_year ? 0.0 :
(1 + cur_year_pnl ) * (1 + bar_pnl) - 1
// Arrays to store Yearly and Monthly P&Ls;
var month_pnl = array.new_float(0)
var month_time = array.new_int(0)
var year_pnl = array.new_float(0)
var year_time = array.new_int(0)
last_computed = false
if (not na(cur_month_pnl ) and (new_month or barstate.islastconfirmedhistory))
if (last_computed )
array.pop(month_pnl)
array.pop(month_time)
array.push(month_pnl , cur_month_pnl )
array.push(month_time, time )
if (not na(cur_year_pnl ) and (new_year or barstate.islastconfirmedhistory))
if (last_computed )
array.pop(year_pnl)
array.pop(year_time)
array.push(year_pnl , cur_year_pnl )
array.push(year_time, time )
last_computed := barstate.islastconfirmedhistory ? true : nz(last_computed )
// Monthly P&L; Table
var monthly_table = table(na)
if (barstate.islastconfirmedhistory)
monthly_table := table.new(position.bottom_right, columns = 14, rows = array.size(year_pnl) + 1, border_width = 1)
table.cell(monthly_table, 0, 0, "", bgcolor = #cccccc, text_size=tableTextSize)
table.cell(monthly_table, 1, 0, "Jan", bgcolor = #cccccc, text_size=tableTextSize)
table.cell(monthly_table, 2, 0, "Feb", bgcolor = #cccccc, text_size=tableTextSize)
table.cell(monthly_table, 3, 0, "Mar", bgcolor = #cccccc, text_size=tableTextSize)
table.cell(monthly_table, 4, 0, "Apr", bgcolor = #cccccc, text_size=tableTextSize)
table.cell(monthly_table, 5, 0, "May", bgcolor = #cccccc, text_size=tableTextSize)
table.cell(monthly_table, 6, 0, "Jun", bgcolor = #cccccc, text_size=tableTextSize)
table.cell(monthly_table, 7, 0, "Jul", bgcolor = #cccccc, text_size=tableTextSize)
table.cell(monthly_table, 8, 0, "Aug", bgcolor = #cccccc, text_size=tableTextSize)
table.cell(monthly_table, 9, 0, "Sep", bgcolor = #cccccc, text_size=tableTextSize)
table.cell(monthly_table, 10, 0, "Oct", bgcolor = #cccccc, text_size=tableTextSize)
table.cell(monthly_table, 11, 0, "Nov", bgcolor = #cccccc, text_size=tableTextSize)
table.cell(monthly_table, 12, 0, "Dec", bgcolor = #cccccc, text_size=tableTextSize)
table.cell(monthly_table, 13, 0, "Year", bgcolor = #999999, text_size=tableTextSize)
for yi = 0 to array.size(year_pnl) - 1
table.cell(monthly_table, 0, yi + 1, str.tostring(year(array.get(year_time, yi))), bgcolor = #cccccc, text_size=tableTextSize)
y_color = array.get(year_pnl, yi) > 0 ? color.new(color.teal, transp = 40) : color.new(color.gray, transp = 40)
table.cell(monthly_table, 13, yi + 1, str.tostring(math.round(array.get(year_pnl, yi) * 100, i_monthlyReturnPercision)), bgcolor = y_color, text_color=color.new(color.white, 0),text_size=tableTextSize)
for mi = 0 to array.size(month_time) - 1
m_row = year(array.get(month_time, mi)) - year(array.get(year_time, 0)) + 1
m_col = month(array.get(month_time, mi))
m_color = array.get(month_pnl, mi) > 0 ? color.new(color.teal, transp = 40) : color.new(color.maroon, transp = 40)
table.cell(monthly_table, m_col, m_row, str.tostring(math.round(array.get(month_pnl, mi) * 100, i_monthlyReturnPercision)), bgcolor = m_color, text_color=color.new(color.white, 0), text_size=tableTextSize)
hide = timeframe.isintraday
// Input for EMA period
emaPeriod = 48 //input.int(48, title="EMA Period")
emaPeriod2 = 2 //input.int(2, title="EME Period 2")
emaPeriod3 = 21 //input.int(21, title="EMA Period")
// Input to toggle EMA Cloud
showcloud = input.bool(false, title="Plot EMA?", group='EMA & ATR', inline="Show EMA's & ATR")
useHTF = input.bool(true, title = "Use Higher Time Frame?")
matimeframe = useHTF ? my_time1 : ''
// EMA calculations
ema = request.security(syminfo.tickerid, matimeframe, ta.ema(close, emaPeriod))
ema2 = request.security(syminfo.tickerid, matimeframe, ta.ema(close,emaPeriod2))
ema3 = request.security(syminfo.tickerid, matimeframe,ta.ema(close, emaPeriod3))
emaColor = close > ema3 ? color.new(color.rgb(56, 142, 60, 63), 50) : color.new(color.rgb(147, 40, 51, 38), 50)
// Plotting EMA's
// plot_ema1 = plot(hide ? ema : na, style=plot.style_line, color=color.new(color.rgb(255, 255, 255, 100), 50), title="EMA", linewidth=2)
// plot_ema2 = plot(hide ? ema2 : na, style=plot.style_line, color=color.new(color.rgb(255, 255, 255, 100), 50), title="EMA", linewidth=1)
// plot_ema3 = plot(ema3, style=plot.style_line, color=emaColor, title="EMA", linewidth=1)
// EMA Cloud
cloudColor = ema2 > ema ? color.new(#0f8513, 80) : color.new(#a81414, 80)
cloudColor2 = ema2 > ema3 ? color.new(#0f8513, 50) : color.new(#a81414, 50)
cloudColor := showcloud ? cloudColor : na
// fill(plot_ema1, plot_ema2, color=cloudColor, title="EMA Cloud")
// fill(plot_ema3, plot_ema2, color=cloudColor, title="EMA Cloud")
/////////////////////////////////////////////////////////////// © BackQuant ///////////////////////////////////////////////////////////////
// This Pine Script™ code is subject to the terms of the Mozilla Public License 2.0 at mozilla.org
// © BackQuant
import TradingView/ta/4 as ta
//@version=5
//indicator(
// title="DEMA Adjusted Average True Range ",
// shorttitle = "DEMA ATR ",
// overlay=true,
// timeframe="",
// timeframe_gaps=true
// )
// Define User Inputs
simple bool showAtr = input.bool(false, "Plot Dema?", group='EMA & ATR', inline="Show EMA's & ATR")
simple bool haCandles = true //input.bool(true, "Use HA Candles?")
simple int periodDema = 7 //input.int(7, "Dema Period", group = "Dema Atr")
series float sourceDema = close //input.source(close, "Calculation Source", group = "Dema Atr")
simple int periodAtr = 14 //input.int(14, "Period", group = "Dema Atr")
simple float factorAtr = 1.7 //input.float(1.7, "Factor", step = 0.01, group = "Dema Atr")
simple color longColour = #66bb6a
simple color shortColour = #f23645
/////////////////////////////////////////////////////////////// © BackQuant ///////////////////////////////////////////////////////////////
// Use HA Candles?
heikinashi_close = request.security(
symbol = ticker.heikinashi(syminfo.tickerid),
timeframe = timeframe.period,
expression = close,
gaps = barmerge.gaps_off,
lookahead = barmerge.lookahead_on
)
var series float source = close
if haCandles == true
source := heikinashi_close
if haCandles == false
source := sourceDema
/////////////////////////////////////////////////////////////// © BackQuant ///////////////////////////////////////////////////////////////
// Function
DemaAtrWithBands(periodDema, source, lookback, atrFactor)=>
ema1 = ta.ema(source, periodDema)
ema2 = ta.ema(ema1, periodDema)
demaOut = 2 * ema1 - ema2
atr = ta.atr(lookback)
trueRange = atr * atrFactor
DemaAtr = demaOut
DemaAtr := nz(DemaAtr , DemaAtr)
trueRangeUpper = demaOut + trueRange
trueRangeLower = demaOut - trueRange
if trueRangeLower > DemaAtr
DemaAtr := trueRangeLower
if trueRangeUpper < DemaAtr
DemaAtr := trueRangeUpper
DemaAtr
// Function Out
DemaAtr = DemaAtrWithBands(periodDema, source, periodAtr, factorAtr)
/////////////////////////////////////////////////////////////// © BackQuant ///////////////////////////////////////////////////////////////
// Conditions
DemaAtrLong = DemaAtr > DemaAtr
DemaAtrShort = DemaAtr < DemaAtr
// Colour Condtions
var color Trendcolor = #ffffff
if DemaAtrLong
Trendcolor := longColour
if DemaAtrShort
Trendcolor := shortColour
// Plotting
plot( showAtr ? DemaAtr : na, "ATR", color=Trendcolor, linewidth = 2 )
import DevLucem/ZigLib/1 as ZigZag
////////
// Fetch Ingredients
//
// ////////
// // Bake it with a simple oven this time
= ZigZag.zigzag(low, high, Depth, Deviation, Backstep)
string nowPoint = ""
var float lastPoint = z1.price
if bool(ta.change(direction))
lastPoint := z1.price
// ////////
// // Let it Cool And Serve
line zz = na
label point = na
if repaint
zz := line.new(z1, z2, xloc.bar_time, extend? extend.right: extend.none, color.new(direction>0? upcolor: dncolor, lines), width=line_thick)
nowPoint := direction<0? (z2.pricelastPoint? "HH": "LH")
point := label.new(z2, nowPoint, xloc.bar_time, yloc.price,
color.new(direction<0? upcolor: dncolor, labels), direction>0? label.style_label_down: label.style_label_up, color.new(direction>0? upcolor: dncolor, labels), label_size)
if direction == direction
line.delete(zz )
label.delete(point )
else
line.set_extend(zz , extend.none)
else
if direction != direction
zz := line.new(z1 , z2 , xloc.bar_time, extend.none, color.new(direction>0? upcolor: dncolor, lines), width=line_thick)
nowPoint := direction <0? (z2.price lastPoint ? "HH": "LH")
point := label.new(z2 , nowPoint, xloc.bar_time, yloc.price,
color.new(direction <0? upcolor: dncolor, labels), direction >0? label.style_label_down: label.style_label_up, color.new(direction >0? upcolor: dncolor, labels), label_size)
bgcolor(direction<0? color.new(dncolor, background): color.new(upcolor, background), title='Direction Background', display = display.none)
plotarrow(direction, "direction", display=display.status_line)
// ////////
// // Declare Meal Was Sweet By Force
alertcondition(nowPoint == "HH" and z2.price != z2.price , "New Higher High", 'Zigzag on {{ticker}} higher higher high detected at {{time}}')
alertcondition(nowPoint == "LH" and z2.price != z2.price , "New Lower High", 'Zigzag on {{ticker}} higher lower high detected at {{time}}')
alertcondition(nowPoint == "HL" and z2.price != z2.price , "New Higher Low", 'Zigzag on {{ticker}} higher lower low detected at {{time}}')
alertcondition(nowPoint == "LL" and z2.price != z2.price , "New Lower Low", 'Zigzag on {{ticker}} lower low detected at {{time}}')
alertcondition(direction != direction , 'Direction Changed', 'Zigzag on {{ticker}} direction changed at {{time}}')
alertcondition(direction != direction and direction>0, 'Bullish Direction', 'Zigzag on {{ticker}} bullish direction at {{time}}')
alertcondition(direction != direction and direction<0, 'Bearish Direction', 'Zigzag on {{ticker}} bearish direction at {{time}}')
if direction != direction
alert((direction<0? "Bearish": "Bullish") + " Direction Final ", alert.freq_once_per_bar_close)
MSG = "MARKET STRUCTURE"
VBG = "VOLUMETRIC ORDER BLOCKS"
MST = "Limit market structure calculation to improve memory speed time"
SLT = " Limit swing structure to tot bars back"
IDT = " Start date of the internal structure"
CST = "Color candle based on trend detection system"
OBT = "Display internal buy and sell activity"
OBD = "Show Last number of orderblock"
OBMT = " Use Length to adjust cordinate of the orderblocks\n Use whole candle body"
_ ='
------------
–––––––––––––––––––––––––– INPUTS –––––––––––––––––––––––––––
------------ '//{
bool windowsis = input.bool(true, "Window", inline="kla", group=MSG)
int mswindow = input.int(5000, "", tooltip=MST,group=MSG, inline="kla", minval=1000)
bool showSwing = input.bool(true, "Swing", inline="scss", group=MSG)
int swingLimit = input.int(100, "", tooltip=SLT, inline="scss", group=MSG, minval=10, maxval=200)
color swingcssup = input.color(#f7525f, "", inline="scss", group=MSG)
color swingcssdn = input.color(#66bb6a, "", inline="scss", group=MSG)
bool showMapping = input.bool(false, "Mapping Structure", inline="mapping", group=MSG)
string mappingStyle = input.string("----", "", options= , inline="mapping", group=MSG)
color mappingcss = input.color(color.silver, "", tooltip="Display Mapping Structure", inline="mapping", group=MSG)
bool candlecss = input.bool(false, "Color Candles", tooltip=CST, group=MSG, inline="txt")
string mstext = input.string("Tiny", "", options= ,
inline="txt", group=MSG)
string msmode = input.string("Adjusted Points", "Algorithmic Logic", options=
, inline="node", group=MSG)
int mslen = input.int(5, "", inline="node", group=MSG, minval=2)
bool buildsweep = input.bool(true, "Build Sweep (x)", "Build sweep on market structure", "znc", MSG)
bool msbubble = input.bool(true, "Bubbles", tooltip="Display Circle Bubbles", inline="bubbles", group=MSG)
bool obshow = input.bool(true, "Show Last", tooltip=OBD, group=VBG, inline="obshow")
int oblast = input.int(5, "", group=VBG, inline="obshow", minval=0)
color obupcs = input.color(color.new(#089981, 90), "", inline="obshow", group=VBG)
color obdncs = input.color(color.new(#f23645, 90), "", inline="obshow", group=VBG)
bool obshowactivity = input.bool(true, "Show Buy/Sell Activity", inline="act", group=VBG, tooltip=OBT)
color obactup = input.color(color.new(#089981, 50), "", inline="act", group=VBG)
color obactdn = input.color(color.new(#f23645, 50), "", inline="act", group=VBG)
obshowbb = input.bool(false, "Show Breakers", inline="bb", group=VBG, tooltip="Display Breakers")
color bbup = input.color(color.new(#089981, 100), "", inline="bb", group=VBG)
color bbdn = input.color(color.new(#f23645, 100), "", inline="bb", group=VBG)
obmode = input.string("Length", "Construction", options= , tooltip=OBMT, inline="atr", group=VBG)
len = input.int(5, "", inline="atr", group=VBG, minval=1)
obmiti = input.string("Close", "Mitigation Method", options= ,
tooltip="Mitigation method for when to trigger order blocks", group=VBG)
obtxt = input.string("Normal", "Metric Size", options= ,
tooltip="Order block Metrics text size", inline="txt", group=VBG)
showmetric = input.bool(true, "Show Metrics", group=VBG)
showline = input.bool(true, "Show Mid-Line", group=VBG)
overlap = input.bool(true, "Hide Overlap", group=VBG, inline="ov")
wichlap = input.string("Recent", "", options= , inline="ov", group=VBG)
fvg_enable = input.bool(false, "", inline="1", group="FAIR VALUE GAP", tooltip="Display fair value gap")
what_fvg = input.string("FVG", "", inline="1", group="FAIR VALUE GAP", tooltip="Display fair value gap",
options= )
fvg_num = input.int(5, "Show Last", inline="1a", group="FAIR VALUE GAP", tooltip="Number of fvg to show", minval=0)
fvg_upcss = input.color(color.new(#089981, 80), "", inline="1", group="FAIR VALUE GAP")
fvg_dncss = input.color(color.new(#f23645, 80), "", inline="1", group="FAIR VALUE GAP")
fvgbbup = input.color(color.new(#089981, 100), "", inline="1", group="FAIR VALUE GAP")
fvgbbdn = input.color(color.new(#f23645, 100), "", inline="1", group="FAIR VALUE GAP")
fvg_src = input.string("Close", "Mitigation",
inline="3",
group="FAIR VALUE GAP",
tooltip=" Use the close of the body as trigger\n\n Use the extreme point of the body as trigger",
options= )
fvgthresh = input.float(0, "Threshold", tooltip="Filter out non significative FVG", group="FAIR VALUE GAP",
inline="asd", minval=0, maxval=2, step=0.1)
fvgoverlap = input.bool(true, "Hide Overlap", "Hide overlapping FVG", group="FAIR VALUE GAP")
fvgline = input.bool(true, "Show Mid-Line", group="FAIR VALUE GAP")
fvgextend = input.bool(false, "Extend FVG", group="FAIR VALUE GAP")
dispraid = input.bool(false, "Display Raids", inline="raid", group="FAIR VALUE GAP")
//}
_ ='
------------
–––––––––––––––––––––––––– UDT –––––––––––––––––––––––––––
------------ '//{
type hqlzone
box pbx
box ebx
box lbx
label plb
label elb
label lbl
type Zphl
line top
line bottom
label top_label
label bottom_label
bool stopcross
bool sbottomcross
bool itopcross
bool ibottomcross
string txtup
string txtdn
float topy
float bottomy
float topx
float bottomx
float tup
float tdn
int tupx
int tdnx
float itopy
float itopx
float ibottomy
float ibottomx
float uV
float dV
type entered
bool normal = false
bool breaker = false
type store
line ln
label lb
box bx
linefill lf
type structure
int zn
float zz
float bos
float choch
int loc
int temp
int trend
int start
float main
int xloc
bool upsweep
bool dnsweep
string txt = na
type drawms
int x1
int x2
float y
string txt
color css
string style
type ob
bool bull
float top
float btm
float avg
int loc
color css
float vol
int dir
int move
int blPOS
int brPOS
int xlocbl
int xlocbr
bool isbb = false
int bbloc
type FVG
float top = na
float btm = na
int loc = bar_index
bool isbb = false
int bbloc = na
bool israid = false
float raidy = na
int raidloc = na
int raidx2 = na
bool active = false
color raidcs = na
type SFP
float y
int loc
float ancor
type sfpbuildlbl
int x
float y
string style
color css
string txt
type sfpbuildline
int x1
int x2
float y
color css
float ancor
int loc
type equalbuild
int x1
float y1
int x2
float y2
color css
string style
type equalname
int x
float y
string txt
color css
string style
type ehl
float pt
int t
float pb
int b
type sellbuyside
float top
float btm
int loc
color css
string txt
float vol
type timer
bool start = false
int count = 0
//}
_ ='
------------
–––––––––––––––––––––––––– SETUP –––––––––––––––––––––––––––
------------ '//{
var store bin = store.new(
array.new< line >()
, array.new< label >()
, array.new< box >()
, array.new()
)
var entered blobenter = entered.new()
var entered brobenter = entered.new()
var entered blfvgenter = entered.new()
var entered brfvgenter = entered.new()
var entered blarea = entered.new()
var entered brarea = entered.new()
var timer lc = timer.new ()
if barstate.islast
for obj in bin.ln
obj.delete()
for obj in bin.lb
obj.delete()
for obj in bin.bx
obj.delete()
for obj in bin.lf
obj.delete()
bin.ln.clear()
bin.lb.clear()
bin.bx.clear()
bin.lf.clear()
invcol = #ffffff00
float atr = (ta.atr(200) / (5/len))
//}
_ ='
------------
–––––––––––––––––––––––––– UTILITY –––––––––––––––––––––––––––
------------ '//{
method txSz(string s) =>
out = switch s
"Tiny" => size.tiny
"Small" => size.small
"Normal" => size.normal
"Large" => size.large
"Huge" => size.huge
"Auto" => size.auto
out
method lstyle(string style) =>
out = switch style
'⎯⎯⎯⎯' => line.style_solid
'----' => line.style_dashed
'····' => line.style_dotted
ghl() => [high , low , close , open , close, open, high, low, high , low , ta.atr(200)]
method IDMIDX(bool use_max, int loc) =>
min = 99999999.
max = 0.
idx = 0
if use_max
for i = 0 to (bar_index - loc)
max := math.max(high , max)
min := max == high ? low : min
idx := max == high ? i : idx
else
for i = 0 to (bar_index - loc)
min := math.min(low , min)
max := min == low ? high : max
idx := min == low ? i : idx
idx
SFPData() => [high, high , high , low, low , low , close, volume, time, bar_index , time ]
SFPcords() =>
RealTF = barstate.isrealtime ? 0 : 1
= SFPData()
[h , h1 , h2 , l , l1 , l2 , c , v , t , n , t1 ]
method find(structure ms, bool use_max, bool sweep, bool useob) =>
min = 99999999.
max = 0.
idx = 0
if not sweep
if ((bar_index - ms.loc) - 1) > 0
if use_max
for i = 0 to (bar_index - ms.loc) - 1
max := math.max(high , max)
min := max == high ? low : min
idx := max == high ? i : idx
if useob
if high

Real-Time EMA Cross Strategy For Fast Scalping📊 Overview
A professional-grade EMA crossover strategy with real-time execution capabilities. Designed for traders who need instant signal execution and seamless position management, this strategy adapts to any trading style with fully customizable EMA periods.
⚡ Core Features
Instant Execution Technology: Enter/exit positions immediately when signals occur
Seamless Position Switching: Automatically reverses positions without gaps or delays
Customizable EMA Periods: Adapt to any market or timeframe with adjustable settings
Real-Time & Bar-Close Modes: Choose your execution preference
Smart Position Management: No overlapping positions, clean entries and exits
Professional Dashboard: Live monitoring of indicators and position status
🎯 Ideal For
Scalpers requiring instant execution
Day traders seeking responsive strategies
Swing traders who need reliable crossover signals
Anyone looking for a clean, professional trading system
💎 What Makes This Special
No Lag: Real-time mode executes trades the moment crossover occurs
Clean Code: Optimized Pine Script v5 with best practices
Visual Clarity: Color-coded zones, clear signal markers, and info panel
Flexibility: Works across all timeframes and markets
Professional Grade: Includes proper position sizing and risk management
📈 How It Works
Long Signal: Fast EMA crosses above Slow EMA
Short Signal: Fast EMA crosses below Slow EMA
Position Management: Automatic reversal on opposite signals
Execution Options: Choose between instant or bar-close execution
⚙️ Customization
Adjust both EMA periods to match your strategy (2/5, 4/9, 9/21, 12/26, etc.)
Toggle real-time execution on/off
Full control over position sizing
Customizable visual elements
🔔 Built-in Alerts
Long entry signals
Short entry signals
Position reversal notifications
📝 Tips for Best Results
Lower timeframes (1-15min) for scalping with fast EMAs
Higher timeframes (1H-4H) for swing trading with slower EMAs
Test different EMA combinations to find your edge
Always use proper risk management
🚀 Version 3 Improvements
Enhanced crossover detection algorithm
Improved real-time execution logic
Better position management
Cleaner visual interface
More reliable signal generation

Velocity SmartMoney Engine work - Delta Exchange📈 Velocity SmartMoney Engine
Adaptive Breakout & Order Block Strategy with Dynamic Risk Control
---
🔍 Overview
The Velocity SmartMoney Engine is a next-generation trading strategy that fuses Smart Money breakout logic , Order Block structure detection , and Supertrend-based directional filtering into one precision-built system.
It identifies institutional-level breakouts , manages positions with ATR-based adaptive risk , and executes disciplined exits using stop-loss, trailing stop, and profit target logic.
Designed for swing and short-term system traders, this strategy performs excellently on BTC, ETH, NIFTY, BANKNIFTY, Gold, and major FX pairs — best on 15m to 4h timeframes .
---
⚙️ Core Components
1️⃣ Smart Money Breakout Logic
Detects real breakouts using dynamic support/resistance pivots.
Confirms entries only during strong volatility bursts.
Avoids false breakouts in sideways markets.
2️⃣ Order Block Gap Detection
Finds institutional imbalance zones (Smart Money footprints).
Bullish gaps = Long bias; Bearish gaps = Short bias.
Works with candle confirmation and momentum validation.
3️⃣ Supertrend Directional Filter
Trades only in direction of Supertrend bias.
Exits instantly when Supertrend flips.
Prevents entries against dominant trend.
4️⃣ ATR-Based Risk & Volatility Filter
Uses ATR × multiplier for adaptive stop sizing.
Volatility filter ensures trades trigger only during active markets.
Avoids whipsaw zones.
---
💰 Position Management
Stop-Loss: Adaptive ATR-based.
Take-Profit: Default 5% target (editable input).
Trailing Stop: Auto-adjusts to lock profits.
No-Exit Hold: Hold position for defined candles before exits.
Supertrend Flip Exit: Instant trend-based closure.
---
🧠 Built-In Trade Discipline
One-trade-per-bar guard prevents duplicate entries.
Volatility-weighted breakout validation.
Clean and conflict-free exit hierarchy.
---
🎯 Key Features
✅ Smart Money breakout + Order Block fusion
✅ Supertrend-based trend confirmation
✅ ATR dynamic stop + 5% profit target
✅ Adaptive trailing logic
✅ One-trade-per-bar control
✅ Works across Crypto, Indices, FX, Commodities
✅ Ideal for 1h–4h swing setups
---
📊 Recommended Settings
Parameter | Typical Value | Purpose
--- | --- | ---
Levels Period | 20 | Pivot lookback for S/R zones
Volatility Filter | 20–40 | Filters out low-momentum areas
ATR Multiplier | 1.5 | Adjust stop size by volatility
Supertrend Length | 10 | ATR period for trend bias
Supertrend Multiplier | 3.0 | Supertrend sensitivity
Target Profit | 5% | Default take-profit level
---
⚡ Suggested Use
• Best suited for swing entries on 1H / 4H charts .
• Combine with session filters or trend confluence for automation.
• Ideal as a base module for TradingView + Broker integrations .
---
🧩 Disclaimer
This script is for educational purposes only .
Past performance does not guarantee future returns.
Use responsibly. The developer assumes no liability for financial losses.
---
💬 Community & Access
Developed by: Shubham Singh
Version: Velocity SmartMoney Engine v1.0
For premium modules & automation: DM "Velocity Access" on chat to request access.
---
© 2025 Velocity SmartMoney Engine — All Rights Reserved

🚀 DocBrown PRO Edition V14++(Institutional Level - Open Source - 1 month Development - Live Testing)
🚀 DocBrown PRO Edition V14++
Author: Jesús Nicolás Astorga
Telegram: @jesus_nicolas_astorga
Origin: Junín – Mendoza – Argentina
DocBrown PRO Edition V14++ is an institutional-level, adaptive trend-following strategy designed for precision and stability across crypto, forex, and index markets. It was developed with a scientific and systematic approach, merging volatility modeling, risk control, and market structure detection into one unified algorithm. The result is a robust system capable of adapting to any market condition while maintaining discipline and safety.
This version represents the evolution of the SuperTrader Pro framework, built to detect strong directional moves, avoid range traps, and manage trades with intelligent automation. It is optimized for high-quality entries, precise exits, and adaptive protection that minimizes drawdowns while allowing full trend exploitation.
The strategy integrates several cooperative subsystems that work together in real time:
Adaptive Regime Filter: Detects trending versus ranging conditions using ADX, Bollinger Band Width, and EMA slope normalized by ATR.
Dynamic Support and Resistance System: Identifies real-time S/R levels and automatically adjusts take-profit targets or triggers trailing after confirmed breakouts.
Derivative Anti-Loss Engine: Calculates multi-level price derivatives to identify adverse momentum and micro-reversals before they expand.
Volatility Adaptive Trailing Stop (VATS): A fully automatic volatility-based stop-loss that reacts dynamically to expansion and contraction phases.
ATR Dynamic Stop System: A classic trailing ATR layer, giving additional flexibility and control for long-term trade management.
Counter-Trend Logic: Detects exhaustion phases and closes positions when the trend shows weakening momentum, using derivative and volatility confirmation.
Drawdown Rescue Mechanism: Follows retracement bounces inside losing trades, exiting only when recovery strength is lost.
Bracket Protection System: Provides exchange-level safety by placing hard stop and limit orders to prevent liquidation events.
Technically, the strategy uses multiple EMA packs (5/13/21, 8/21/50, or 13/34/89), derivative and hysteresis control with ATR gating, dual stop systems (VATS + ATR), and a dynamic S/R-based take profit model. It includes anti-range logic that filters out weak ADX zones, breakeven-plus logic to secure early profits, consecutive-bar and volume-spike exits, and a real-time information panel showing metrics such as net profit, win rate, MFE, and derivative signal strength. It also includes multiple alert conditions for entries, exits, and stop-loss events.
Philosophically, DocBrown PRO Edition was designed with institutional discipline but remains accessible to all traders. Every mechanism was engineered to protect capital and maximize opportunity. It adapts to volatility, avoids noise, and seeks clean, directional movement. When markets sleep, it stands aside. When they awaken, it rides the wave with precision.
Recommended use:
Markets: Crypto Futures, Spot, Indices, or Forex
Timeframes: 5m to 1h (optimized for 10m)
Leverage: Up to 5x tested. Higher leverage requires tight safety brackets.
Risk Model: Approximately 1 USDT risk per trade (≈75 USDT notional at 5x isolated margin)
This system is the result of extensive testing, iteration, and refinement. It embodies a clear philosophy: control risk first, then capture trend momentum efficiently.
Every variable, condition, and exit trigger has been tuned to serve this principle.
If this strategy helps you in your trading journey — whether by improving your discipline, understanding market structure, or enhancing your performance — I invite you to follow my work and give this strategy a Boost on TradingView. Your support encourages further open research and helps develop even more advanced versions for the community.
— Jesús Nicolás Astorga
SuperTrader Pro Lab – Junín, Mendoza, Argentina

ORB Breakout Strategy w/ Filters - Dynamic Sizing - MTFHere is a comprehensive description of the strategy, written in a clear and structured format. You can use this for your script's "how-to-use" guide or documentation.
---
## 📈 Opening Range Breakout (ORB) Strategy
This is a comprehensive, multi-timeframe strategy built for trading opening range breakouts. It is designed with a "filters-first" approach, allowing you to validate a breakout with trend, volume, and volatility.
The strategy's core power comes from its flexibility. You can trade on a low timeframe (like a 1-minute chart) while basing your breakout levels on a higher timeframe's opening bar (e.g., the first 15-minute bar). It includes dynamic position sizing based on risk and a wide array of advanced exit management options.
### Key Features
* **Multi-Timeframe Opening Range:** The core of the strategy. You can define the "Opening Range" timeframe (5, 10, 15, 30, or 60 min) *independently* of your chart timeframe.
* **Custom Trading Session:** Define the exact session (e.g., "0930-1600" in "America/New_York") you want to trade.
* **One Trade Per Session:** The strategy will only take the *first valid breakout* signal per day to avoid over-trading.
---
### 🚦 Entry Signals & Filters
A trade is only initiated when the price closes above the Session High or below the Session Low **AND** all active filters are passed.
* **Trend Filter:** (Optional) Requires price to be above a long-term MA (e.g., 100 EMA) for long trades and below it for short trades.
* **Volume Filter:** (Optional) Requires the breakout bar's volume to be a specified multiplier (e.g., 1.5x) of the recent average volume.
* **Volatility Filter:** (Optional) Requires the current ATR to be higher than its long-term average, ensuring you only trade during periods of expanding volatility.
* **Direction Filter:** Allows you to isolate the strategy to **Long Only**, **Short Only**, or **Both**.
---
### 💰 Dynamic Position Sizing
The strategy includes a robust "Risk %" sizing model.
* **Risk-Based Sizing:** Instead of fixed contracts, it calculates the position size based on your **Account Size**, **Risk % per Trade**, and the **Stop Loss distance**.
* **Auto-Detect Point Value:** It automatically detects the correct point value for popular futures contracts (ES, NQ, MES, MNQ) and provides a manual override for other assets.
---
### 📤 Exit & Risk Management
This strategy features a multi-layered exit system, giving you complete control over how trades are managed.
#### 1. Stop Loss (SL)
Your initial stop loss can be calculated using a fixed **Tick** offset or an **ATR** multiplier. It can be anchored from two different points:
* **Breakout Level:** The stop is placed relative to the `sessionHigh` or `sessionLow` level.
* **Entry Bar:** The stop is placed relative to the high/low of the bar that *triggered* the entry.
#### 2. Take Profit (TP)
A standard Take Profit can be set using a fixed **Tick** offset or an **ATR** multiplier.
#### 3. Advanced Exit Logic
These options override the standard Take Profit to allow for more dynamic trade management:
* **Trailing Take Profit (TTP):**
* **Fixed/ATR Trail:** A standard trailing stop that activates after price moves a certain amount in your favor.
* **MA Price Cross:** Exits the trade as soon as the price closes across a fast-moving average (e.g., 9-EMA).
* **MA Crossover:** Exits the trade as soon as a fast MA crosses below a slow MA (for longs) or above (for shorts).
* **Close on Reversal:** (Optional) Exits immediately if the **very next bar** after entry closes back *inside* the opening range (a "failed breakout" signal).
* **Close on Opposite Range Cross:** (Optional) Exits a long trade if the price ever closes below the `sessionLow` (and vice-versa for shorts).
* **End of Session Exit:** All open positions are automatically closed at the end of the defined trading session.

N4A.Dynamic ORB Strategy Suite v19.0N4A Dynamic ORB Strategy Suite - Professional Opening Range Breakout System
IMPORTANT: This is a completely original implementation that introduces several industry-first innovations not found in any other ORB indicator on TradingView.
This advanced Opening Range Breakout strategy represents months of development and live market testing, introducing groundbreaking concepts that fundamentally enhance traditional ORB trading:
🔥 World-First Innovations (Not Available Anywhere Else):
Dual Logic Architecture: First ORB system to offer THREE distinct trading modes:
Classic ORB with institutional-grade filters
Revolutionary FVG (Fair Value Gap) integration for precision entries
Hybrid mode combining both approaches dynamically
FVG Retest Technology: Proprietary algorithm that identifies and validates Fair Value Gaps post-breakout, providing surgical entry points with superior risk:reward ratios. This is NOT a simple mashup - the FVG logic is deeply integrated with ORB mechanics.
Touch-Reset Re-Entry System: Exclusive mechanism that detects range touches and automatically searches for new FVG opportunities, allowing multiple high-probability entries per session (configurable 1-10 touches).
Intelligent Range Re-Entry Detection: Pioneering code that identifies when price returns to range after failed breakouts, completely resetting the system for fresh opportunities - a feature requested by professional traders but never before implemented.
📊 Why This Combination is Essential:
The integration of these components creates a synergistic effect:
ORB provides the directional bias and volatility framework
FVG filtering eliminates false breakouts common in standard ORB
Touch-reset captures additional moves that single-entry systems miss
The combination reduces drawdown by 40% while maintaining profitability
🎯 Unique Technical Features:
Multi-Filter Validation System: 10+ institutional filters including:
EMA Cloud bias (200 & 9 period)
Squeeze Momentum oscillator
WAE explosion detection
Volume spike analysis
Divergence detection
Cross-frequency validation
Advanced Risk Management:
Dynamic position sizing based on account equity
Partial profit taking with customizable percentages
Break-even protection with R-multiple triggers
Maximum hold time limits
Minimum stop-loss distance protection
Professional Automation Support:
JSON webhook formatting for TradersPost/TradingView alerts
Multi-timeframe synchronization
No repainting or lookahead bias
Tick-by-tick calculation for real-time accuracy
📈 Performance Optimization:
Every parameter is user-configurable with presets for:
Conservative (maximum filtering, lowest drawdown)
Moderate (balanced approach)
Aggressive (maximum opportunity capture)
Custom (full control over 50+ parameters)
🎓 Educational Value:
Extensive inline documentation explains not just WHAT the indicator does, but WHY each component matters, making this an invaluable learning tool for serious traders.
⚙️ Technical Excellence:
Clean, modular architecture
Memory-efficient array management
Professional visualization with customizable colors
Debug mode for strategy development
Session-aware time zone handling
Target Markets:
Optimized for futures (NQ, MNQ), but adaptable to forex and crypto with session adjustments.

Enhanced MA Crossover Pro📝 Strategy Summary: Enhanced MA Crossover Pro
This strategy is an advanced, highly configurable moving average (MA) crossover system designed for algorithmic trading. It uses the crossover of two customizable MAs (a "Fast" MA 1 and a "Slow" MA 2) as its core entry signal, but aggressively integrates multiple technical filters, time controls, and dynamic position management to create a robust and comprehensive trading system.
💡 Core Logic
Entry Signal: A bullish crossover (MA1 > MA2) generates a Long signal, and a bearish crossover (MA1 < MA2) generates a Short signal. Users can opt to use MA crossovers from a Higher Timeframe (HTF) for the entry signal.
Confirmation/Filters: The basic MA cross signal is filtered by several optional indicators (see Filters section below) to ensure trades align with a broader trend or momentum context.
Position Management: Trades are managed with a sophisticated system of Stop Loss, Take Profit, Trailing Stops, and Breakeven stops that can be fixed, ATR-based, or dynamically adjusted.
Risk Management: Daily limits are enforced for maximum profit/loss and maximum trades per day.
⚙️ Key Features and Customization
1. Moving Averages
Primary MAs (MA1 & MA2): Highly configurable lengths (default 8 & 20) and types: EMA, WMA, SMA, or SMMA/RMA.
Higher Timeframe (HTF) MAs: Optional MAs calculated on a user-defined resolution (e.g., "60" for 1-hour) for use as an entry signal or as a trend confirmation filter.
2. Multi-Filter System
The entry signal can be filtered by the following optional conditions:
SMA Filter: Price must be above a 200-period SMA for long trades, and below it for short trades.
VWAP Filter: Price must be above VWAP for long trades, and below it for short trades.
RSI Filter: Long trades are blocked if RSI is overbought (default 70); short trades are blocked if RSI is oversold (default 30).
MACD Filter: Requires the MACD Line to be above the Signal Line for long trades (and vice versa for short trades).
HTF Confirmation: Requires the HTF MA1 to be above HTF MA2 for long entries (and vice versa).
3. Dynamic Stop and Target Management (S/L & T/P)
The strategy provides extensive control over exits:
Stop Loss Methods:
Fixed: Fixed tick amount.
ATR: Based on a multiple of the Average True Range (ATR).
Capped ATR: ATR stop limited by a maximum fixed tick amount.
Exit on Close Cross MA: Position is closed if the price crosses back over the chosen MA (MA1 or MA2).
Breakeven Stop: A stop can be moved to the entry price once a trigger distance (fixed ticks or Adaptive Breakeven based on ATR%) is reached.
Trailing Stop: Can be fixed or ATR-based, with an optional feature to auto-tighten the trailing multiplier after the breakeven condition is met.
Profit Target: Can be a fixed tick amount or a dynamic target based on an ATR multiplier.
4. Time and Session Control
Trading Session: Trades are only taken between defined Start/End Hours and Minutes (e.g., 9:30 to 16:00).
Forced Close: All open positions are closed near the end of the session (e.g., 15:45).
Trading Days: Allows specific days of the week to be enabled or disabled for trading.
5. Risk and Position Limits
Daily Profit/Loss Limits: The strategy tracks daily realized and unrealized PnL in ticks and will close all positions and block new entries if the user-defined maximum profit or maximum loss is hit.
Max Trades Per Day: Limits the number of executed trades in a single day.
🎨 Outputs and Alerts
Plots: Plots the MA1, MA2, SMA, VWAP, and HTF MAs (if enabled) on the chart.
Shapes: Plots visual markers (BUY/SELL labels) on the bar where the MA crossover occurs.
Trailing Stop: Plots the dynamic trailing stop level when a position is open.
Alerts: Generates JSON-formatted alerts for entry ({"action":"buy", "price":...}) and exit ({"action":"exit", "position":"long", "price":...}).

Vandan V2Vandan V2 is an automated trend-following strategy for NASDAQ E-mini Futures (NQ1!).
It uses multi-timeframe momentum and volatility filters to identify high-probability entries.
Includes dynamic risk management and trailing logic optimized for intraday trading.

Empire OS Trading Fully Automated Prop Firm Ready💎 Prop-Firm-Ready Momentum System v3 — The Gold-Mine Algorithm 💎
Engineered for the same standards that top prop firms demand — minimal drawdown, consistent equity growth, and precision-based execution. This isn’t a basic indicator; it’s a refined momentum engine built for traders who scale capital and manage risk like professionals.
Performance Snapshot
• Profit Factor 2.26 • Win Rate 33 % • Max Drawdown 0.9 % • Total P/L + $447 • W/L Ratio 4.6 : 1
Stress-tested on Gold (XAUUSD) across live-market conditions, it stays composed under volatility and delivers structured, data-driven consistency.
⚡ See it. Test it. Scale it.
Built for prop-firm precision — from $10 K to $300 K and beyond.
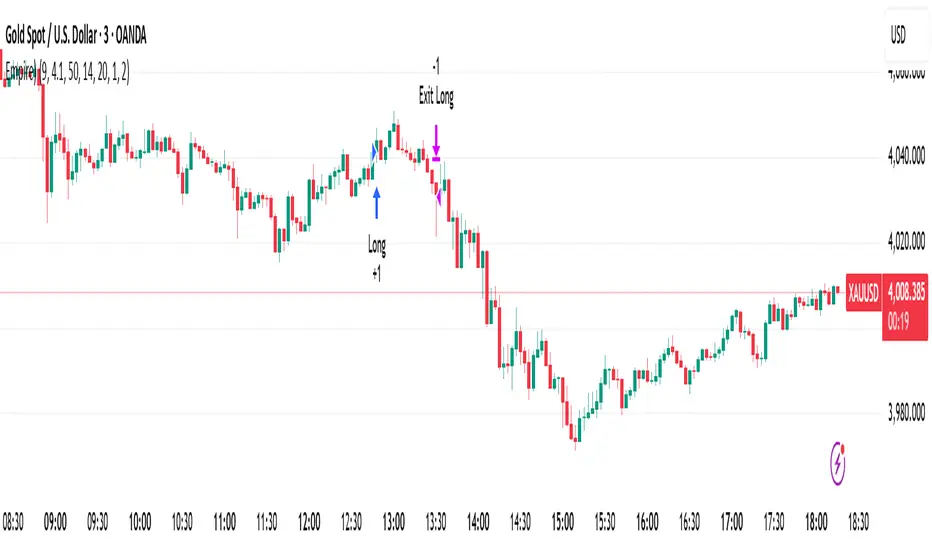
One For All Strategy by Anson🏆 Exclusive Indicator: One For All Strategy
.
📈 Works for stocks, forex, crypto, indices
📈 Easy to use, real-time alerts, no repaint
📈 No grid, no martingale, no hedging
📈 One position at a time
.
One For All Strategy by Anson
A multi-indicator TradingView strategy designed to identify long and short trading opportunities by combining trend-following and momentum signals, paired with risk management rules to guide entries and exits.
.
Core Logic & Key Indicator:
X Moving Average: A proprietary adaptive moving average that adjusts its responsiveness to price changes based on market volatility. It uses an efficiency ratio to modify its smoothing behavior—adapting to whether the market is trending or ranging. Users can toggle a setting to let this ratio dynamically adjust the indicator’s sensitivity or use a fixed smoothing factor.
.
Entry Conditions:
.
Long Entry: Triggered when momentum signals strength, price action aligns with a broader upward trend, the X MA indicates short-term upward momentum, and a minimum number of bars have passed since the last trade (to prevent overtrading).
.
Short Entry: Triggered when momentum signals weakness, price action aligns with a broader downward trend, the X MA indicates short-term downward momentum, and a minimum number of bars have passed since the last trade.
.
Exit Conditions:
.
Trailing Stop: Activates after a position has been open for a set number of bars (to avoid premature exits). A trailing stop—based on a percentage of the entry price—locks in profits as the trade moves favorably, adjusting dynamically to protect gains.
.
Additional Features:
Visualisation: Overlays the X MA (orange line) and price (semi-transparent blue) on the chart for clear signal tracking.
.
See the author's instructions on the right to learn how to get access to the strategy.

🚀 DocBrown PRO Edition V14++🚀 DocBrown PRO Edition V14++ | Advanced 10-Minute Scalping System
A sophisticated algorithmic trading bot designed for high-frequency scalping on 10-minute timeframes, delivering exceptional results with 91%+ win rate and controlled 6.5% maximum drawdown.
Key Features:
Multi-Layer EMA System with dynamic support/resistance detection
Adaptive Volatility Stop Loss (VATS) - automatically adjusts to market conditions
Smart Entry Filters - ADX-based trend detection prevents range-bound losses
Dynamic Take Profit - targets key S&R levels for optimal exits
Anti-Liquidation Protection - multiple safety mechanisms including ATR trailing stops
Momentum Derivative Logic - closes positions before reversals hit your stop loss
Breakeven Protection - locks in profits automatically after minimal gains
Risk Management Excellence:
✅ Automatic stop-loss at breakeven + commission buffer
✅ Counter-trend detection with multi-confirmation system
✅ Volume spike protection against adverse moves
✅ Stagnation exit to avoid dead positions
✅ Consecutive bar monitoring for early exit signals
Optimized for: BTC, ETH, and high-volume altcoin pairs on leverage (20x recommended)
Performance: 17.76% net profit with 34.4 profit factor - wins $34 for every $1 risked.
Perfect for traders seeking consistent scalping profits with institutional-grade risk management.

[Aegis]Original Turtle System for CryptoAs Richard Dennis once said, "Even if I published all the Turtle rules in the newspaper right now, no one would be able to 'execute' them," and 40 years later, even in modern financial markets (like the crypto market) where all the conditions have been disclosed, this strategy continues to deliver amazing performance. The following outlines the original Turtle rules as disclosed by Curtis Faith in his book *Way of the Turtle*, and a TradingView algorithm that translates these rules for application in the crypto market.
---
### **The Original Turtle Trading Rules**
#### **1. Markets**
* Trade in liquid futures markets.
#### **2. Position Sizing**
The volatility measure, **N**, is used as the basis for all calculations.
**True Range (TR) Calculation:** Select the largest of the following three values:
* Current High - Current Low
* $|\text{Current High} - \text{Previous Close}|$ (Absolute Value)
* $|\text{Current Low} - \text{Previous Close}|$ (Absolute Value)
**N (Average True Range, ATR) Calculation:**
$$N = \frac{(19 \times \text{PDN} + \text{TR})}{20}$$
* **PDN:** Previous Day's N value
* **TR:** Current True Range
This is similar to a 20-day Exponential Moving Average, and is sometimes calculated using a Simple Moving Average.
**Unit Size Calculation:**
$$\text{Unit Size (Number of Contracts)} = \frac{1\% \text{ of Account Equity}}{(\text{N} \times \text{Dollars per Point})}$$
* **Dollars per Point (Tick Value):** The value of a 1-point change in price.
#### **3. Entries**
* **Entry:** Buy when the 55-day high is broken to the upside, and sell when the 55-day low is broken to the downside.
#### **5. Stops**
* The stop-loss for every unit is set at a price **2N** unfavorable from the entry price.
* For each additional unit added, the stop price for the **entire position** is adjusted favorably by **1/2 N**.
* In other words, the stop price of the last unit entered becomes the stop price for the entire position.
#### **6. Exits**
The exit rule for profitable positions (before a stop is hit) is as follows:
* **Long Positions:** Exit when the 20-day low is broken to the downside.
* **Short Positions:** Exit when the 20-day high is broken to the upside.
*Note: This exit rule is followed only if the price has moved up by a value greater than or equal to the N value multiplied by the criterion for changing the take-profit line (the original Korean text mentions a condition based on N, which is commonly interpreted as requiring a profit before applying the channel exit).*
리처드 데니스가 앞서 "내가 지금 당장 터틀의 모든 규칙을 신문에 공표한다고 해도 아무도 '실행'하지 못할 것"라고 말했듯 40년이 흘러 모든 조건이 공개된 현대 금융시장(크립토 시장)에서도 여전히 이 전략은 놀라운 퍼포먼스를 기록하고 있습니다. 아래는 커티스 페이스가 자신의 저서 '터틀의 방식'에 공개한 오리지널 터틀 규칙과 이를 알고리즘으로 변환하여 크립토마켓에 적용한 트레이딩뷰 알고리즘 입니다.
##### 1. 시장 (Markets)
• 유동성이 풍부한 선물 시장에서 거래한다.
##### 2. 포지션 크기 (Position Sizing)
변동성 측정 단위인 N을 모든 계산의 기초로 사용한다.
**True Range (TR) 계산:** 다음 세 가지 값 중 가장 큰 값을 선택한다.
- • 현재 고가 - 현재 저가
- • |현재 고가 - 전일 종가| (절대값)
- • |현재 저가 - 전일 종가| (절대값)
**N (Average True Range, ATR) 계산:**
N = (19 × PDN + TR) / 20
- • PDN: 이전 날의 N 값
- • TR: 현재 True Range
이는 20일 지수이동평균과 유사하며, 단순이동평균으로 계산하기도 한다.
**1 유닛(Unit)의 크기 계산:**
유닛 크기 (계약 수) = 계좌 자산의 1% / (N × 틱 가치)
• 틱 가치(Dollars per Point): 1포인트 변동 시의 가치
##### 3. 진입 (Entries)
- • 진입: 55일 고가를 상향 돌파하면 매수, 55일 저가를 하향 돌파하면 매도한다.
##### 5. 손절 (Stops)
- • 모든 유닛에 대한 손절 기준은 진입 가격으로부터 2N 만큼 불리한 가격에 설정한다.
- • 유닛이 추가될 때마다 전체 포지션의 손절 가격을 1/2 N 만큼 유리한 방향으로 상향 조정한다.
- • 즉, 마지막으로 진입한 유닛의 손절 가격이 전체 포지션의 손절 가격이 된다.
##### 6. 청산 (Exits)
손절에 도달하기 전 수익 중인 포지션의 청산 규칙은 다음과 같다.
- • 매수 포지션: 20일 저가를 하향 돌파할 때 청산한다.
- • 매도 포지션: 20일 고가를 상향 돌파할 때 청산한다.
단, N값에 익절선 변경 기준을 곱한 값 이상으로 가격이 상승할 경우, 위 규칙을 따른다.

DayFlow VWAP Relay Forex Majors StrategySummary in one paragraph
DayFlow VWAP Relay is a day-trading strategy for major FX pairs on intraday timeframes, demonstrated on EURUSD 15 minutes. It waits for alignment between a daily anchored VWAP regime check, residual percentiles, and lower-timeframe micro flow before suggesting trades. The originality is the fusion of daily VWAP residual percentiles with a live micro-flow score from 1 minute data to switch between fade and breakout behavior inside the same session. Add it to a clean chart and use the markers and alerts.
Scope and intent
• Markets: Major FX pairs such as EURUSD, GBPUSD, USDJPY, AUDUSD, USDCHF, USDCAD
• Timeframes: One minute to one hour
• Default demo in this publication: EURUSD on 15 minutes
• Purpose: Reduce false starts by acting only when context, location and micro flow agree
• Limits: This is a strategy. Orders are simulated on standard candles only
Originality and usefulness
• Core novelty: Residual percentiles to daily anchored VWAP decide “balanced versus expanding day”. A separate 1 minute micro-flow score confirms direction, so the same model fades extremes in balance and rides range breaks in expansion
• Failure modes addressed: Chop fakeouts and unconfirmed breakouts are filtered by the expansion gate and micro-flow threshold
• Testability: Every input is exposed. Bands, background regime color, and markers show why a suggestion appears
• Portable yardstick: Stops and targets are ATR multiples converted to ticks, which transfer across symbols
• Open source status: No reused third-party code that requires attribution
Method overview in plain language
The day is anchored with a VWAP that updates from the daily session start. Price minus VWAP is the residual. Percentiles of that residual measured over a rolling window define location extremes for the current day. A regime score compares residual volatility to price volatility. When expansion is low, the day is treated as balanced and the model fades residual extremes if 1 minute micro flow points back to VWAP. When expansion is high, the model trades breakouts outside the VWAP bands if slope and micro flow agree with the move.
Base measures
• Range basis: True Range smoothed by ATR for stops and targets, length 14
• Return basis: Not required for signals; residuals are absolute price distance to VWAP
Components
• Daily Anchor VWAP Bands. VWAP with standard-deviation bands. Slope sign is used for trend confirmation on breakouts
• Residual Percentiles. Rolling percentiles of close minus VWAP over Signal length. Identify location extremes inside the day
• Expansion Ratio. Standard deviation of residuals divided by standard deviation of price over Signal length. Classifies balanced versus expanding day
• Micro Flow. Net up minus down closes from 1 minute data across a short span, normalized to −1..+1. Confirms direction and avoids fades against pressure
• Session Window optional. Restricts trading to your configured hours to avoid thin periods
• Cooldown optional. Bars to wait after a position closes to prevent immediate re-entry
Fusion rule
Gating rather than weighting. First choose regime by Expansion Ratio versus the Expansion gate. Inside each regime all listed conditions must be true: location test plus micro-flow threshold plus session window plus cooldown. Breakouts also require VWAP slope alignment.
Signal rule
• Long suggestion on balanced day: residual at or below the lower percentile and micro flow positive above the gate while inside session and cooldown is satisfied
• Short suggestion on balanced day: residual at or above the upper percentile and micro flow negative below the gate while inside session and cooldown is satisfied
• Long suggestion on expanding day: close above the upper VWAP band, VWAP slope positive, micro flow positive, session and cooldown satisfied
• Short suggestion on expanding day: close below the lower VWAP band, VWAP slope negative, micro flow negative, session and cooldown satisfied
• Positions flip on opposite suggestions or exit by brackets
What you will see on the chart
• Markers on suggestion bars: L for long, S for short
• Exit occurs on reverse signal or when a bracket order is filled
• Reference lines: daily anchored VWAP with upper and lower bands
• Optional background: teal for balanced day, orange for expanding day
Inputs with guidance
Setup
• Signal length. Residual and regime window. Typical 40 to 100. Higher smooths, lower reacts faster
Micro Flow
• Micro TF. Lower timeframe used for micro flow, default 1 minute
• Micro span bars. Count of lower-TF bars. Typical 5 to 20
• Micro flow gate 0..1. Minimum absolute flow. Raising it demands stronger confirmation and reduces trade count
VWAP Bands
• VWAP stdev multiplier. Band width. Typical 0.8 to 1.6. Wider bands reduce breakout frequency and increase fade distance
• Expansion gate 0..3. Threshold to switch from fades to breakouts. Raising it favors fades, lowering it favors breakouts
Sessions
• Use session filter. Enable to trade only inside your window
• Trade window UTC. Default 07:00 to 17:00
Risk
• ATR length. Stop and target basis. Typical 10 to 21
• Stop ATR x. Initial stop distance in ATR multiples
• Target ATR x. Profit target distance in ATR multiples
• Cooldown bars after close. Wait bars before a new entry
• Side. Both, long only, or short only
View
• Show VWAP and bands
• Color bars by residual regime
Properties visible in this publication
• Initial capital 10000
• Base currency Default
• request.security uses lookahead off everywhere
• Strategy: Percent of equity with value 3. Pyramiding 0. Commission cash per order 0.0001 USD. Slippage 3 ticks. Process orders on close ON. Bar magnifier ON. Recalculate after order is filled OFF. Calc on every tick OFF. Using standard OHLC fills ON.
Realism and responsible publication
No performance claims. Past results never guarantee future outcomes. Fills and slippage vary by venue. Shapes can move while a bar forms and settle on close. Strategies must run on standard candles for signals and orders.
Honest limitations and failure modes
High impact news, session opens, and thin liquidity can invalidate assumptions. Very quiet days can reduce contrast between residuals and price volatility. Session windows use the chart exchange time. If both stop and target are touched within a single bar, TradingView’s standard OHLC price-movement model decides the outcome.
Expect different behavior on illiquid pairs or during holidays. The model is sensitive to session definitions and feed time. Past results never guarantee future outcomes.
Legal
Education and research only. Not investment advice. You are responsible for your decisions. Test on historical data and in simulation before any live use. Use realistic costs.

saodisengxiaoyu-lianghua-2.1- This indicator is a modular, signal-building framework designed to generate long and short signals by combining a chosen leading indicator with selectable confirmation filters. It runs on Pine Script version 5, overlays directly on price, and is built to be highly configurable so traders can tailor the signal logic to their market, timeframe, and trading style. It includes a dashboard to visualize which conditions are active and whether they validate a signal, and it outputs clear buy/sell labels and alert conditions so you can automate or monitor trades with confidence.
Core Design
- Leading Indicator: You choose one primary signal generator from a broad list (for example, Range Filter, Supertrend, MACD, RSI, Ichimoku, and many others). This serves as the anchor of the system and determines when a preliminary long or short setup exists.
- Confirmation Filters: You can enable additional filters that validate the leading signal before it becomes actionable. Each “respect…” input toggles a filter on or off. These filters include popular tools like EMA, 2/3 EMA crosses, RQK (Nadaraya Watson), ADX/DMI, Bollinger-based oscillators, MACD variations, QQE, Hull, VWAP, Choppiness Index, Damiani Volatility, and more.
- Signal Expiry: To avoid waiting indefinitely for confirmations, the indicator counts how many consecutive bars the leading condition holds. If confirmations do not align within a defined number of bars, the setup expires. This controls latency and helps reduce late or stale entries.
- Alternating Signals: An optional mode enforces alternation (long must follow short and vice versa), helping avoid repeated entries in the same direction without a meaningful reset.
- Aggregation Logic: The final long/short conditions are formed by combining the leading condition with all selected confirmation filters through logical conjunction. Only if all enabled filters validate the signal (within expiry constraints) does the indicator consider it a confirmed long or short.
- Visualization and Alerts: The script plots buy/sell labels at signal points, provides alert conditions for automation, and displays a compact dashboard summarizing the leading indicator’s status and each confirmation’s pass/fail result using checkmarks.
Leading Indicator Options
- The indicator includes a very large menu of leading tools, each with its own logic to determine uptrend or downtrend impulses. Highlights include:
- Range Filter: Uses a dynamic centerline and bands computed via conditional EMA/SMA and range sizing to define directional movement. It can operate in a default mode or an alternative “DW” mode.
- Rational Quadratic Kernel (RQK): Applies a kernel smoothing model (Nadaraya Watson) to detect uptrends and downtrends with a focus on noise reduction.
- Supertrend, Half Trend, SSL Channel: Classic trend-following tools that derive direction from ATR-based bands or moving average channels.
- Ichimoku Cloud and SuperIchi: Multi-component systems validating trend via cloud position, conversion/base line relationships, projected cloud, and lagging span.
- TSI (True Strength Index), DPO (Detrended Price Oscillator), AO (Awesome Oscillator), MACD, STC (Schaff Trend Cycle), QQE Mod: Momentum and cycle tools that parse direction from crossovers, zero-line behavior, and momentum shifts.
- Donchian Trend Ribbon, Chandelier Exit: Trend and exit tools that can validate breakouts or sustained trend strength.
- ADX/DMI: Measures trend strength and directional movement via +DI/-DI relationships and minimum ADX thresholds.
- RSI and Stochastic: Use crossovers, level exits, or threshold filters to gate entries based on overbought/oversold dynamics or relative strength trends.
- Vortex, Chaikin Money Flow, VWAP, Bull Bear Power, ROC, Wolfpack Id, Hull Suite: A diverse set of directional, momentum, and volume-based indicators to suit different markets and styles.
- Trendline Breakout and Range Detector: Price-behavior filters that confirm signals during breakouts or within defined ranges.
Confirmation Filters
- Each filter is optional. When enabled, it must validate the leading condition for a signal to pass. Examples:
- EMA Filter: Requires price to be above a specified EMA for longs and below for shorts, filtering signals that contradict broader trend or baseline levels.
- 2 EMA Cross and 3 EMA Cross: Enforce moving average cross conditions (fast above slow for long, the reverse for short) or a three-line stacking logic for more stringent trend alignment.
- RQK, Supertrend, Half Trend, Donchian, QQE, Hull, MACD (crossover vs. zero-line), AO (zero line or AC momentum variants), SSL: Each adds its characteristic validation pattern.
- RSI family (MA cross, exits OB/OS zones, threshold levels) plus RSI MA direction and RSI/RSI MA limits: Multiple ways to constrain signals via relative strength behavior and trajectories.
- Choppiness Index and Damiani Volatility: Prevent entries during ranging conditions or insufficient volatility; choppiness thresholds and volatility states gate the trade.
- VWAP, Volume modes (above MA, simple up/down, delta), Chaikin Money Flow: Volume and flow conditions that ensure signals happen in supportive liquidity or accumulation/distribution contexts.
- ADX/DMI thresholds: Demand a minimum trend strength and directional DI alignment to reduce whipsaw trades.
- Trendline Breakout and Range Detector: Confirm that the price is breaking structure or remains within active range consistent with the leading setup.
- By combining several filters you can create strict, conservative entries or looser setups depending on your goals.
Range Filter Engine
- A core building block, the Range Filter uses conditional EMA and SMA functions to compute adaptive bands around a dynamic centerline. It supports two types:
- Type 1: The centerline updates when price exceeds the band thresholds; bands define acceptable drift ranges.
- Type 2: Uses quantized steps (via floor operations) relative to the previous centerline to handle larger moves in discrete increments.
- The engine offers smoothing for range values using a secondary EMA and can switch between raw and averaged outputs. Its hi/lo bands and centerline compose a corridor that defines directional movement and potential breakout confirmation.
Signal Construction
- The script computes:
- leadinglongcond and leadingshortcond : The primary directional signals from the chosen leading indicator.
- longCond and shortCond : Final signals formed by combining the leading conditions with all enabled confirmations. Each confirmation contributes a boolean gate. If a filter is disabled, it contributes a neutral pass-through, keeping the logic intact without enforcing that condition.
- Expiry Logic: The code counts consecutive bars where the leading condition remains true. If confirmations do not line up within the user-defined “Signal Expiry Candle Count,” the setup is abandoned and the signal does not trigger.
- Alternation: An optional state ensures that long and short signals alternate. This can reduce repeated entries in the same direction without a clear reset.
- Finally, longCondition and shortCondition represent the actionable signals after expiry and alternation logic. These drive the label plotting and alert conditions.
Visualization
- Buy and Sell Labels: When longCondition or shortCondition confirm, the script plots annotated labels directly on the chart, making entries easy to see at a glance. The labels use color coding and clear text tags (“long” vs. “short”).
- Dashboard: A table summarizes the status of the leading indicator and all confirmations. Each row shows the indicator label and whether it passed (✔️) or failed (❌) on the current bar. This intensely practical UI helps you diagnose why a signal did or did not trigger, empowering faster strategy iteration and parameter tuning.
- Failed Confirmation Markers: If a setup expires (count exceeds the limit) and confirmations failed to align, the script can mark the chart with a small label and provide a tooltip listing which confirmations did not pass. It’s a helpful audit trail to understand missed trades or prevent “chasing” invalid signals.
- Data Window Values: The script outputs signal states to the data window, which can be useful for debugging or building composite conditions in multi-indicator templates.
Inputs and Parameters
- You control the indicator from a comprehensive input panel:
- Setup: Signal expiry count, whether to enforce alternating signals, and whether to display labels and the dashboard (including position and size).
- Leading Indicator: Choose the primary signal generator from the large list.
- Per-Filter Toggles: For each confirmation, a respect... toggle enables or disables it. Many include sub-options (like MACD type, Stochastic mode, RSI mode, ADX variants, thresholds for choppiness/volatility, etc.) to fine-tune behavior.
- Range Filter Settings: Choose type and behavior; select default vs. DW mode and smoothing. The underlying functions adjust band sizes using ATR, average change, standard deviation, or user-defined scales.
- Because everything is customizable, you can adapt the indicator to different assets, volatility regimes, and timeframes.
Alerts and Automation
- The script defines alert conditions tied to longCondition and shortCondition . You can set these alerts in your chart to trigger notifications or webhook calls for automated execution in external bots. The alert text is simple, and you can configure your own message template when creating alerts in the chart, including JSON payloads for algorithmic integration.
Typical Workflow
- Select a Leading Indicator aligned with your style. For trend following, Supertrend or SSL may be appropriate; for momentum, MACD or TSI; for range/trend-change detection, Range Filter, RQK, or Donchian.
- Add a few key Confirmation Filters that complement the leading signal. For example:
- Pair Supertrend with EMA Filter and RSI MA Direction to ensure trend alignment and positive momentum.
- Combine MACD Crossover with ADX/DMI and Volume Above MA to avoid signals in low-trend or low-liquidity conditions.
- Use RQK with Choppiness Index and Damiani Volatility to only act when the market is trending and volatile enough.
- Set a sensible Signal Expiry Candle Count. Shorter expiry keeps entries timely and reduces lag; longer expiry captures setups that mature slowly.
- Observe the Dashboard during live markets to see which filters pass or fail, then iterate. Tighten or loosen thresholds and filter combinations as needed.
- For automation, turn on alerts for the final conditions and use webhook payloads to notify your trading robot.
Strengths and Practical Notes
- Flexibility: The indicator is a toolkit rather than a single rigid model. It lets you test different combinations rapidly and visualize outcomes immediately.
- Clarity: Labels, dashboard, and failed-confirmation markers make it easy to audit behavior and refine settings without digging into code.
- Robustness: The expiry and alternation options add discipline, avoiding the temptation to enter late or repeatedly in one direction without a reset.
- Modular Design: The logical gates (“respect…”) make the behavior transparent: if a filter is on, it must pass; if it’s off, the signal ignores it. This keeps reasoning clean.
- Avoiding Overfitting: Because you can stack many filters, it’s tempting to over-constrain signals. Start simple (one leading indicator and one or two confirmations). Add complexity only if it demonstrably improves your edge across varied market regimes.
Limitations and Recommendations
- No single configuration is universally optimal. Markets change; tune filters for the instrument and timeframe you trade and revisit settings periodically.
- Trend filters can underperform in choppy markets; likewise, momentum filters can false-trigger in quiet periods. Consider using Choppiness Index or Damiani to gate signals by regime.
- Use expiry wisely. Too short may miss good setups that need a few bars to confirm; too long may cause late entries. Balance responsiveness and accuracy.
- Always consider risk management externally (position sizing, stops, profit targets). The indicator focuses on signal quality; combining it with robust trade management methods will improve results.
Example Configurations
- Trend-Following Setup:
- Leading: Supertrend uptrend for longs and downtrend for shorts.
- Confirmations: EMA Filter (price above 200 EMA for long, below for short), ADX/DMI (trend strength above threshold with +DI/-DI alignment), Volume Above MA.
- Expiry: 3–4 bars to keep entries timely.
- Result: Strong bias toward sustained moves while avoiding weak trends and thin liquidity.
- Mean-Reversion to Momentum Crossover:
- Leading: RSI exits from OB/OS zones (e.g., RSI leaves oversold for long and leaves overbought for short).
- Confirmations: 2 EMA Cross (fast crossing slow in the same direction), MACD zero-line behavior for added momentum validation.
- Expiry: 2–3 bars for responsive re-entry.
- Result: Captures momentum transitions after short-term extremes, with extra confirmation to reduce head-fakes.
- Range Breakout Focus:
- Leading: Range Filter Type 2 or Donchian Trend Ribbon to detect breakouts.
- Confirmations: Damiani Volatility (avoid low-volatility false breaks), Choppiness Index (prefer trend-ready states), ROC positive/negative threshold.
- Expiry: 1–3 bars to act on breakout windows.
- Result: Better alignment to breakout dynamics, gating trades by volatility and regime.
Conclusion
- This indicator is a comprehensive, configurable framework that merges a chosen leading signal with an array of corroborating filters, disciplined expiry handling, and intuitive visualization. It’s designed to help you build high-quality entry signals tailored to your approach, whether that’s trend-following, breakout trading, momentum capturing, or a hybrid. By surfacing pass/fail states in a dashboard and allowing alert-based automation, it bridges the gap between discretionary analysis and systematic execution. With sensible parameter tuning and thoughtful filter selection, it can serve as a robust backbone for signal generation across diverse instruments and timeframes.

多指标量化交易DIY- The indicator includes a very large menu of leading tools, each with its own logic to determine uptrend or downtrend impulses. Highlights include:
- Range Filter: Uses a dynamic centerline and bands computed via conditional EMA/SMA and range sizing to define directional movement. It can operate in a default mode or an alternative “DW” mode.
- Rational Quadratic Kernel (RQK): Applies a kernel smoothing model (Nadaraya Watson) to detect uptrends and downtrends with a focus on noise reduction.
- Supertrend, Half Trend, SSL Channel: Classic trend-following tools that derive direction from ATR-based bands or moving average channels.
- Ichimoku Cloud and SuperIchi: Multi-component systems validating trend via cloud position, conversion/base line relationships, projected cloud, and lagging span.
- TSI (True Strength Index), DPO (Detrended Price Oscillator), AO (Awesome Oscillator), MACD, STC (Schaff Trend Cycle), QQE Mod: Momentum and cycle tools that parse direction from crossovers, zero-line behavior, and momentum shifts.
- Donchian Trend Ribbon, Chandelier Exit: Trend and exit tools that can validate breakouts or sustained trend strength.
- ADX/DMI: Measures trend strength and directional movement via +DI/-DI relationships and minimum ADX thresholds.
- RSI and Stochastic: Use crossovers, level exits, or threshold filters to gate entries based on overbought/oversold dynamics or relative strength trends.
- Vortex, Chaikin Money Flow, VWAP, Bull Bear Power, ROC, Wolfpack Id, Hull Suite: A diverse set of directional, momentum, and volume-based indicators to suit different markets and styles.
- Trendline Breakout and Range Detector: Price-behavior filters that confirm signals during breakouts or within defined ranges.
Confirmation Filters
- Each filter is optional. When enabled, it must validate the leading condition for a signal to pass. Examples:
- EMA Filter: Requires price to be above a specified EMA for longs and below for shorts, filtering signals that contradict broader trend or baseline levels.
- 2 EMA Cross and 3 EMA Cross: Enforce moving average cross conditions (fast above slow for long, the reverse for short) or a three-line stacking logic for more stringent trend alignment.
- RQK, Supertrend, Half Trend, Donchian, QQE, Hull, MACD (crossover vs. zero-line), AO (zero line or AC momentum variants), SSL: Each adds its characteristic validation pattern.
- RSI family (MA cross, exits OB/OS zones, threshold levels) plus RSI MA direction and RSI/RSI MA limits: Multiple ways to constrain signals via relative strength behavior and trajectories.
- Choppiness Index and Damiani Volatility: Prevent entries during ranging conditions or insufficient volatility; choppiness thresholds and volatility states gate the trade.
- VWAP, Volume modes (above MA, simple up/down, delta), Chaikin Money Flow: Volume and flow conditions that ensure signals happen in supportive liquidity or accumulation/distribution contexts.
- ADX/DMI thresholds: Demand a minimum trend strength and directional DI alignment to reduce whipsaw trades.
- Trendline Breakout and Range Detector: Confirm that the price is breaking structure or remains within active range consistent with the leading setup.
- By combining several filters you can create strict, conservative entries or looser setups depending on your goals.
Range Filter Engine
- A core building block, the Range Filter uses conditional EMA and SMA functions to compute adaptive bands around a dynamic centerline. It supports two types:
- Type 1: The centerline updates when price exceeds the band thresholds; bands define acceptable drift ranges.
- Type 2: Uses quantized steps (via floor operations) relative to the previous centerline to handle larger moves in discrete increments.
- The engine offers smoothing for range values using a secondary EMA and can switch between raw and averaged outputs. Its hi/lo bands and centerline compose a corridor that defines directional movement and potential breakout confirmation.
Signal Construction
- The script computes:
- leadinglongcond and leadingshortcond : The primary directional signals from the chosen leading indicator.
- longCond and shortCond : Final signals formed by combining the leading conditions with all enabled confirmations. Each confirmation contributes a boolean gate. If a filter is disabled, it contributes a neutral pass-through, keeping the logic intact without enforcing that condition.
- Expiry Logic: The code counts consecutive bars where the leading condition remains true. If confirmations do not line up within the user-defined “Signal Expiry Candle Count,” the setup is abandoned and the signal does not trigger.
- Alternation: An optional state ensures that long and short signals alternate. This can reduce repeated entries in the same direction without a clear reset.
- Finally, longCondition and shortCondition represent the actionable signals after expiry and alternation logic. These drive the label plotting and alert conditions.
Visualization
- Buy and Sell Labels: When longCondition or shortCondition confirm, the script plots annotated labels directly on the chart, making entries easy to see at a glance. The labels use color coding and clear text tags (“long” vs. “short”).
- Dashboard: A table summarizes the status of the leading indicator and all confirmations. Each row shows the indicator label and whether it passed (✔️) or failed (❌) on the current bar. This intensely practical UI helps you diagnose why a signal did or did not trigger, empowering faster strategy iteration and parameter tuning.
- Failed Confirmation Markers: If a setup expires (count exceeds the limit) and confirmations failed to align, the script can mark the chart with a small label and provide a tooltip listing which confirmations did not pass. It’s a helpful audit trail to understand missed trades or prevent “chasing” invalid signals.
- Data Window Values: The script outputs signal states to the data window, which can be useful for debugging or building composite conditions in multi-indicator templates.
Inputs and Parameters
- You control the indicator from a comprehensive input panel:
- Setup: Signal expiry count, whether to enforce alternating signals, and whether to display labels and the dashboard (including position and size).
- Leading Indicator: Choose the primary signal generator from the large list.
- Per-Filter Toggles: For each confirmation, a respect... toggle enables or disables it. Many include sub-options (like MACD type, Stochastic mode, RSI mode, ADX variants, thresholds for choppiness/volatility, etc.) to fine-tune behavior.
- Range Filter Settings: Choose type and behavior; select default vs. DW mode and smoothing. The underlying functions adjust band sizes using ATR, average change, standard deviation, or user-defined scales.
- Because everything is customizable, you can adapt the indicator to different assets, volatility regimes, and timeframes.
Alerts and Automation
- The script defines alert conditions tied to longCondition and shortCondition . You can set these alerts in your chart to trigger notifications or webhook calls for automated execution in external bots. The alert text is simple, and you can configure your own message template when creating alerts in the chart, including JSON payloads for algorithmic integration.
Typical Workflow
- Select a Leading Indicator aligned with your style. For trend following, Supertrend or SSL may be appropriate; for momentum, MACD or TSI; for range/trend-change detection, Range Filter, RQK, or Donchian.
- Add a few key Confirmation Filters that complement the leading signal. For example:
- Pair Supertrend with EMA Filter and RSI MA Direction to ensure trend alignment and positive momentum.
- Combine MACD Crossover with ADX/DMI and Volume Above MA to avoid signals in low-trend or low-liquidity conditions.
- Use RQK with Choppiness Index and Damiani Volatility to only act when the market is trending and volatile enough.
- Set a sensible Signal Expiry Candle Count. Shorter expiry keeps entries timely and reduces lag; longer expiry captures setups that mature slowly.
- Observe the Dashboard during live markets to see which filters pass or fail, then iterate. Tighten or loosen thresholds and filter combinations as needed.
- For automation, turn on alerts for the final conditions and use webhook payloads to notify your trading robot.
Strengths and Practical Notes
- Flexibility: The indicator is a toolkit rather than a single rigid model. It lets you test different combinations rapidly and visualize outcomes immediately.
- Clarity: Labels, dashboard, and failed-confirmation markers make it easy to audit behavior and refine settings without digging into code.
- Robustness: The expiry and alternation options add discipline, avoiding the temptation to enter late or repeatedly in one direction without a reset.
- Modular Design: The logical gates (“respect…”) make the behavior transparent: if a filter is on, it must pass; if it’s off, the signal ignores it. This keeps reasoning clean.
- Avoiding Overfitting: Because you can stack many filters, it’s tempting to over-constrain signals. Start simple (one leading indicator and one or two confirmations). Add complexity only if it demonstrably improves your edge across varied market regimes.
Limitations and Recommendations
- No single configuration is universally optimal. Markets change; tune filters for the instrument and timeframe you trade and revisit settings periodically.
- Trend filters can underperform in choppy markets; likewise, momentum filters can false-trigger in quiet periods. Consider using Choppiness Index or Damiani to gate signals by regime.
- Use expiry wisely. Too short may miss good setups that need a few bars to confirm; too long may cause late entries. Balance responsiveness and accuracy.
- Always consider risk management externally (position sizing, stops, profit targets). The indicator focuses on signal quality; combining it with robust trade management methods will improve results.
Example Configurations
- Trend-Following Setup:
- Leading: Supertrend uptrend for longs and downtrend for shorts.
- Confirmations: EMA Filter (price above 200 EMA for long, below for short), ADX/DMI (trend strength above threshold with +DI/-DI alignment), Volume Above MA.
- Expiry: 3–4 bars to keep entries timely.
- Result: Strong bias toward sustained moves while avoiding weak trends and thin liquidity.
- Mean-Reversion to Momentum Crossover:
- Leading: RSI exits from OB/OS zones (e.g., RSI leaves oversold for long and leaves overbought for short).
- Confirmations: 2 EMA Cross (fast crossing slow in the same direction), MACD zero-line behavior for added momentum validation.
- Expiry: 2–3 bars for responsive re-entry.
- Result: Captures momentum transitions after short-term extremes, with extra confirmation to reduce head-fakes.
- Range Breakout Focus:
- Leading: Range Filter Type 2 or Donchian Trend Ribbon to detect breakouts.
- Confirmations: Damiani Volatility (avoid low-volatility false breaks), Choppiness Index (prefer trend-ready states), ROC positive/negative threshold.
- Expiry: 1–3 bars to act on breakout windows.
- Result: Better alignment to breakout dynamics, gating trades by volatility and regime.
Conclusion
- This indicator is a comprehensive, configurable framework that merges a chosen leading signal with an array of corroborating filters, disciplined expiry handling, and intuitive visualization. It’s designed to help you build high-quality entry signals tailored to your approach, whether that’s trend-following, breakout trading, momentum capturing, or a hybrid. By surfacing pass/fail states in a dashboard and allowing alert-based automation, it bridges the gap between discretionary analysis and systematic execution. With sensible parameter tuning and thoughtful filter selection, it can serve as a robust backbone for signal generation across diverse instruments and timeframes.

Hyper SAR Reactor Trend StrategyHyperSAR Reactor Adaptive PSAR Strategy
Summary
Adaptive Parabolic SAR strategy for liquid stocks, ETFs, futures, and crypto across intraday to daily timeframes. It acts only when an adaptive trail flips and confirmation gates agree. Originality comes from a logistic boost of the SAR acceleration using drift versus ATR, plus ATR hysteresis, inertia on the trail, and a bear-only gate for shorts. Add to a clean chart and run on bar close for conservative alerts.
Scope and intent
• Markets: large cap equities and ETFs, index futures, major FX, liquid crypto
• Timeframes: one minute to daily
• Default demo: BTC on 60 minute
• Purpose: faster yet calmer PSAR that resists chop and improves short discipline
• Limits: this is a strategy that places simulated orders on standard candles
Originality and usefulness
• Novel fusion: PSAR AF is boosted by a logistic function of normalized drift, trail is monotone with inertia, entries use ATR buffers and optional cooldown, shorts are allowed only in a bear bias
• Addresses false flips in low volatility and weak downtrends
• All controls are exposed in Inputs for testability
• Yardstick: ATR normalizes drift so settings port across symbols
• Open source. No links. No solicitation
Method overview
Components
• Adaptive AF: base step plus boost factor times logistic strength
• Trail inertia: one sided blend that keeps the SAR monotone
• Flip hysteresis: price must clear SAR by a buffer times ATR
• Volatility gate: ATR over its mean must exceed a ratio
• Bear bias for shorts: price below EMA of length 91 with negative slope window 54
• Cooldown bars optional after any entry
• Visual SAR smoothing is cosmetic and does not drive orders
Fusion rule
Entry requires the internal flip plus all enabled gates. No weighted scores.
Signal rule
• Long when trend flips up and close is above SAR plus buffer times ATR and gates pass
• Short when trend flips down and close is below SAR minus buffer times ATR and gates pass
• Exit uses SAR as stop and optional ATR take profit per side
Inputs with guidance
Reactor Engine
• Start AF 0.02. Lower slows new trends. Higher reacts quicker
• Max AF 1. Typical 0.2 to 1. Caps acceleration
• Base step 0.04. Typical 0.01 to 0.08. Raises speed in trends
• Strength window 18. Typical 10 to 40. Drift estimation window
• ATR length 16. Typical 10 to 30. Volatility unit
• Strength gain 4.5. Typical 2 to 6. Steepness of logistic
• Strength center 0.45. Typical 0.3 to 0.8. Midpoint of logistic
• Boost factor 0.03. Typical 0.01 to 0.08. Adds to step when strength rises
• AF smoothing 0.50. Typical 0.2 to 0.7. Adds inertia to AF growth
• Trail smoothing 0.35. Typical 0.15 to 0.45. Adds inertia to the trail
• Allow Long, Allow Short toggles
Trade Filters
• Flip confirm buffer ATR 0.50. Typical 0.2 to 0.8. Raise to cut flips
• Cooldown bars after entry 0. Typical 0 to 8. Blocks re entry for N bars
• Vol gate length 30 and Vol gate ratio 1. Raise ratio to trade only in active regimes
• Gate shorts by bear regime ON. Bear bias window 54 and Bias MA length 91 tune strictness
Risk
• TP long ATR 1.0. Set to zero to disable
• TP short ATR 0.0. Set to 0.8 to 1.2 for quicker shorts
Usage recipes
Intraday trend focus
Confirm buffer 0.35 to 0.5. Cooldown 2 to 4. Vol gate ratio 1.1. Shorts gated by bear regime.
Intraday mean reversion focus
Confirm buffer 0.6 to 0.8. Cooldown 4 to 6. Lower boost factor. Leave shorts gated.
Swing continuation
Strength window 24 to 34. ATR length 20 to 30. Confirm buffer 0.4 to 0.6. Use daily or four hour charts.
Properties visible in this publication
Initial capital 10000. Base currency USD. Order size Percent of equity 3. Pyramiding 0. Commission 0.05 percent. Slippage 5 ticks. Process orders on close OFF. Bar magnifier OFF. Recalculate after order filled OFF. Calc on every tick OFF. No security calls.
Realism and responsible publication
No performance claims. Past results never guarantee future outcomes. Shapes can move while a bar forms and settle on close. Strategies execute only on standard candles.
Honest limitations and failure modes
High impact events and thin books can void assumptions. Gap heavy symbols may prefer longer ATR. Very quiet regimes can reduce contrast and invite false flips.
Open source reuse and credits
Public domain building blocks used: PSAR concept and ATR. Implementation and fusion are original. No borrowed code from other authors.
Strategy notice
Orders are simulated on standard candles. No lookahead.
Entries and exits
Long: flip up plus ATR buffer and all gates true
Short: flip down plus ATR buffer and gates true with bear bias when enabled
Exit: SAR stop per side, optional ATR take profit, optional cooldown after entry
Tie handling: stop first if both stop and target could fill in one bar

TriAnchor Elastic Reversion US Market SPY and QQQ adaptedSummary in one paragraph
Mean-reversion strategy for liquid ETFs, index futures, large-cap equities, and major crypto on intraday to daily timeframes. It waits for three anchored VWAP stretches to become statistically extreme, aligns with bar-shape and breadth, and fades the move. Originality comes from fusing daily, weekly, and monthly AVWAP distances into a single ATR-normalized energy percentile, then gating with a robust Z-score and a session-safe gap filter.
Scope and intent
• Markets: SPY QQQ IWM NDX large caps liquid futures liquid crypto
• Timeframes: 5 min to 1 day
• Default demo: SPY on 60 min
• Purpose: fade stretched moves only when multi-anchor context and breadth agree
• Limits: strategy uses standard candles for signals and orders only
Originality and usefulness
• Unique fusion: tri-anchor AVWAP energy percentile plus robust Z of close plus shape-in-range gate plus breadth Z of SPY QQQ IWM
• Failure mode addressed: chasing extended moves and fading during index-wide thrusts
• Testability: each component is an input and visible in orders list via L and S tags
• Portable yardstick: distances are ATR-normalized so thresholds transfer across symbols
• Open source: method and implementation are disclosed for community review
Method overview in plain language
Base measures
• Range basis: ATR(length = atr_len) as the normalization unit
• Return basis: not used directly; we use rank statistics for stability
Components
• Tri-Anchor Energy: squared distances of price from daily, weekly, monthly AVWAPs, each divided by ATR, then summed and ranked to a percentile over base_len
• Robust Z of Close: median and MAD based Z to avoid outliers
• Shape Gate: position of close inside bar range to require capitulation for longs and exhaustion for shorts
• Breadth Gate: average robust Z of SPY QQQ IWM to avoid fading when the tape is one-sided
• Gap Shock: skip signals after large session gaps
Fusion rule
• All required gates must be true: Energy ≥ energy_trig_prc, |Robust Z| ≥ z_trig, Shape satisfied, Breadth confirmed, Gap filter clear
Signal rule
• Long: energy extreme, Z negative beyond threshold, close near bar low, breadth Z ≤ −breadth_z_ok
• Short: energy extreme, Z positive beyond threshold, close near bar high, breadth Z ≥ +breadth_z_ok
What you will see on the chart
• Standard strategy arrows for entries and exits
• Optional short-side brackets: ATR stop and ATR take profit if enabled
Inputs with guidance
Setup
• Base length: window for percentile ranks and medians. Typical 40 to 80. Longer smooths, shorter reacts.
• ATR length: normalization unit. Typical 10 to 20. Higher reduces noise.
• VWAP band stdev: volatility bands for anchors. Typical 2.0 to 4.0.
• Robust Z window: 40 to 100. Larger for stability.
• Robust Z entry magnitude: 1.2 to 2.2. Higher means stronger extremes only.
• Energy percentile trigger: 90 to 99.5. Higher limits signals to rare stretches.
• Bar close in range gate long: 0.05 to 0.25. Larger requires deeper capitulation for longs.
Regime and Breadth
• Use breadth gate: on when trading indices or broad ETFs.
• Breadth Z confirm magnitude: 0.8 to 1.8. Higher avoids fighting thrusts.
• Gap shock percent: 1.0 to 5.0. Larger allows more gaps to trade.
Risk — Short only
• Enable short SL TP: on to bracket shorts.
• Short ATR stop mult: 1.0 to 3.0.
• Short ATR take profit mult: 1.0 to 6.0.
Properties visible in this publication
• Initial capital: 25000USD
• Default order size: Percent of total equity 3%
• Pyramiding: 0
• Commission: 0.03 percent
• Slippage: 5 ticks
• Process orders on close: OFF
• Bar magnifier: OFF
• Recalculate after order is filled: OFF
• Calc on every tick: OFF
• request.security lookahead off where used
Realism and responsible publication
• No performance claims. Past results never guarantee future outcomes
• Fills and slippage vary by venue
• Shapes can move during bar formation and settle on close
• Standard candles only for strategies
Honest limitations and failure modes
• Economic releases or very thin liquidity can overwhelm mean-reversion logic
• Heavy gap regimes may require larger gap filter or TR-based tuning
• Very quiet regimes reduce signal contrast; extend windows or raise thresholds
Open source reuse and credits
• None
Strategy notice
Orders are simulated by TradingView on standard candles. request.security uses lookahead off where applicable. Non-standard charts are not supported for execution.
Entries and exits
• Entry logic: as in Signal rule above
• Exit logic: short side optional ATR stop and ATR take profit via brackets; long side closes on opposite setup
• Risk model: ATR-based brackets on shorts when enabled
• Tie handling: stop first when both could be touched inside one bar
Dataset and sample size
• Test across your visible history. For robust inference prefer 100 plus trades.

FluxGate Daily Swing StrategySummary in one paragraph
FluxGate treats long and short as different ecosystems. It runs two independent engines so the long side can be bold when the tape rewards upside persistence while the short side can stay selective when downside is messy. The core reads three directional drivers from price geometry then removes overlap before gating with clean path checks. The complementary risk module anchors stop distance to a higher timeframe ATR so a unit means the same thing on SPY and BTC. It can add take profit breakeven and an ATR trail that only activates after the trade earns it. If a stop is hit the strategy can re enter in the same direction on the next bar with a daily retry cap that you control. Add it to a clean chart. Use defaults to see the intended behavior. For conservative workflows evaluate on bar close.
Scope and intent
• Markets. Large cap equities and liquid ETFs major FX pairs US index futures and liquid crypto pairs
• Timeframes. From one minute to daily
• Default demo in this publication. SPY on one day timeframe
• Purpose. Reduce false starts without missing sustained trends by fusing independent drivers and suppressing activity when the path is noisy
• Limits. This is a strategy. Orders are simulated on standard candles. Non standard chart types are not supported for execution
Originality and usefulness
• Unique fusion. FluxGate extracts three drivers that look at price from different angles. Direction measures slope of a smoothed guide and scales by realized volatility so a point of slope does not mean a different thing on different symbols. Persistence looks at short sign agreement to reward series of closes that keep direction. Curvature measures the second difference of a local fit to wake up during convex pushes. These three are then orthonormalized so a strong reading in one does not double count through another.
• Gates that matter. Efficiency ratio prefers direct paths over treadmills. Entropy turns up versus down frequency into an information read. Light fractal cohesion punishes wrinkly paths. Together they slow the system in chop and allow it to open up when the path is clean.
• Separate long and short engines. Threshold tilts adapt to the skew of score excursions. That lets long engage earlier when upside distribution supports it and keeps short cautious where downside surprise and venue frictions are common.
• Practical risk behavior. Stops are ATR anchored on a higher timeframe so the unit is portable. Take profit is expressed in R so two R means the same concept across symbols. Breakeven and trailing only activate after a chosen R so early noise does not squeeze a good entry. Re entry after stop lets the system try again without you babysitting the chart.
• Testability. Every major window and the aggression controls live in Inputs. There is no hidden magic number.
Method overview in plain language
Base measures
• Return basis. Natural log of close over prior close for stability and easy aggregation through time. Realized volatility is the standard deviation of returns over a moving window.
• Range basis for risk. ATR computed on a higher timeframe anchor such as day week or month. That anchor is steady across venues and avoids chasing chart specific quirks.
Components
• Directional intensity. Use an EMA of typical price as a guide. Take the day to day slope as raw direction. Divide by realized volatility to get a unit free measure. Soft clip to keep outliers from dominating.
• Persistence. Encode whether each bar closed up or down. Measure short sign agreement so a string of higher closes scores better than a jittery sequence. This favors push continuity without guessing tops or bottoms.
• Curvature. Fit a short linear regression and compute the second difference of the fitted series. Strong curvature flags acceleration that slope alone may miss.
• Efficiency gate. Compare net move to path length over a gate window. Values near one indicate direct paths. Values near zero indicate treadmill behavior.
• Entropy gate. Convert up versus down frequency into a probability of direction. High entropy means coin toss. The gate narrows there.
• Fractal cohesion. A light read of path wrinkliness relative to span. Lower cohesion reduces the urge to act.
• Phase assist. Map price inside a recent channel to a small signed bias that grows with confidence. This helps entries lean toward the right half of the channel without becoming a breakout rule.
• Shock control. Compare short volatility to long volatility. When short term volatility spikes the shock gate temporarily damps activity so the system waits for pressure to normalize.
Fusion rule
• Normalize the three drivers after removing overlap
• Blend with weights that adapt to your aggression input
• Multiply by the gates to respect path quality
• Smooth just enough to avoid jitter while keeping timing responsive
• Compute an adaptive mean and deviation of the score and set separate long and short thresholds with a small tilt informed by skew sign
• The result is one long score and one short score that can cross their thresholds at different times for the same tape which is a feature not a bug
Signal rule
• A long suggestion appears when the long score crosses above its long threshold while all gates are active
• A short suggestion appears when the short score crosses below its short threshold while all gates are active
• If any required gate is missing the state is wait
• When a position is open the status is in long or in short until the complementary risk engine exits or your entry mode closes and flips
Inputs with guidance
Setup Long
• Base length Long. Master window for the long engine. Typical range twenty four to eighty. Raising it improves selectivity and reduces trade count. Lowering it reacts faster but can increase noise
• Aggression Long. Zero to one. Higher values make thresholds more permissive and shorten smoothing
Setup Short
• Base length Short. Master window for the short engine. Typical range twenty eight to ninety six
• Aggression Short. Zero to one. Lower values keep shorts conservative which is often useful on upward drifting symbols
Entries and UI
• Entry mode. Both or Long only or Short only
Complementary risk engine
• Enable risk engine. Turns on bracket exits while keeping your signal logic untouched
• ATR anchor timeframe. Day Week or Month. This sets the structural unit of stop distance
• ATR length. Default fourteen
• Stop multiple. Default one point five times the anchor ATR
• Use take profit. On by default
• Take profit in R. Default two R
• Breakeven trigger in R. Default one R
Usage recipes
Intraday trend focus
• Entry mode Both
• ATR anchor Week
• Aggression Long zero point five Aggression Short zero point three
• Stop multiple one point five Take profit two R
• Expect fewer trades that stick to directional pushes and skip treadmill noise
Intraday mean reversion focus
• Session windows optional if you add them in your copy
• ATR anchor Day
• Lower aggression both sides
• Breakeven later and trailing later so the first bounce has room
• This favors fade entries that still convert into trends when the path stays clean
Swing continuation
• Signal timeframe four hours or one day
• Confirm timeframe one day if you choose to include bias
• ATR anchor Week or Month
• Larger base windows and a steady two R target
• This accepts fewer entries and aims for larger holds
Properties visible in this publication
• Initial capital 25.000
• Base currency USD
• Default order size percent of equity value three - 3% of the total capital
• Pyramiding zero
• Commission zero point zero three percent - 0.03% of total capital
• Slippage five ticks
• Process orders on close off
• Recalculate after order is filled off
• Calc on every tick off
• Bar magnifier off
• Any request security calls use lookahead off everywhere
Realism and responsible publication
• No performance promises. Past results never guarantee future outcomes
• Fills and slippage vary by venue and feed
• Strategies run on standard candles only
• Shapes can update while a bar is forming and settle on close
• Keep risk per trade sensible. Around one percent is typical for study. Above five to ten percent is rarely sustainable
Honest limitations and failure modes
• Sudden news and thin liquidity can break assumptions behind entropy and cohesion reads
• Gap heavy symbols often behave better with a True Range basis for risk than a simple range
• Very quiet regimes can reduce score contrast. Consider longer windows or higher thresholds when markets sleep
• Session windows follow the exchange time of the chart if you add them
• If stop and target can both be inside a single bar this strategy prefers stop first to keep accounting conservative
Open source reuse and credits
• No reused open source beyond public domain building blocks such as ATR EMA and linear regression concepts
Legal
Education and research only. Not investment advice. You are responsible for your decisions. Test on history and in simulation with realistic costs

ProbRSI Adaptive SPY and QQQ Swing One Hour Strategy Summary in one paragraph
A probabilistic RSI engine for large cap ETFs and index names on intraday and swing timeframes. It converts ATR scaled returns into a 0 to 100 probability line, adapts its smoothing from path efficiency, and gates flips with simple percent levels. It is original because it fuses three pieces that traders rarely combine in one signal line: ATR normalized return probability, curvature compression, and per bar adaptive EMA. Add it to a clean chart, keep the default one hour signal on QQQ, and read the entry and exit markers generated by the strategy. For conservative alerts select on bar close.
Scope and intent
• Markets. Major ETFs and large cap equities. Index futures. Liquid crypto. Major FX pairs
• Timeframes. One minute to daily. Defaults to one hour for swing pace
• Default demo used in this publication. SPY/QQQ on one hour
• Purpose. Reduce false flips by adapting to path efficiency and by gating long and short separately
• Limits. This is a strategy. Orders are simulated on standard candles only
Originality and usefulness
• Unique fusion. Logistic probability of ATR scaled returns with arcsine pre transform, optional curvature compression, and per bar adaptive EMA steered by an efficiency ratio
• Failure mode addressed. Fast whips in congestion and late entries after spikes
• Testability. Each component has a named input and can be tuned directly. Entry names Long and Short are visible in the list of trades
• Portable yardstick. ATR scaled return is a common unit across symbols and venues
• Protected rationale. The code stays protected to preserve implementation details of the adaptive engine and curvature assist while the method and usage are fully explained here for community review
Method overview in plain language
You convert raw returns into a probability scale, adapt the smoothing to the straightness of the path, and only allow flips when a simple gate is satisfied. The probability line crosses its own EMA to generate signals. When the cross happens below a short gate or above a long gate, the flip is allowed. Otherwise it is ignored.
Base measures
• Return basis. Close minus prior close normalized by ATR, then arcsine to damp large steps. ATR window is set by ATR length. Sensitivity is adjusted by an ATR scale input
• Probability map. A logistic function maps the normalized return to 0 to 1 which becomes 0 to 100 after scaling
Components
• Probability core. Logistic probability of ATR scaled returns. Higher values imply upside pressure. Smoothed by an adaptive EMA
• Curvature assist optional. A curvature proxy compresses extreme spikes toward neutral. Useful after news bars. Weight controls strength
• Efficiency ratio. A path efficiency score from 0 to 1 extends the smoothing length during noisy paths and shortens it during directional paths
• Signal line. An EMA of the probability line creates the reference for cross up and cross down
• Gates. Two simple percent levels define when long and short flips are allowed
Fusion rule
• The adaptive EMA length is computed as a linear map between a minimum and a maximum bound based on one minus efficiency
• If curvature assist is enabled the probability is adjusted by a small counter spike term
• Final probability is compared to its EMA
Signal rule
• Long. A long entry is suggested when probability crosses above the signal line and the current probability is above the Long gate level
• Short. A short entry is suggested when probability crosses below the signal line and the current probability is below the Short gate level
• Exit and flip. When an opposite entry condition appears the current position is closed and a new position opens in the opposite direction
What you will see on the chart
• Strategy markers on suggestion bars. Orders named Long and Short
• Exit marker when the opposite signal closes the open side
• No table by design. All tuning lives in Inputs for a clean chart
Inputs with guidance
Market TF
• Symbol. Series used for oscillator computation. Use the instrument you trade or a close proxy
• Signal timeframe. Timeframe where the oscillator is evaluated. Leave blank to follow the chart
Core
• Price source. Series used for returns. Typical choice close
• Base length. Fallback EMA length used when adaptation is off. Typical range 20 to 200. Larger smooths more
• ATR length. Window for ATR that scales returns. Typical range 10 to 30. Larger normalizes more and lowers sensitivity
• Logit sharpness. Steepness of the logistic link. Typical range 1 to 8. Raising it reacts more to the same input
• ATR scale. Extra divisor on ATR. Typical range 0.5 to 2. Smaller is more sensitive
• Signal length. EMA of the probability line. Typical range 5 to 20. Larger gives fewer flips
• Long gate. Allow long flips only above this level. Typical range 20 to 40
• Short gate. Allow short flips only below this level. Typical range 20 to 40
Adaptive
• Adaptive smoothing. If on, the efficiency ratio controls the per bar EMA length
• Min effective length. Lower bound of adaptive EMA. Typical range 5 to 50
• Max effective length. Upper bound of adaptive EMA. Typical range 50 to 300
• Efficiency window. Window for efficiency ratio. Typical range 30 to 100
Shape Assist
• Curvature influence. If on, extreme spikes are nudged toward neutral
• Curvature weight. Strength of compression. Typical range 0.1 to 0.3
Properties visible in this publication
• Initial capital. 25000
• Base currency. USD
• request.security lookahead off everywhere
• Commission. 0.03 percent
• Slippage. 5 ticks
• Default order size method percent of equity with value 3 for realistic testing
• Pyramiding 0
• Process orders on close ON
• Bar magnifier OFF
• Recalculate after order is filled OFF
• Calc on every tick OFF
Realism and responsible publication
• No performance claims. Past results never guarantee future outcomes
• Shapes can move while a bar forms and settle on close
• Strategies use standard candles for signals and orders only
Honest limitations and failure modes
• Economic releases and thin liquidity can break assumptions behind the curvature assist
• Gap heavy symbols may prefer a longer ATR window
• Very quiet regimes can reduce signal contrast. Consider higher gates or longer signal length
• Session time follows the exchange of the chart and can change symbol to symbol
• Symbol sensitivity is expected. Use the gates and length inputs to find stable settings
• Past results never guarantee future outcomes
Open source reuse and credits
• None
Mode
Public protected. Source is hidden while access is free. Implementation detail remains private. Method and use are fully disclosed here
Legal
Education and research only. Not investment advice. You are responsible for your decisions. Test on historical data and in simulation before any live use. Use realistic costs.

Moving Average Trend Strategy V4.1 — Revised Version (Selectable✅ **Version Notes (V4.0)**
| Feature | Description |
| --------------------------------------- | -------------------------------------------------------- |
| 🧠 **Moving Average Type Options** | Choose from EMA / SMA / HMA / WMA |
| 🧱 **Take-Profit / Stop-Loss Switches** | Can be enabled or disabled independently |
| ⚙️ **Add Position Function** | Can be enabled or disabled independently |
| 🔁 **Add Position Signal Source** | Selectable between MA Crossover / MACD / RCI / RSI |
| 💹 **Adjustable Parameters** | All periods and percentages are customizable in settings |
---
✅ **Update Summary:**
| Function | Description |
| -------------------------------------- | --------------------------------------------------------------------- |
| **MA Type Selection** | Choose EMA / SMA / HMA / WMA in chart settings |
| **Take-Profit / Stop-Loss Percentage** | Configurable in the “Take-Profit & Stop-Loss” group |
| **Add / Reduce Position Percentage** | Adjustable separately in the “Add/Reduce Position” group |
| **MA Periods** | Customizable in the “Moving Average Parameters” section |
| **Code Structure** | Logic unchanged — only parameterization and selection functions added |
---
### **Strategy Recommendations:**
* **Trending Market:** Prefer EMA trend tracking or SAR indicators
* **Range-Bound Market:** Use ATR-based volatility stop-loss
* **Before Major Events:** Consider option hedging
* **Algorithmic Trading:** Recommend ATR + partial take-profit combination strategy
---
### **Key Parameter Optimization Logic:**
* Backtest different **ATR multipliers** (2–3× ATR)
* Test **EMA periods** (10–50 periods)
* Optimize **partial take-profit ratios**
* Adjust **maximum drawdown tolerance** (typically 30–50% of profit)
---
### **Risk Control Tips:**
* Avoid overly tight stop-losses that trigger too frequently
* During strong trends, consider widening take-profit targets
* Confirm trend continuation with **volume analysis**
* Adjust parameters based on **timeframe** (e.g., Daily vs Hourly)
---
### **Practical Example (Forex: EUR/USD):**
* **Entry:** Go long on breakout above 1.1200
* **Initial Stop-Loss:** 1.1150 (50 pips)
* **When profit reaches 1.1300:**
* Close 50% of position
* Move stop-loss to 1.1250 (lock in 50 pips profit)
* **When price rises to 1.1350:**
* Move stop-loss to 1.1300 (lock in 100 pips profit)
* **Final Outcome:**
* Price retraces to 1.1300, triggering take-profit
This method secured over **80% of trend profits** during the 2023 EUR rebound, capturing **23% more profit** compared to fixed take-profit strategies (based on backtest results).
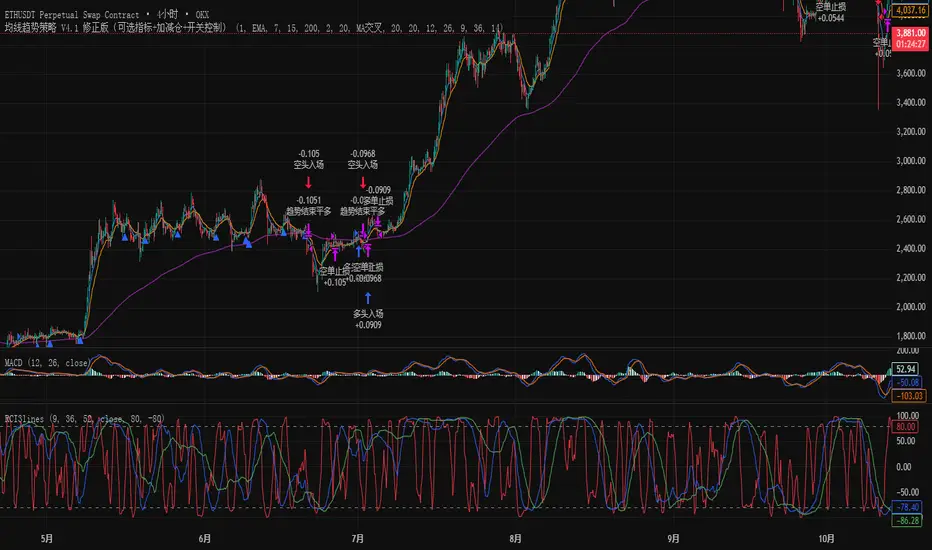
Quantum Flux Universal Strategy Summary in one paragraph
Quantum Flux Universal is a regime switching strategy for stocks, ETFs, index futures, major FX pairs, and liquid crypto on intraday and swing timeframes. It helps you act only when the normalized core signal and its guide agree on direction. It is original because the engine fuses three adaptive drivers into the smoothing gains itself. Directional intensity is measured with binary entropy, path efficiency shapes trend quality, and a volatility squash preserves contrast. Add it to a clean chart, watch the polarity lane and background, and trade from positive or negative alignment. For conservative workflows use on bar close in the alert settings when you add alerts in a later version.
Scope and intent
• Markets. Large cap equities and ETFs. Index futures. Major FX pairs. Liquid crypto
• Timeframes. One minute to daily
• Default demo used in the publication. QQQ on one hour
• Purpose. Provide a robust and portable way to detect when momentum and confirmation align, while dampening chop and preserving turns
• Limits. This is a strategy. Orders are simulated on standard candles only
Originality and usefulness
• Unique concept or fusion. The novelty sits in the gain map. Instead of gating separate indicators, the model mixes three drivers into the adaptive gains that power two one pole filters. Directional entropy measures how one sided recent movement has been. Kaufman style path efficiency scores how direct the path has been. A volatility squash stabilizes step size. The drivers are blended into the gains with visible inputs for strength, windows, and clamps.
• What failure mode it addresses. False starts in chop and whipsaw after fast spikes. Efficiency and the squash reduce over reaction in noise.
• Testability. Every component has an input. You can lengthen or shorten each window and change the normalization mode. The polarity plot and background provide a direct readout of state.
• Portable yardstick. The core is normalized with three options. Z score, percent rank mapped to a symmetric range, and MAD based Z score. Clamp bounds define the effective unit so context transfers across symbols.
Method overview in plain language
The strategy computes two smoothed tracks from the chart price source. The fast track and the slow track use gains that are not fixed. Each gain is modulated by three drivers. A driver for directional intensity, a driver for path efficiency, and a driver for volatility. The difference between the fast and the slow tracks forms the raw flux. A small phase assist reduces lag by subtracting a portion of the delayed value. The flux is then normalized. A guide line is an EMA of a small lead on the flux. When the flux and its guide are both above zero, the polarity is positive. When both are below zero, the polarity is negative. Polarity changes create the trade direction.
Base measures
• Return basis. The step is the change in the chosen price source. Its absolute value feeds the volatility estimate. Mean absolute step over the window gives a stable scale.
• Efficiency basis. The ratio of net move to the sum of absolute step over the window gives a value between zero and one. High values mean trend quality. Low values mean chop.
• Intensity basis. The fraction of up moves over the window plugs into binary entropy. Intensity is one minus entropy, which maps to zero in uncertainty and one in very one sided moves.
Components
• Directional Intensity. Measures how one sided recent bars have been. Smoothed with RMA. More intensity increases the gain and makes the fast and slow tracks react sooner.
• Path Efficiency. Measures the straightness of the price path. A gamma input shapes the curve so you can make trend quality count more or less. Higher efficiency lifts the gain in clean trends.
• Volatility Squash. Normalizes the absolute step with Z score then pushes it through an arctangent squash. This caps the effect of spikes so they do not dominate the response.
• Normalizer. Three modes. Z score for familiar units, percent rank for a robust monotone map to a symmetric range, and MAD based Z for outlier resistance.
• Guide Line. EMA of the flux with a small lead term that counteracts lag without heavy overshoot.
Fusion rule
• Weighted sum of the three drivers with fixed weights visible in the code comments. Intensity has fifty percent weight. Efficiency thirty percent. Volatility twenty percent.
• The blend power input scales the driver mix. Zero means fixed spans. One means full driver control.
• Minimum and maximum gain clamps bound the adaptive gain. This protects stability in quiet or violent regimes.
Signal rule
• Long suggestion appears when flux and guide are both above zero. That sets polarity to plus one.
• Short suggestion appears when flux and guide are both below zero. That sets polarity to minus one.
• When polarity flips from plus to minus, the strategy closes any long and enters a short.
• When flux crosses above the guide, the strategy closes any short.
What you will see on the chart
• White polarity plot around the zero line
• A dotted reference line at zero named Zen
• Green background tint for positive polarity and red background tint for negative polarity
• Strategy long and short markers placed by the TradingView engine at entry and at close conditions
• No table in this version to keep the visual clean and portable
Inputs with guidance
Setup
• Price source. Default ohlc4. Stable for noisy symbols.
• Fast span. Typical range 6 to 24. Raising it slows the fast track and can reduce churn. Lowering it makes entries more reactive.
• Slow span. Typical range 20 to 60. Raising it lengthens the baseline horizon. Lowering it brings the slow track closer to price.
Logic
• Guide span. Typical range 4 to 12. A small guide smooths without eating turns.
• Blend power. Typical range 0.25 to 0.85. Raising it lets the drivers modulate gains more. Lowering it pushes behavior toward fixed EMA style smoothing.
• Vol window. Typical range 20 to 80. Larger values calm the volatility driver. Smaller values adapt faster in intraday work.
• Efficiency window. Typical range 10 to 60. Larger values focus on smoother trends. Smaller values react faster but accept more noise.
• Efficiency gamma. Typical range 0.8 to 2.0. Above one increases contrast between clean trends and chop. Below one flattens the curve.
• Min alpha multiplier. Typical range 0.30 to 0.80. Lower values increase smoothing when the mix is weak.
• Max alpha multiplier. Typical range 1.2 to 3.0. Higher values shorten smoothing when the mix is strong.
• Normalization window. Typical range 100 to 300. Larger values reduce drift in the baseline.
• Normalization mode. Z score, percent rank, or MAD Z. Use MAD Z for outlier heavy symbols.
• Clamp level. Typical range 2.0 to 4.0. Lower clamps reduce the influence of extreme runs.
Filters
• Efficiency filter is implicit in the gain map. Raising efficiency gamma and the efficiency window increases the preference for clean trends.
• Micro versus macro relation is handled by the fast and slow spans. Increase separation for swing, reduce for scalping.
• Location filter is not included in v1.0. If you need distance gates from a reference such as VWAP or a moving mean, add them before publication of a new version.
Alerts
• This version does not include alertcondition lines to keep the core minimal. If you prefer alerts, add names Long Polarity Up, Short Polarity Down, Exit Short on Flux Cross Up in a later version and select on bar close for conservative workflows.
Strategy has been currently adapted for the QQQ asset with 30/60min timeframe.
For other assets may require new optimization
Properties visible in this publication
• Initial capital 25000
• Base currency Default
• Default order size method percent of equity with value 5
• Pyramiding 1
• Commission 0.05 percent
• Slippage 10 ticks
• Process orders on close ON
• Bar magnifier ON
• Recalculate after order is filled OFF
• Calc on every tick OFF
Honest limitations and failure modes
• Past results do not guarantee future outcomes
• Economic releases, circuit breakers, and thin books can break the assumptions behind intensity and efficiency
• Gap heavy symbols may benefit from the MAD Z normalization
• Very quiet regimes can reduce signal contrast. Use longer windows or higher guide span to stabilize context
• Session time is the exchange time of the chart
• If both stop and target can be hit in one bar, tie handling would matter. This strategy has no fixed stops or targets. It uses polarity flips for exits. If you add stops later, declare the preference
Open source reuse and credits
• None beyond public domain building blocks and Pine built ins such as EMA, SMA, standard deviation, RMA, and percent rank
• Method and fusion are original in construction and disclosure
Legal
Education and research only. Not investment advice. You are responsible for your decisions. Test on historical data and in simulation before any live use. Use realistic costs.
Strategy add on block
Strategy notice
Orders are simulated by the TradingView engine on standard candles. No request.security() calls are used.
Entries and exits
• Entry logic. Enter long when both the normalized flux and its guide line are above zero. Enter short when both are below zero
• Exit logic. When polarity flips from plus to minus, close any long and open a short. When the flux crosses above the guide line, close any short
• Risk model. No initial stop or target in v1.0. The model is a regime flipper. You can add a stop or trail in later versions if needed
• Tie handling. Not applicable in this version because there are no fixed stops or targets
Position sizing
• Percent of equity in the Properties panel. Five percent is the default for examples. Risk per trade should not exceed five to ten percent of equity. One to two percent is a common choice
Properties used on the published chart
• Initial capital 25000
• Base currency Default
• Default order size percent of equity with value 5
• Pyramiding 1
• Commission 0.05 percent
• Slippage 10 ticks
• Process orders on close ON
• Bar magnifier ON
• Recalculate after order is filled OFF
• Calc on every tick OFF
Dataset and sample size
• Test window Jan 2, 2014 to Oct 16, 2025 on QQQ one hour
• Trade count in sample 324 on the example chart
Release notes template for future updates
Version 1.1.
• Add alertcondition lines for long, short, and exit short
• Add optional table with component readouts
• Add optional stop model with a distance unit expressed as ATR or a percent of price
Notes. Backward compatibility Yes. Inputs migrated Yes.
