Search in scripts for "band"
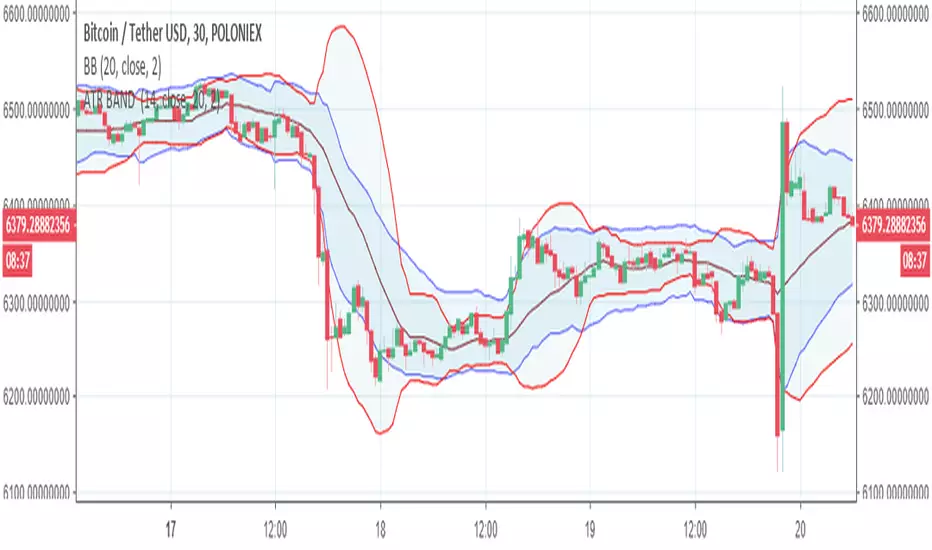
Average True Range Overlay - BandPlots a band of width 1 ATR around the midpoint (HL2)
Settings:
- Length of ATR
Indicator: Price Headley Accelaration Bands [LazyBear]The Acceleration Band System was published in "Big Trends in Trading" by Price Headley in 2002. The system designed to catch stocks as they start to trend but before they go parabolic. The system is simple but supposed to be very effective.
This system makes use of %R and ADX a lot to determine the entries/exits. Refer to the documents listed below for the complete set of rules.
More info:
* System Trading Rules: drive.google.com
* www.bigtrends.com
* www.slideshare.net

Relative Strength Index w/ STARC Bands and PivotsThis is an old script that I use with some useful RSI strategies from "Technical Analysis for the Trading Professional" 2nd edition by Constance Brown.
The base RSI comes with the option for custom length, and has some pre-configured ranges for looking at exits and entrances. The idea is to be bullish when bounces happen in the red zone during an already bullish trend or when the indicator enters green without a rejection. Be bearish if the indicator falls through the red zone or fails to enter green during an already bearish trend.
I have added the formulas used for creating STARC bands (just think fancier volatility bands) with adjustable tolerances. The idea is to look out for when the RSI touches one of the bands and reverses. This is usually indicative of a strong reversal (though the timing will be up to the trader). Best use this on shorter time frames during a volatile time of a stock's price action.
Although a little messy, there is a small segment of the script which includes pivot points. I like to use these because they make indicating local highs/lows for finding divergences easier.
Finally, I have added a couple of customizable EMAS for the RSI itself. Useful when combined with the other features!

Power Of Stocks - Bollinger Band & 5Ema Indicator - Keanu_RiTz
Power of Stocks - Bollinger band & 5ema Strategy
In this script you get to take Buy/Sell trades using the 3 options mentioned below.(Alerts with price levels for buy/sell at , SL & Target are included in this one)
1. Combined Strategy :- uses confirmation from both strategies to trade.
2. Bollinger band Strategy :- use the Bollinger band Strategy to trade.
3. 5ema Strategy :- use the 5ema Strategy to trade.
1. Combined Strategy :-
for Selling :- we will go short/sell only when conditions of both strategies are satisfied.
i.e. when a candle is completely above the upper Bollinger band & completely above the 5ema then it will be our Alert Candle.
We Short/Sell only when the low of the Alert candle is broken or when the candle closes below the close of the Alert Candle.
SL will be above high of the Alert Candle. Target will be minimum 1:3 or as per your emotions.
for Buying:- we will go Long/Buy only when conditions of both strategies are satisfied.
i.e. when a candle is completely below the lower Bollinger band & completely below the 5ema then it will be our Alert Candle.
We go Long/Buy only when the high of the Alert candle is broken or when the candle closes above the close of the Alert Candle.
SL will be below low of the Alert Candle. Target will be minimum 1:3 or as per your emotions.
2. Power of Stocks - Bollinger Band Strategy :-
Bollinger band with standard deviation = 1.5
when a candle is completely above the upper Bollinger band, that candle will be called a signal/alert candle.
Initiate a Sell trade when that alert candles low is broken. SL will be above high of that alert candle.
Risk to reward ratio will be 1:4 i.e. target will be 4 times the SL.
when a candle is completely below the lower Bollinger band, that candle will be called a signal/alert candle.
Initiate a Buy trade when that alert candles high is broken. SL will be below low of that alert candle.
Risk to reward ratio will be 1:4 i.e. target will be 4 times the SL.
other rules for Options buying:- minimum 15min timeframe
The day you initiate the position , you should be in profit above 10%-15% then only you should carry forward that position overnight, otherwise squareoff your trade on that day only.
Buy ATM or slightly OTM, SL max 100 points , target 1:4
for Long-term/Investing :- Minimum Weekly
If candle is outside the lower band then initiate a Buy trade when that candles High is broken. Sl will be below Low of that candle.
for Long-term Target will be according to your emotions.
3. Power of Stocks - 5ema Strategy (target minimum 1:3)
Timeframe -
5 min for Selling (Sell Futures/index/stocks or buy Put)
15 min for Buying (Buy Futures/index/stocks or sell Put)
for selling stocks :-
you should enter trade within 10am , don't look for entries after that time. take only 2 entries a day.
for selling Index(Banknifty) :-
you can take trade at anytime of the day whenever conditions get satisfied. you can take multiple entries in banknifty as it is very volatile.
for options choose atm strikes: selling trade
sl for premium between 200-300 :- 20-30 points SL
sl for premium between 400-500 :- 40-50 points SL
sl for premium between 500-600 :- 50-60 points SL
Subhashish Pani's (power of stocks) 5 EMA Strategy:-
It plots 5 EMA and Buy/Sell signals with Target & Stoploss levels.
What is Subhashish Pani's (power of stocks) 5 EMA Strategy :-
His strategy is very simple to understand. for intraday use 5 minutes timeframe for selling. You can sell futures, sell call or buy Puts in selling strategy.
What this strategy tries to do is , it tries to catch the tops, so when you sell at top & it turns out to be a reversal point then you can get good profit.
this will hit stop losses often, but stop losses are small and minimum target should be 1:3. but if you stay with the trend you can get big profits.
According to Subhashish Pani this strategy has 60% success rate.
Strategy for Selling (Short future/Call/stock or buy Put)
When ever a Candle closes completely above 5 ema (no part of candle should be touching the 5ema), then that candle should be considered as Alert Candle.
If the next candle is also completely above 5 ema and it has not broken the low of previous alert candle, Then the previous Alert Candle should be ignored and the new candle should be considered as new Alert Candle.
so if this goes on then continue shifting the Alert Candle, but whenever the next candle breaks the low of the Alert Candle we should take the Short trade (Short future/Call/stock or buy Put).
Stoploss will be above high of the Alert Candle and minimum target will be 1:3.
Strategy for Buying (Buy future/Call/stock or sell Put)
When ever a Candle closes completely below 5 ema (no part of candle should be touching the 5ema), then that candle should be considered as Alert Candle.
If the next candle is also completely below 5 ema and it has not broken the high of previous alert candle, Then the previous Alert Candle should be ignored and the new candle should be considered as new Alert Candle.
so if this goes on then continue shifting the Alert Candle, but whenever the next candle breaks the high of the Alert Candle we should take the Long trade (Buy future/Call/stock or sell Put).
Stoploss will be below low of the Alert Candle and minimum target will be 1:3.
Buy/Sell with extra conditions :
it just adds 1 more condition to buying/selling
1. checks if closing of current candle is lower than alert candles closing for Selling & checks if closing of current candle is higher than alert candles closing for Buyling.
This can sometimes save you from false moves but by using this, you can also miss out on big moves as you'll enter trade after candle closing instead of entering at break of high/low.
Note :- According to Subhashish Pani Timeframe for intraday buying should be 15 minutes Timeframe.
If you haven't understood the strategy by reading above description, then search for "Subhashish Pani's (power of stocks) 5 EMA Strategy" on YouTube to get a deeper understanding.
Note:- This is not only for Intraday trading , you can use this strategy for Positional/Swing trading as well. If you use this on Monthly Timeframe then it can be very good for Long Term Investing as well.
Rules will be same for all types of trades & Timeframes.

Flat Detect By Bollinger BandsThis simple script indicate the potential flat market zones, calculated based on the Bollinger Bands width.
It's showing the Bollinger Bands in red when the market is detected as flat.
You can adjust the Width Threshold with precision on the inputs settings.
Enjoy :)

34 EMA BandsThis is quite a simple script, just plotting a 34EMA on high's and low's of candles. Appears to work wonders though, so here it is.
There is some //'d code which I haven't finished working on, but it looks to be quite similar to Bollinger Bands, just using different math rather than standard deviations from the mean.
The bands itself is pretty self explanatory, price likes to use it as resistance when under it, it can trade inside it and it can use the upper EMA as support when in a strong upward trend.

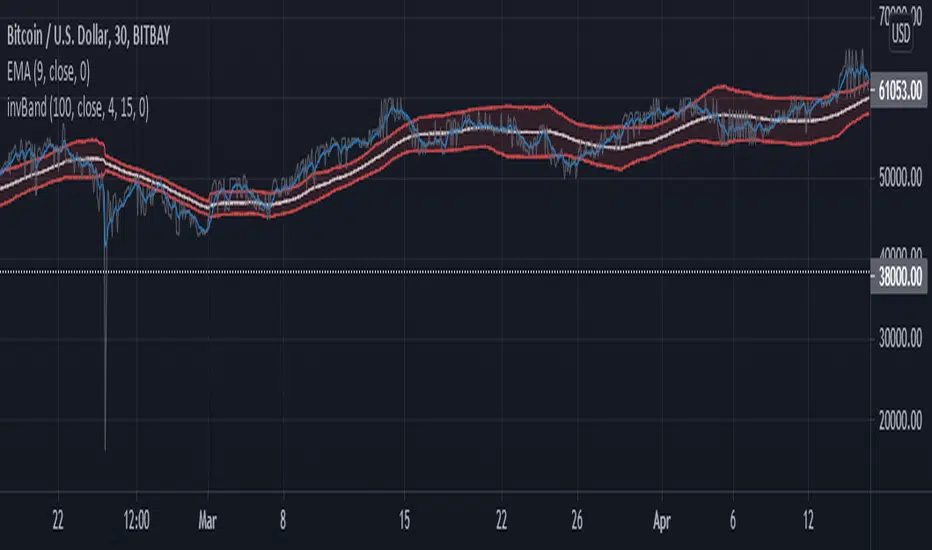
Inverse BandsI'm very new to trading. I've been toying with moving averages to trigger swing trades and wanted an indicator that would swell when price moves sideways and squeeze when price is trending.
So this is the inverse of the popular Bollinger Bands indicator. It makes a very easy identifier for price breakout when paired with your favorite fast moving average. When MA falls outside the bands, it indicates an emerging trend. Still requires some curve fitting, but it is a work in progress.
I hope this isn't a direct copy of something I am not aware of.
Combo Backtest 123 Reversal & Fractal Chaos Bands This is combo strategies for get a cumulative signal.
First strategy
This System was created from the Book "How I Tripled My Money In The
Futures Market" by Ulf Jensen, Page 183. This is reverse type of strategies.
The strategy buys at market, if close price is higher than the previous close
during 2 days and the meaning of 9-days Stochastic Slow Oscillator is lower than 50.
The strategy sells at market, if close price is lower than the previous close price
during 2 days and the meaning of 9-days Stochastic Fast Oscillator is higher than 50.
Second strategy
Stock market moves in a highly chaotic way, but at a larger scale, the movements
follow a certain pattern that can be applied to shorter or longer periods of time
and we can use Fractal Chaos Bands Indicator to identify those patterns. Basically,
the Fractal Chaos Bands Indicator helps us to identify whether the stock market is
trending or not. When a market is trending, the bands will have a slope and if market
is not trending the bands will flatten out. As the slope of the bands decreases, it
signifies that the market is choppy, insecure and variable. As the graph becomes more
and more abrupt, be it going up or down, the significance is that the market becomes
trendy, or stable. Fractal Chaos Bands Indicator is used similarly to other bands-indicator
(Bollinger bands for instance), offering trading opportunities when price moves above or
under the fractal lines.
The FCB indicator looks back in time depending on the number of time periods trader selected
to plot the indicator. The upper fractal line is made by plotting stock price highs and the
lower fractal line is made by plotting stock price lows. Essentially, the Fractal Chaos Bands
show an overall panorama of the price movement, as they filter out the insignificant fluctuations
of the stock price.
WARNING:
- For purpose educate only
- This script to change bars colors.

Combo Strategy 123 Reversal & Fractal Chaos Bands This is combo strategies for get a cumulative signal.
First strategy
This System was created from the Book "How I Tripled My Money In The
Futures Market" by Ulf Jensen, Page 183. This is reverse type of strategies.
The strategy buys at market, if close price is higher than the previous close
during 2 days and the meaning of 9-days Stochastic Slow Oscillator is lower than 50.
The strategy sells at market, if close price is lower than the previous close price
during 2 days and the meaning of 9-days Stochastic Fast Oscillator is higher than 50.
Second strategy
Stock market moves in a highly chaotic way, but at a larger scale, the movements
follow a certain pattern that can be applied to shorter or longer periods of time
and we can use Fractal Chaos Bands Indicator to identify those patterns. Basically,
the Fractal Chaos Bands Indicator helps us to identify whether the stock market is
trending or not. When a market is trending, the bands will have a slope and if market
is not trending the bands will flatten out. As the slope of the bands decreases, it
signifies that the market is choppy, insecure and variable. As the graph becomes more
and more abrupt, be it going up or down, the significance is that the market becomes
trendy, or stable. Fractal Chaos Bands Indicator is used similarly to other bands-indicator
(Bollinger bands for instance), offering trading opportunities when price moves above or
under the fractal lines.
The FCB indicator looks back in time depending on the number of time periods trader selected
to plot the indicator. The upper fractal line is made by plotting stock price highs and the
lower fractal line is made by plotting stock price lows. Essentially, the Fractal Chaos Bands
show an overall panorama of the price movement, as they filter out the insignificant fluctuations
of the stock price.
WARNING:
- For purpose educate only
- This script to change bars colors.

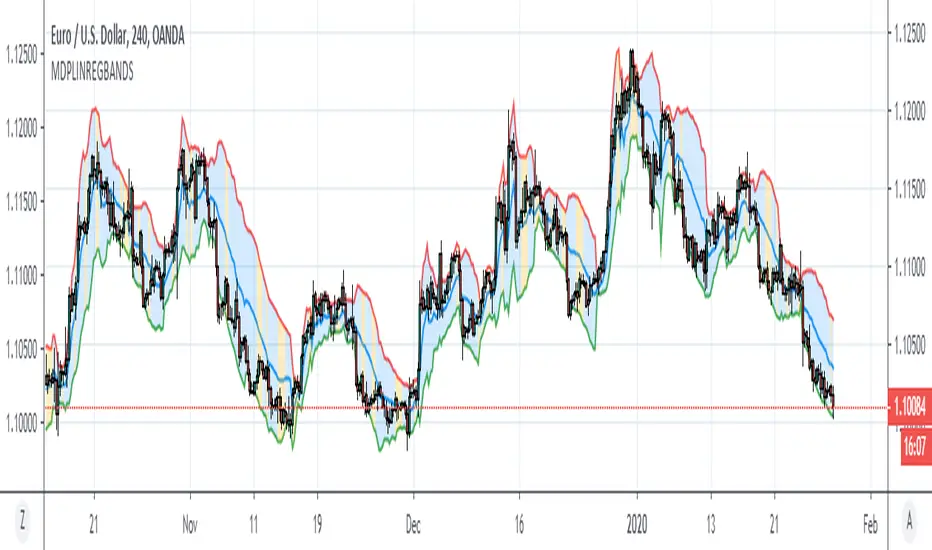
Minkowski Distance Period Linear Regression BandsHello, this script was created by using Linear Regression Bands Function with variable Function Minkowski Distance Adaptive Period.
Function Linear Regression Bands :
Minkowski Distance Function Original Script by RicardoSantos :
Functions saved from overloads . And suitable for mutable variable periods.
Regards.
Ehlers Fractal Adaptive Moving Average with Bands [Bitcoinduke]FRAMA – What is it?
Fractal Adaptive Moving Average Technical Indicator ( FRAMA ) was developed by John Ehlers, code was implemented by TradingView user Shizaru. I've updated it to Pine Script 4 and added Bands Extension.
This indicator is constructed based on the algorithm of the Exponential Moving Average , in which the smoothing factor is calculated based on the current fractal dimension of the price series.
Advantages:
possibility to follow strong trend movements
determine moments of price consolidation ( FRAMA sufficiently slow down at these moments)
FRAMA + Bands
The FRAMA serves as a base for the Upper and Lower Bands which are used as a way to measure volatility by observing the relationship between the Bands and price. Typically the Upper and Lower Bands are set to two standard deviations away from the FRAMA ; however it should be adjusted depending on the task.

Variable Index Dynamic Average (VIDYA) BandsThis adds volatility bands to the Variable Index Dynamic Average (VIDYA). The bands are calculated using the exponential moving average of the standard deviation of the VIDYA.
Thanks to everget for programming the VIDYA for tradingview.

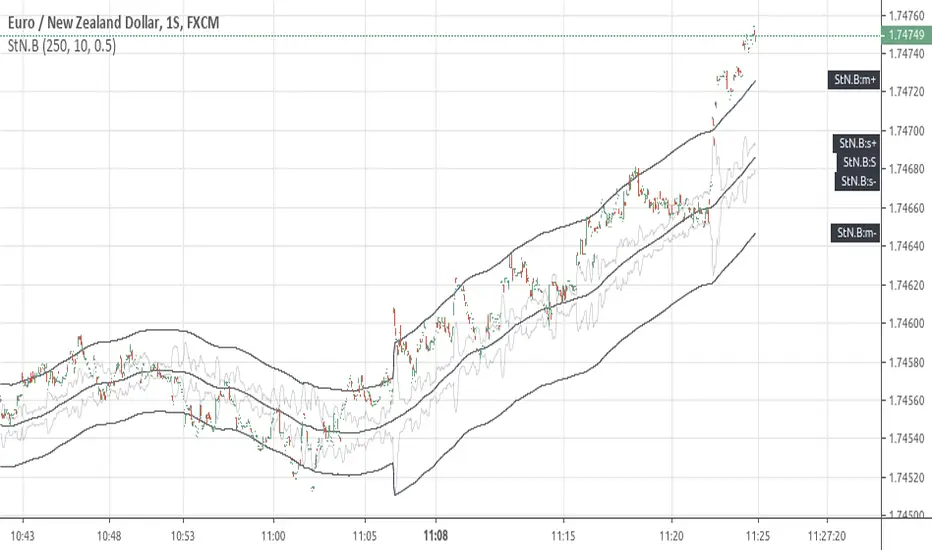
[RS]Signal to Noise BandsEXPERIMENTAL:
Bands using Signal to Noise Calculation.
The bands calculation is similar to bolingers in the aspect that both use standard deviation.

Interquartile Range BandsInterquartile Range Bands script.
This indicator was originally developed by Alex Orekhov at his home.
The idea based on the interquartile range en.wikipedia.org
If price breaks out from the bands then it is `outlier` price.
After breakouts price always returns to its median.
Watch squeeze/expansion periods.
Anyway use it as a supplement to the other indicators.
I will glad to get your feedback.

RSI Heat Bands [River]This script combines LazyBear's RSI Bands with JayRoger's Bollinger Heat Bands, to give an on chart representation of the price needed to set RSI to each major level, from 20 to 80 (higher values created massive bands).

Fractal Chaos Bands Strategy Stock market moves in a highly chaotic way, but at a larger scale, the movements
follow a certain pattern that can be applied to shorter or longer periods of time
and we can use Fractal Chaos Bands Indicator to identify those patterns. Basically,
the Fractal Chaos Bands Indicator helps us to identify whether the stock market is
trending or not. When a market is trending, the bands will have a slope and if market
is not trending the bands will flatten out. As the slope of the bands decreases, it
signifies that the market is choppy, insecure and variable. As the graph becomes more
and more abrupt, be it going up or down, the significance is that the market becomes
trendy, or stable. Fractal Chaos Bands Indicator is used similarly to other bands-indicator
(Bollinger bands for instance), offering trading opportunities when price moves above or
under the fractal lines.
The FCB indicator looks back in time depending on the number of time periods trader selected
to plot the indicator. The upper fractal line is made by plotting stock price highs and the
lower fractal line is made by plotting stock price lows. Essentially, the Fractal Chaos Bands
show an overall panorama of the price movement, as they filter out the insignificant fluctuations
of the stock price.
WARNING:
- This script to change bars colors.

Fractal Chaos Bands Stock market moves in a highly chaotic way, but at a larger scale, the movements
follow a certain pattern that can be applied to shorter or longer periods of time
and we can use Fractal Chaos Bands Indicator to identify those patterns. Basically,
the Fractal Chaos Bands Indicator helps us to identify whether the stock market is
trending or not. When a market is trending, the bands will have a slope and if market
is not trending the bands will flatten out. As the slope of the bands decreases, it
signifies that the market is choppy, insecure and variable. As the graph becomes more
and more abrupt, be it going up or down, the significance is that the market becomes
trendy, or stable. Fractal Chaos Bands Indicator is used similarly to other bands-indicator
(Bollinger bands for instance), offering trading opportunities when price moves above or
under the fractal lines.
The FCB indicator looks back in time depending on the number of time periods trader selected
to plot the indicator. The upper fractal line is made by plotting stock price highs and the
lower fractal line is made by plotting stock price lows. Essentially, the Fractal Chaos Bands
show an overall panorama of the price movement, as they filter out the insignificant fluctuations
of the stock price.

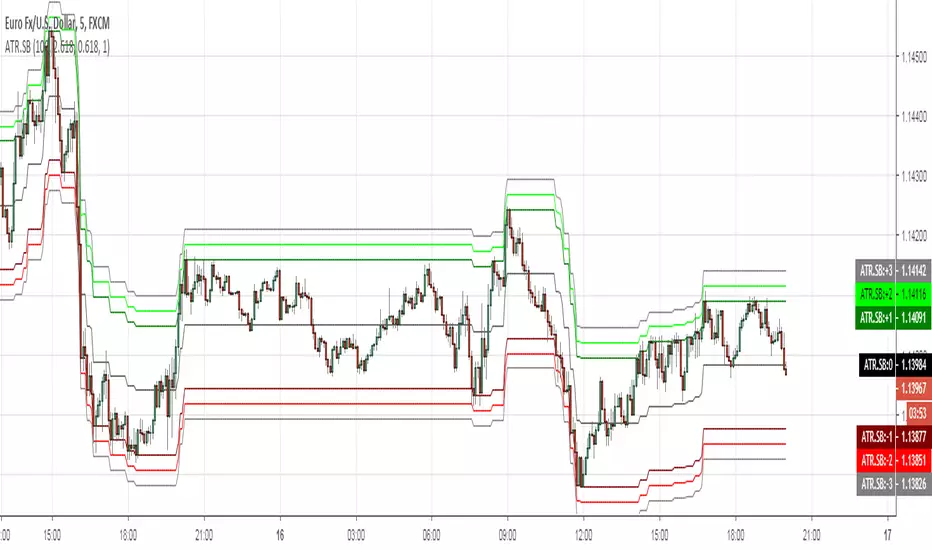
FIBONACCI BANDS by KIVANCfr3762Calculated with a default value of 14 periods of EMA and 14 periods of Average True Range ( SMA )
There are 4 levels of upper bands and 4 levels of lower bands in the indicator
its calculated adding and subtracting ATR( SMA ) values with coefficients 1, 1.618, 2.618 and 4.236 (Fibonacci ratios) to EMA of close prices.
Top and Bottom Fibo lines are aceepted as significant Resistance and Support levels.

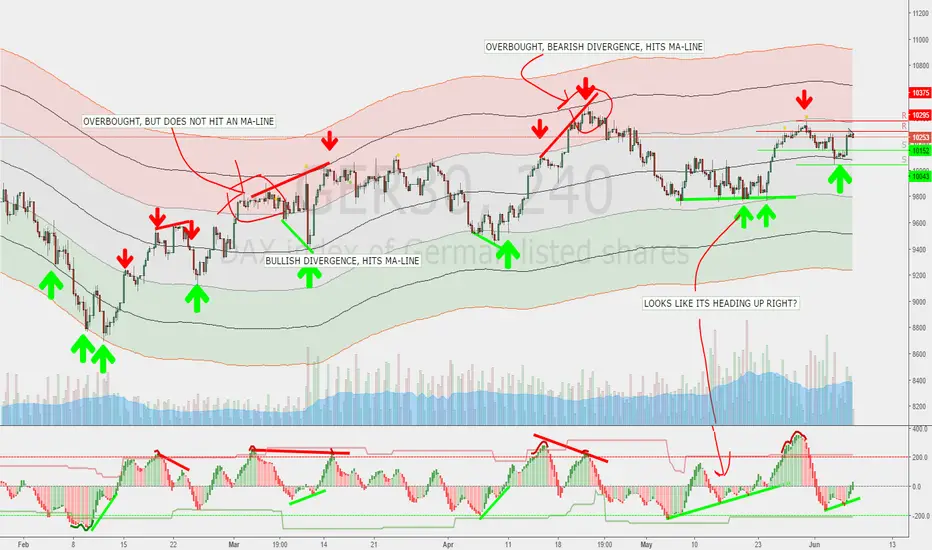
Yacine MA Bands ModMashed together the ema-bands from IvanLabrie with some moving average script stuff from ChrisMoody and LazyBear and this is the result. Credit goes to them, 'cause I don't know to how to code tbh. Just copy/pasted stuff untill I got the result I wanted.
Bands work as support/resistance among other things. You can use them to trade breakouts or reversals or whatever.
Combining them with a momentum indicator would probably be useful for timing divergence or OB/OS and stuff like that.
Included moving average types;
SMA
EMA
RMA
WMA
VWMA
HullMA
TilsonMA
TEMA
Not sure if all of them works as they should... y'know since I cant code/script. Looks good to me though.¨
Default should work pretty good for the DAX, But you'll probably want to fiddle a bit with the settings.
Here's a pic of how they can be used. Ofc everything looks simple in hindsight, but you get the point.
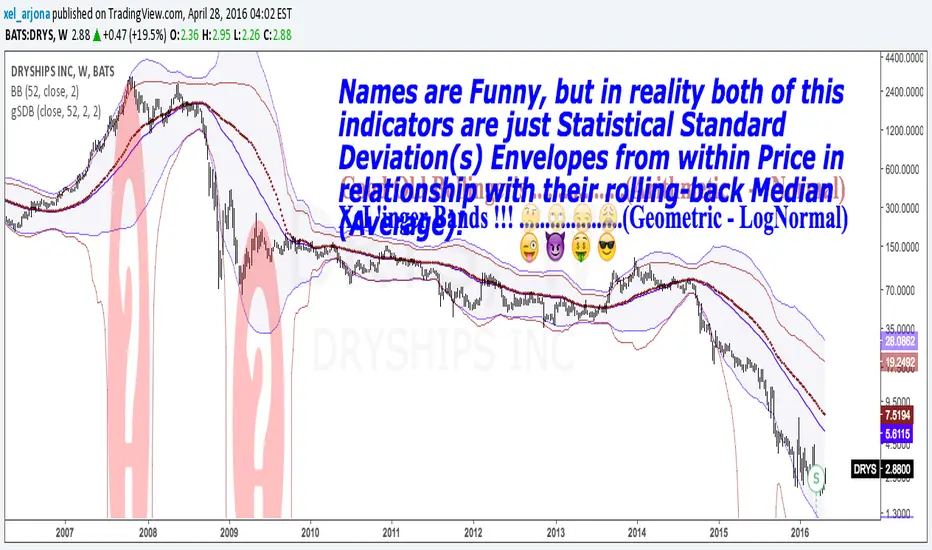
GEOMETRIC STANDARD DEVIATION BANDS v1 by @XeL_ArjonaGEOMETRIC STANDARD DEVIATION BANDS
Ver.1 By Ricardo M Arjona @XeL_Arjona
DISCLAIMER:
The Following indicator/code IS NOT intended to be a formal investment advice or recommendation by the author, nor should be construed as such. Users will be fully responsible by their use regarding their own trading vehicles/assets.
The embedded code and ideas within this work are FREELY AND PUBLICLY available on the Web for NON LUCRATIVE ACTIVITIES and must remain as is.
WHAT'S THIS?
This IS NOT the wheel "Re-Invention"... This is exactly what the name says: A pair of Envelope Bands to measure "volatility", constructed at statistical relation from within price series and their Rolling back MEAN (Simple Moving Average). YES, What Mr. Bollinger did and put it's name to this simple, cleaver and popular formula.
This time, I took the time to make another simple mod, but seems to me to be quite functional in REAL VOLATILE assets like in the example chart: TO USE THEIR GEOMETRIC MODE!!
Cheers!
Any feedback or public modification(s) are quite welcome to the community....!
@XeL_Arjona
Apr 28 2016